ASSESSING FAÇADE VISIBILITY IN
3D CITY MODELS FOR CITY MARKETING
F. Albrecht a,
*, J. Moser a, I. Hijazi b
a
Department of Geoinformatics – Z_GIS, Salzburg University, 5020 Salzburg, Austria - (florian.albrecht, julia.moser)@sbg.ac.at
b Urban Planning Engineering Department, An-Najah National University,
P.O.Box:7, West Bank, Palestine - [email protected]
Commission II, WG II/2
KEY WORDS: Visibility analysis, human visual perception, workflow analysis, requirements analysis.
ABSTRACT:
In city marketing, different applications require the evaluation of the visual impression of displays in the urban environment on people that visit the city. Therefore, this research focuses on the way how visual displays on façades for movie performances are perceived during a cultural event triggered by city marketing. We describe the different visibility analysis methods that are applicable to the analysis of façades. The methods advanced from the domains of Geographic Information Science, architecture and computer graphics. A detailed scenario is described in order to perform a requirements analysis for identifying the requirements to visibility information. This visibility information needs to describe the visual perception of displays on façades adequately. The requirements are compared to the visibility information that can be provided by the visibility methods. A discussion of the comparison summarizes the advantages and disadvantages of existing visibility analysis methods for describing the visibility of façades. The results show that part of the researched approaches is able to support the requirements to visibility information. But they also show that for a complete support of the entire analysis workflow, there remain unsolved workflow integration issues.
* Corresponding author
1. INTRODUCTION
One of the purposes of city marketing is the promotion of a city, or a part of it, in order to have certain activities take place there (Smyth, 1994). Depending on the intentions of how the city shall be perceived, i.e. the marketing strategy of a city, certain developments are promoted and activities supported. For example, the Altstadt Salzburg Marketing Ges.m.b.H., the city marketing of the old-town of Salzburg, Austria, therefore follows an interdisciplinary approach to account for economic, social and cultural aspects of city development (Altstadt Salzburg Marketing Ges.m.b.H., 2013). They emphasize the visual impression of the city, both for tourism and for addressing the local residents. The city architecture, its streets and squares are often used for public cultural and sports events. Visual displays on the streets and on the buildings are often part of such art campaigns and public events. They also play a role for commercial advertisement. Therefore, the way how visual displays on façades are perceived shall here be researched with applications of city marketing.
The application field of city marketing has also relevance for similar applications in outdoor advertising, in human computer interaction research and in optometrics. In outdoor advertising, visual displays are analysed by the amount of attention they raise to the public. Each display has a commercial value depending on its visual impact on its surrounding (Sissors and Baron, 2010). May et al. (2009) conduct a GPS survey for the evaluation of outdoor advertising where standardised areas indicate the visibility of each display. In human computer interaction research, the visual impression in an arrangement of interactive public displays influences how people interact with
the displays (Koppel et al., 2012). Public displays in hospitals have been researched with isovist analysis (Scupelli et al., 2007). The research field of optometrics provides studies on human observers in viewing visual display terminals, e.g. the viewing comfort of displays at work (Rempel et al., 2007) or for identifying risks of viewing 3D displays (Howarth, 2011). The studies in optometrics also imply a spatial configuration in the test set-up, where the visual display is presented to the test person at the ideal position according to the device restrictions. Some of these application fields address a different scale but they all have in common that they deal with the way how humans perceive visual displays. For the here presented application case in city marketing, the emphasis of our research lies on the spatial arrangement of a display on a façade and its surrounding urban environment.
For our research we describe the different visibility analysis methods that are applicable to the analysis of façades. For identifying the requirements of analysing the visual perception of displays on façades, a detailed scenario in city marketing is described. The requirements are compared with the visibility information that can be provided by the visibility methods. A discussion of the comparison summarizes the advantages and disadvantages of existing visibility analysis methods for the visibility of façades.
2. METHODS
Visibility analysis distinguishes the environment of an observer in visible parts and non-visible parts. It has a long history in Geographic Information Science (GISc) (Fisher, 1996; Travis et al., 1975; Yoeli, 1985). Viewshed analysis calculates visibility
International Archives of the Photogrammetry, Remote Sensing and Spatial Information Sciences,
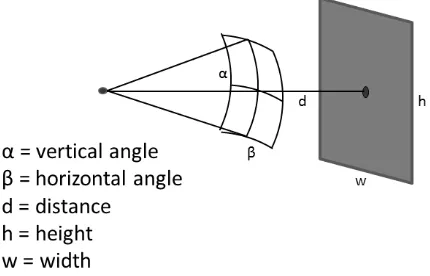
by finding for each position on a terrain if it is visible from a specific observer position or not, thereby generating a binary field. For accounting for human observers, Llobera (2003) extended the GISc understanding of visibility analysis with the concept from Gibson’s ecological approach to visual perception (Gibson, 1986). Llobera (2003) proposes the observer-centric measure of visual exposure that incorporates distance and perspective in the calculation. The visual exposure of an object is based on the viewshed. But it takes the size of the object at a specific terrain location into account. This visible portion of the viewed object depends on its visible height and width and its distance to the observer. These values result in a vertical and a horizontal angle that determine for each observer position the object size in the observer’s field of view (FOV) (Figure 1).
Figure 1: Measuring size of a viewed object by its angles in the observer’s FOV
For measuring the exposure of façades to an observer, there are several methods available. Morello and Ratti (2009) propose the 3D isovist method. The 3D isovist is used for describing visual elements defined by Lynch’s urban analysis (Lynch, 1960), e.g. for tasks like way-finding and for analysing physical and emotional well-being in a city. In a 3D raster of voxels, the so-called isovisimatrix, the 3D isovist method identifies those voxels that are visible from an observer at one voxel position. The visibility is calculated based on a digital surface model in a 2.5D raster that includes all city objects. For a voxel at street level, the method can be specified to calculate the number of visible voxels on the surface of a selected façade. This gives a value for the exposure of the façade at a specific observer location.
Bartie et al. (2010) improve Llobera’s measure of visual exposure for detailed digital surface models, where the viewed objects are larger than a single pixel position. For a first adaption, the surface positions of a feature of interest (FOI) are grouped by an orthographic 2D delineation, thereby treating the positions as a single object to be viewed. The second adaption is done because an urban setting also implies that FOIs are generally viewed from the side. Therefore, each position of the terrain is considered as an extruded square column with side surfaces. An extended viewshed analysis evaluates the visible part of each side surface. By applying these two adaptions, the visible side area of all positions of a FOI add up to the total visible side area of the detailed shape of the FOI object. This area is the basis for a refined exposure value that measures the visible FOI area in angles of the observer’s FOV (Bartie et al., 2010). In the observer’s FOV, Llobera’s exposure only measures the bounding box of a feature by its horizontal and vertical angle. Bartie’s visible FOI area instead measures the
exposure in the observer’s FOV on the basis of the FOI outline and therefore is more detailed.
In addition to GISc visibility analysis, approaches from computer graphics are available making use of the analytical potential of the ray-tracing function of 3D modelling software (Bishop, 2003; Elias and Brenner, 2005). Paliou et al. (2011) investigate indoor structures in the built environment at archaeological sites. They use an approach where the surfaces of a 3D model are textured with visibility information. A single light source is placed at the observer position and illuminates the environment in all directions. Illuminated and shadowed areas on the surfaces of the environment are identified by ray-tracing, i.e. 3D line-of-sight calculations, and indicate visible and non-visible areas. With tools that record surface effects created by lighting, the texture on the viewed FOI surface, e.g. the texture of a wall, is extracted. The process is repeated for all observation points sampled from the area where observers can be located. The resulting textures are combined and evaluated together. Thereby, the visibility method based on ray-tracing is able to calculate the times each pixel of the texture is seen from the observer positions. Also, all observer positions form a field where the visible wall area at each location is available. Angular and distance information from the observer position to the target can also be used as parameters, thereby adding to the potential of ray-tracing tools for visibility analysis in 3D environments.
3. APPLICATION CASE
“FAÇADE VISIBILITY FOR CITY MARKETING”
The application case of façade visibility is an example for assessing the spatial arrangement of a display and its surrounding urban environment. For city marketing, the organisation of city festivals is a popular means to advertise a city to residents as well as to visitors of the surrounding region. For a short period, the city or a part of it is converted into a stage, a theatre, a place for common entertainment. As many people as possible shall be able to enjoy the show. For this use case, we assume a festival of performing arts in the city district Kaiviertel* in Salzburg, Austria, where video installations on façades shall contribute to the overall impression. On such façades, short movies shall be presented that should attract guests to stop and watch for a while. During the planning of the event, the city marketing department is supported by the city’s GIS analyst. He produces an analysis of identifying the best-suited façades within the city district. The required visibility information for the festival planners depends on two main issues: (1) the visibility properties of the façade, i.e. the visual display quality for a single observer somewhere in front of the façade, and (2) the behaviour of all the observers in front of the façade, i.e. how the audience gathers in front of the screen. Together, the two issues define a façade by its potential audience size. The GIS analyst therefore pre-selects all potentially useful facades within the city district and performs the visibility analysis on them. After his analysis, the GIS analyst provides the festival planners with a ranking of all relevant façades that is based on the potential audience size. He includes all other valuable information of the analysis. The planners then can select the façades in the city district where video installations shall be presented.
*
http://www.salzburg-altstadt.at/Kaiviertelfest-11_289.html
International Archives of the Photogrammetry, Remote Sensing and Spatial Information Sciences,
Within this scenario, the evaluation of the view to a visual display can be based on specific criteria of visibility (Figure 2).
Figure 2: Viewing a façade from different perspectives.
The criteria rate façades according to the size of space from where a clear and convenient view is available to the audience in order to follow the demonstrated film. A measure of clearness of the view checks if most of the relevant façade part is visible and if hidden parts are kept to a minimum. Additionally, a number of parameters shall be available for estimating whether a view is convenient, i.e. for characterising the impression that a visual display has on the viewer. These parameters identify the size and the shape that the visual display has in the observer’s FOV. Thereby the influence of the viewing distance and the viewing angle is also implied.
The distance affects the size of the display in the observer’s FOV. The range of distance is limited by the resolution of the display and the display size. If the observer is too far away, not all the detail is visible. If she is too close, the display cannot be viewed entirely at once. The viewing angle affects the shape of the visual display. It is inconvenient if the shape in the observer’s FOV deviates too much from the original shape of the display, e.g. when the observer sees the display too far from the side. Therefore, a maximum rate of distortion limits the viewing angle. For displays on façades, other spatial parameters like the presence of windows on the façade may generally play a role but are not considered here.
Every possible observer location within the city district has to be evaluated so that it contains a value of the visual quality of the façade. The possible observer locations are in the space where people can stand and have to consider the spatial arrangement of houses and other obstacles where people cannot be. This area has to be sampled in a way that gives each observer of the audience a convenient amount of space. The area with positions of acceptable visual quality specifies the auditorium size of the façade. This analysis is repeated for each façade. A ranking for all façades in the city district results that helps to identify the most suitable façades for video installations.
Further requirements cover the environment and the representation of the input data. The analysis process includes database functions, like the pre-selection and final ranking of façades. The sampling of an area with observer positions is a required GIS function. All these have to be performed within the GIS environment available to the GIS analyst. Therefore, the intended visibility analysis functions need to be part of this
GIS environment. Otherwise it would be difficult to integrate them in the analysis workflow.
The input data needs to represent the urban environment of the city district in the area that is relevant to the analysis. For selecting and querying the façades, the data needs to be structured in a way that it can be filtered. All the façades need to be represented uniquely by an object each and need to be identifiable as a façade with adequate properties attached to it. This includes the possibility to generate properties for the new visibility information to be generated. Façades are generally vertical and touch the façades next to them in a vertical line. Therefore, each façade’s spatial properties need to represent its shape in 3D space, with width and height. The height may differ according to the roof shape and the base line where the façade touches the terrain. These delineations have to be represented in 3D, as well. The representation of the urban environment shall include all obstacles, i.e. all other surfaces that may influence the outcome of the visibility analysis. This includes the built environment, the terrain and the vegetation. Finally, the observer area, i.e. the area where observers can potentially be, needs to be identifiable through the representation of the environment. For the observer locations, the position needs to be measurable in 3D within the observer area.
4. RESULTS
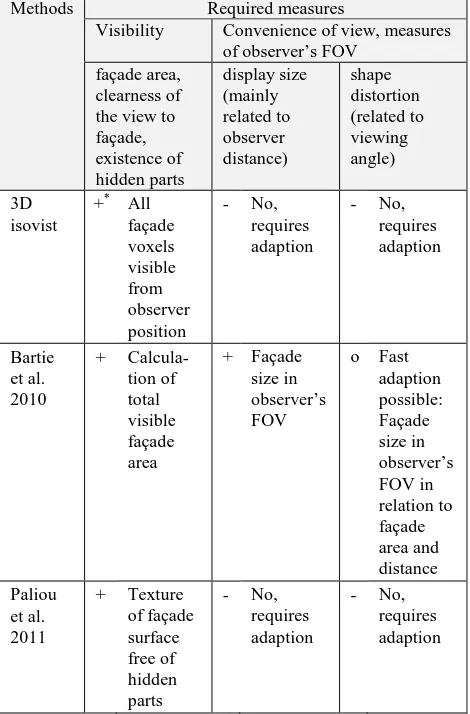
The GIS analysis task that is embedded in the scenario description of the city marketing workflow defines a list of requirements to the output visibility information. The visibility methods of 3D isovist, the approach of Bartie et al. (2010), and of Paliou et al. (2011) are evaluated against these requirements. They can (1) provide this information completely and thereby fulfil the requirement; they can (2) provide information partly and would fulfil the requirement by easy steps of adaptation; or (3) they may not be able to fulfil the requirement easily. The results are presented in table 1.
International Archives of the Photogrammetry, Remote Sensing and Spatial Information Sciences,
Table 1: Comparison of scenario requirements to visibility analysis methods
Methods Required measures
Visibility Convenience of view, measures of observer’s FOV
*Requirements fulfilled (+), partially fulfilled (o) or not fulfilled (-), respectively.
All of the compared visibility analysis methods are capable of estimating if the view to the depending façade is clear of any obstacles and no parts of the façade area are hidden from the observer. Therefore the methods can be used to identify the field of locations in the streets from where the total façade can be viewed. For estimating the convenience of view only Bartie et al. (2010) offer visibility information. The other two methods do not cover the possibility to calculate angular measures of the observer’s FOV. Bartie et al. (2010) is capable of retrieving the size of the façade in the observer’s FOV. For measuring the façade distortion, no direct measure is available. But a workaround is possible that compares the size of the façade in the observer’s FOV to the façade area.
5. DISCUSSION
Although with Bartie et al. (2010) the comparison of the different visibility methods shows a clear winner, there are a few other issues to consider. The scenario shows that the visibility method needs to be embedded in the GIS analysis workflow. When regarded independently from restrictions of the visibility analysis methods, the requirements show that a 3D city model should be an appropriate input data format. If such data is used with the methods provided by Bartie et al. (2010), an additional conversion to a 2.5D terrain model would be
necessary, first. This may lead to tedious workarounds and possibly to inaccuracies in the analysis process. Therefore, a more detailed insight into 3D city models and into adequate adaptions of visibility analysis methods are required in order to guarantee appropriate workflow integration.
6. REFERENCES
Altstadt Salzburg Marketing Ges.m.b.H., 2013. Stadtmarketing, Salzburg, Austria http://www.salzburg-altstadt.at/stadtmarketing_117.html (01 Jul. 2013).
Bartie, P., Reitsma, F., Kingham, S. and Mills, S., 2010. Advancing visibility modelling algorithms for urban environments. Computers Environment and Urban Systems, 34(6): 518-531.
Bishop, I.D., 2003. Assessment of visual qualities, impacts, and behaviours, in the landscape, by using measures of visibility. Environment and Planning B-Planning & Design, 30(5): 677-688.
Elias, B. and Brenner, C., 2005. Automatic generation and application of landmarks in navigation data sets. Developments in Spatial Data Handling. Springer-Verlag Berlin, Berlin, 469-480 pp.
Fisher, P.F., 1996. Extending the applicability of viewsheds in landscape planning. Photogrammetric Engineering and Remote Sensing, 62(11): 1297-1302.
Gibson, J., 1986. The Ecological Approach To Visual Perception. Psychology Press.
Howarth, P.A., 2011. Potential hazards of viewing 3-D stereoscopic television, cinema and computer games: a review. Ophthalmic and Physiological Optics, 31(2): 111-122.
Koppel, M.T., Bailly, G., Müller, J. and Walter, R., 2012. Chained displays: configurations of public displays can be used to influence actor-, audience-, and passer-by behavior, Proceedings of the SIGCHI Conference on Human Factors in Computing Systems. ACM, Austin, Texas, USA, pp. 317-326.
Llobera, M., 2003. Extending GIS-based visual analysis: the concept of visualscapes. International Journal of Geographical Information Science, 17(1): 25-48.
Lynch, K., 1960. The image of the city. Publications of the Joint Center for Urban Studies. Technology Press, Cambridge Mass., 194 p. pp.
May, M. et al., 2009. Modelling missing values for audience measurement in outdoor advertising using GPS data. In: S. Fischer, E. Maehle and R. Reischuk (Eds), Informatik 2009 Im Focus das Leben. Lecture Notes in Informatics. Gesellschaft für Geoinformatik, Bonn, Lübeck, pp. 3993-4006.
Morello, E. and Ratti, C., 2009. A digital image of the city: 3D isovists in Lynch's urban analysis. Environment and Planning B-Planning & Design, 36(5): 837-853.
Paliou, E., Wheatley, D. and Earl, G., 2011. Three-dimensional visibility analysis of architectural spaces: iconography and visibility of the wall paintings of Xeste 3 (Late Bronze Age Akrotiri). Journal of Archaeological Science, 38(2): 375-386.
Rempel, D., Willms, K., Anshel, J., Jaschinski, W. and Sheedy, J., 2007. The effects of visual display distance on eye
International Archives of the Photogrammetry, Remote Sensing and Spatial Information Sciences,
accommodation, head posture, and vision and neck symptoms. Hum Factors, 49(5): 830-8.
Scupelli, P.G., Kiesler, S. and Fussell, S.R., 2007. Using isovist views to study placement of large displays in natural settings, CHI '07 Extended Abstracts on Human Factors in Computing Systems. ACM, San Jose, CA, USA, pp. 2645-2650.
Sissors, J.Z. and Baron, R.B., 2010. Advertising media planning. McGraw-Hill, New York, xiv, 480 p. pp.
Smyth, H., 1994. Marketing the city : the role of flagship developments in urban regeneration. E & FN Spon, London ; New York, xv, 289 p. pp.
Travis, M.R., Elsner, G.H., Iverson, W.D. and Johnson, C.G., 1975. VIEWIT: Computation of seen areas, slope, and aspect for land-use planning. , General Technical Report PSW-11/1975. Forest Service, U.S. Department of Agriculture, Berkeley, California, USA, pp. 70 p.
Yoeli, P., 1985. The Making Of Intervisibility Maps With Computer And Plotter. Cartographica: The International Journal for Geographic Information and Geovisualization, 22(3): 88-103.
International Archives of the Photogrammetry, Remote Sensing and Spatial Information Sciences,