MONITORING OF SNOW COVER VARIATION USING MODIS SNOW PRODUCT
Nima Fayaza*, Majid Vazifedoustb, Shahab Araghinejadc
a
M.Sc. Student, Department of Irrigation & Reclamation Engineering, Faculty of Agricultural Engineering & Technology, College of Agriculture & Natural Resources, University of Tehran, Iran- [email protected]
b
Assistant Professor, Water Engineering Department, University of Guilan, Iran- [email protected] c
Assistant Professor, Department of Irrigation & Reclamation Engineering, Faculty of Agricultural Engineering & Technology, College of Agriculture & Natural Resources, University of Tehran, [email protected]
KEY WORDS: MODIS, Snow Cover, Trend, Mann-Kendal, Karoun, Iran
ABSTRACT:
Snow is one of the integral components of hydrological and climatic systems. Needless to say, snow cover areas (SCA) are considered as indispensable input of hydrological and general circulation models. Studying the spatial and temporal variability of SCA is of the paramount importance for tremendous variety of research such as climate change, water supply and properly managing water resources. In this study by means of Moderate Resolution Imaging Spectroradiometer (MODIS) snow cover product, the variation of snow cover extent (SCE) in Karoun basin located in western part of Iran is evaluated for twelve years' duration; since 2000 to 2012. The results show that the paramount occurrence of SCE is observed during February months of 2003, 2010 and 2011 as well as during December months of 2006 and 2009.The utmost occurrence of SCE is considered during January months of the other remaining years. Annual average shows that SCE varies from 11% in 2011 to 22% in 2006. According to Mann-Kendal trend test, throughout twelve years; 2000 to 2012, a majority of the pixels in the study area have no considerable trend although there is a decreasing trend on a small portion of the pixels located in the eastern part the study domain.
1. INTRODUCTION
Snow cover analyses in mountainous regions are important for various purposes such as snow mapping, climate studies, and predicting discharg or snowmelt runoff forecasting. An early warning of snow-caused disasters will be a decisive as well as contributory factor in policymakers' decisions regarding the diminution of the potential damages caused by snow. Snow ground measurements implemented at climate stations facilitate the provision of authoritative information about snow depth in a specific region which is considered as important ground control points for validation of snow cover extent (SCE) determined by remote sensing tools. According to extreme environmental conditions in different parts of an area, in situ measurements are limited and therefore monitoring the spatial variation of snow cover area (SCA) poses a multitude of difficulties. Moreover, airborne measurements only have the capability to obtain the information of snow in local scales and brief duration. Satellite-based remote sensing has provided a useful tool for spatial and temporal monitoring of variation and distribution of SCE in regional and global scales. Satellite data in the visible and the infra-red spectrum as well as in the passive microwaves represent an alternative source of information on snow cover. Snow cover products provided by microwave sensors such as Scanning Multichannel Microwave Radiometer (SMMR), Special Sensor Microwave/Imager (SSM/I) and Advanced Microwave Scanning Radiometer–EOS (AMSR-E) are used to monitor SCA in global scale due to their coarse spatial resolution. The images of LANDSAT optical sensor has a higher spatial resolution comparing to microwave data, but its low temporal resolution (16 day) circumscribes the ability of this satellite in monitoring SCE. The Moderate Resolution Imaging Spectroradiometer (MODIS), carried aboard the Terra spacecraft launched in 1999 and Aqua satellite launched in 2002, provides the only global snow cover products available at sufficient spatial and temporal resolution to monitor snow extent. The freely MODIS images, with 500 m spatial and daily temporal resolution, available from 2000 to present,
provide an essential basis for monitoring of snow cover variation.
Many studies relating to the application of MODIS snow product in mapping SCA have been conducted in recent years. Tekeli et al (2005) compared daily snow cover maps obtained from MODIS images with ground information both during accumulation and ablation period. The analyses showed that there is a good agreement between MODIS snow maps and in situ measurements with overall accuracies ranging between 62% and 82% considering the shift in the days of comparison. Liang et al (2008) analyzed the accuracy of MODIS snow cover mapping algorithm under varied snow depth and land cover types by means of Terra/MODIS snow cover products and in situ observation data. They found that the overall accuracy of MODIS daily snow cover mapping algorithm in clear sky condition is as high as 98.5%; snow agreement reaches 98.2%, and ranges from 77.8% to 100% over the 4-year period for individual sites. Sirguey et al (2009) described a comprehensive method to produce routinely regional maps of seasonal snow cover in the Southern Alps of New Zealand on a sub pixel basis, and with the MODIS. The overall results showed that sub pixel snow fractions were obtained with a Mean Absolute Error of 6.8% at 250 m spatial resolution and 5.1% after aggregation at 500 m spatial resolution. In addition, it showed that 90% of the snowlines were depicted generally within 300 m and 200 m of their correct position for the 500 m and 250 m spatial resolution snow maps, respectively. Paudel and Andersen (2011) studied the spatial and temporal variability of snow cover in the Trans Himalayan Region (THR) of Nepal in the last decade and removed cloud obscuration from MODIS daily snow products using spatial filtering based on a zonal snowline approach; and temporal filtering based on zonal snow cycle. The results indicated a very high inter annual and intra seasonal variability of average snow cover; maximum snow extent and snow cover duration over the last decade. They also showed that their proposed method was efficient in cloud reduction with average accuracy of about 91%. Gao et al (2012) investigated the spatial and temporal distribution of snow in eastern Tibet using the
International Archives of the Photogrammetry, Remote Sensing and Spatial Information Sciences, Volume XL-1/W3, 2013 SMPR 2013, 5 – 8 October 2013, Tehran, Iran
microwave long-term snow cover dataset of China and MODIS snow product. They also used TFPW-MK (Trend-free pre-whitening Mann– Kendall) to examine the trend of temperature and precipitation with time. The results showed a significant increase in annual precipitation and an increase in monthly air temperatures for the fall through spring months and as a result the length of the snow covered season appears to be decreasing at lower elevation because of the increase in air temperatures. This study investigates the variation of SCE in Karoun basin located in western part of Iran during twelve hydrologic years; since 2000-2001 to 2011-2012 using MODIS snow cover product. The baseline data set for this purpose is MODIS 8-day snow cover product archived and distributed by National Snow and Ice Data Centre (NSIDC).
2. METHODOLOGY
2.1 Data
2.1.1 Satellite Data
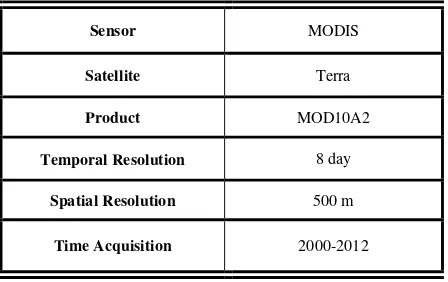
The Terra MODIS 8-day snow cover product (MOD10A2) was used in this study in order to monitor the evolution of snow cover in Karoun basin. The complete information of the data used in this study is summarized in table 1.
Sensor MODIS
Satellite Terra
Product MOD10A2
Temporal Resolution 8 day
Spatial Resolution 500 m
Time Acquisition 2000-2012
Table 1: Information of MODIS data
2.1.2 Study Area
Karoun river basin is located in western part of Iran, stretching from 48 E to 52 E and from 30 N to 33 N. The total study area located extremely in mountainous terrain is about 60,000 km2. Approximately 90% of Karoun basin situated in north-east has an elevation of more than 1500 m. This area receives considerable precipitation in winter, mostly in the form of snow which makes the terrain the main source of water for Karoun River. Figure 1 shows the map of Karoun basin.
Figure 1. Map of Karoun basin
2.2 Algorithm
The Normalized Difference Snow Index (NDSI) has been applied widely to optical imagery to discriminate snow from other targets. Distinguishing snow using NDSI is based on the fact that snow has a high reflectance in the visible wavelengths and low reflectance in the shortwave infrared part of the spectrum. The automated MODIS snow mapping algorithm uses reflectance in MODIS bands 4 (0.545- 0.565 μm) and 6 (1.628
-1.652 μm) to calculate NDSI (Hall et al., 2002). This algorithm also employs Normalized Difference Vegetation Index (NDVI) to detect snow in forested terrain as snow has a low value of NDVI.
2.3 Image Processing
To cover the study area, two tiles of MOD10A2 (h21v05, h22v05) for the period 2000 to 2012 were acquired from NSIDC website. Using MATLAB image processing tool, the images were imported, the two tiles were mosaicked, the study domain separated from the whole image and the number of snow pixels in the study area at elevation intervals of about 700m were determined. To determine the number of snow pixels in different elevation zones, the data from Digital Elevation Model (DEM) provided by Shuttle Radar Topographic Mission (SRTM) was used in this study. In order to match the resolution of MOD10A2, the resolution of SRTM images was resampled from 90m to 500m. Mann-Kendal trend test on SCE was also used in this study to examine if there is any trend in the pixels existing in the study domain during the time period between 2000 and 2012.
3. RESULTS
Using 7 different elevation zones of 700 m, inter annual variation of snow cover was analyzed through the years 2000-2012 (Figure 1). The analyses show that snow accumulates mostly at elevation between 2100 and 2800 m while the least snow accumulation occurs at elevation above 4200 m. The analyses also show that the percent of SCA at elevations in the ranges of 0-700 and 700-1400 is below 2%.
International Archives of the Photogrammetry, Remote Sensing and Spatial Information Sciences, Volume XL-1/W3, 2013 SMPR 2013, 5 – 8 October 2013, Tehran, Iran
0
Figure 1. Inter annual variation in SCA for each 700 m of elevation
The overall results depict that according to annual average of SCA through 2000 to 2012 for each 8-day, snow starts to accumulate from about late-October to late- January, and begins to decrease from mid February to end of April which shows that this period is the main snow melt season in the study area
October November December January February March April May
S
Figure 2. Variation of annual average for each 8- day
The results also show that the maximum occurrence of SCE is observed in February during the years 2003, 2010, 2011 and is observed in December during 2006 and 2009. In the remaining years the maximum SCE is observed in January.
Annual average of SCA shows that there is a variation ranging from 11% in 2011 to 22% in 2006 as depicted in figure 3.
1999 2000 2001 2002 2003 2004 2005 2006 2007 2008 2009 2010 2011 2012
S
Figure 3. Inter annual variation in SCA, 2000-2011
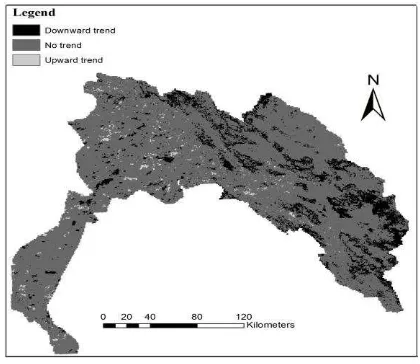
Figure 4 shows Mann-Kendal trend test on SCA in the study domain. According to Mann-Kendal test, during the period 2000 to 2012, a majority of the pixels in the study area have no considerable trend although there is a decreasing trend on a small portion of the pixels located in eastern part the study area.
Figure 4. Mann-Kendal trend test on SCA
4. CONCLUSION
In this study the variation of spatial and temporal distribution of SCE was analyzed for the period of time between 2000 and 2011 in Karoun basin located in western part of Iran. The fundamental dataset, for this purpose, was MOD10A2. The analyses illustrated that snow accumulation mostly occurred at elevation between 2100 and 2800 m. According to annual average, the maximum value of SCA was observed in 2006 while the minimum occurred in 2011. In addition the results showed that according to Mann-Kendal trend test, during the years 2000 to 2011, many of the pixels in the study area had no considerable trend, although a small part of the eastern part of the study domain experienced a downward trend.
5. REFRENCES
Gao, J., Williams, M. W., Fu, X., Wang, G., & Gong, T., 2012. Spatiotemporal distribution of snow in eastern Tibet and the response to climate change. Remote Sensing of Environment, 121, 1-9.
Hall, D. K., Riggs, G. A., Salomonson, V. V., DiGirolamo, N. E., & Bayr, K. J., 2002. MODIS snow-cover products. Remote sensing of Environment, 83(1), 181-194. Northern Xinjiang, China. Remote Sensing of Environment, 112(4), 1514-1526. removal methodology. Remote Sensing of Environment, 115(5), 1234-1246.
Sirguey, P., Mathieu, R., & Arnaud, Y., 2009. Subpixel monitoring of the seasonal snow cover with MODIS at 250 m spatial resolution in the Southern Alps of New Zealand: Methodology and accuracy assessment. Remote Sensing of Environment, 113(1), 160-181.
International Archives of the Photogrammetry, Remote Sensing and Spatial Information Sciences, Volume XL-1/W3, 2013 SMPR 2013, 5 – 8 October 2013, Tehran, Iran
Stroeve, J., Box, J. E., Gao, F., Liang, S., Nolin, A., & Schaaf, C., 2005. Accuracy assessment of the MODIS 16-day albedo product for snow: Comparisons with Greenland in situ measurements. Remote Sensing of Environment, 94(1), 46-60.
Tekeli, A. E., Akyürek, Z., Arda Şorman, A., Şensoy, A., & Ünal Şorman, A., 2005. Using MODIS snow cover maps in modeling snowmelt runoff process in the eastern part of Turkey. Remote Sensing of Environment, 97(2), 216-230.
International Archives of the Photogrammetry, Remote Sensing and Spatial Information Sciences, Volume XL-1/W3, 2013 SMPR 2013, 5 – 8 October 2013, Tehran, Iran