THE DESIGN AND IMPLEMENTATION OF AN OPTICAL ASTRONOMICAL
SATELLITE TRACKING SYSTEM
F. Samadzadegana, F. Alidoost a, *
a Department of Geomatics, Faculty of Engineering, University of Tehran, Tehran, Iran - (samadz, falidoost)@ut.ac.ir
KEY WORDS: Satellite Tracker, Orbital Parameters, Streak, Star Identification, Star Catalogue, TLE, Matched Filter.
ABSTRACT:
This paper presents a satellite tracking method based on optical celestial images. The proposed method is composed of two acquiring modes that are called Sidereal Stare Mode (SSM) and Track Rate Mode (TRM). To track the unknown satellites, first of all the entire of the sky is observed and the primary knowledge of the satellite location is predicted in SSM. Then, the measured pointing data is calculated and used by the telescope to acquire the satellite tracking images at the appropriate time. The framework of SSM contains main steps such as the image correction due to the noise and the image background by applying the iterative filtering methods, the star detection and removal using a double gate filter and PSF concepts, the star identification for image calibration based on a star catalogue, the streak detection of the satellite using the matched filter and finally, the extraction of the celestial coordinate of the satellite as a predicted position. In TRM, the group of star streaks should be identified in the free background image. Then, Fast Fourier Transformation (FFT) is applied and the characteristic of star streaks are extracted. Finally, the centroid of the satellite is estimated precisely by applying a binary mask and the right ascension and declination of it is calculated using astrometric transformation parameters. In this study, the searching and tracking algorithms is applied on the simulation images to detect and identify the satellite position in the sky. Therefore, a telescope along with a CCD camera is simulated to generate sequences images using the well-known star catalogues, the optical and orbital parameters. The precise celestial coordinate of a real satellite and two fictitious satellites are obtained from simulated images. The study results show that the accuracy of the satellite estimated position after star calibration is better than 5 arc seconds and the satellites tracking accuracy is around 1-3 arc seconds.
* Corresponding author.
1. INTRODUCTION
In space application, the information about the location of the resident space objects such as satellites, space junk, and other orbital objects is critical (Mehrholz, 2002; Liou, 2007; Leitch, 2010). This information is used to observe the space objects periodically and track them exactly (Simms, 2011; Kim, 2011). Since, the location and trajectory of the space objects, specifically the satellites, are changed; their observations need to be repeated in duration of time (Vincent, 2012; Schildknecht, 2007; Earl, 2000). Therefore, many organisations such as Defence Research and Development (R&D) of Canada, China’s Shanghai Observatory and US Air Force (USAF), developed their ground based stations using telescopes to observe and track the satellites (Duke, 2012; Zhang, et. al., 2012).
The USAF Academy developed a satellite tracking system for up-dating the orbital parameters (Bruski, 2012). The system includes optical components, tracking mount, tracking software and hardware which can provide the images of the 6th magnitude satellites (Bruski, 2012).
The R&D of Canada developed an automated small telescope for orbital researches in 2000 that is called CASTOR. This system is used to track the satellites in 10000 km height or more and can record images to extract accurate data for updating orbital parameters (Earl, 2010).
The Lawrence Livermore National Laboratory designed a small-aperture telescope to extract and improve the orbital parameters of Galaxy 15 satellite. The optical observations were performed at sidereal tracking mode and the new streak extraction algorithm and batch/sequential least squares orbital fitting are applied on celestial images (Nikolaev, 2011).
Since, the used techniques for detecting and positioning of the satellites mostly consist in astronomical images acquired by optical sensors; the efficient and precise algorithms need to be developed for an optical satellite tracking system.
1.1 General Concepts
In order to define the location of the satellite in the sky and then to update its orbital parameters, an optical satellite tracking system can be designed which acquires sequences astronomical images from the sky. Such system is composed of many sensors like a telescope, a CCD camera, a GPS receiver, etc. Also, some reference data such as the star catalogues and the Two Lines Element (TLE) database are used. The telescope is used to search the sky and point to the satellite, precisely. The CCD camera acquires some sequences images in a current time provided by GPS. The star catalogues are employed to calibrate the image plane to the celestial coordinate systems. The TLE database contains the out-dated orbital parameters to estimate the satellite position. The relation between the sub-systems and reference dataset is shown in Figure 1. The general framework of acquiring images using ground-based optical systems for tracking the satellite is composed of two approaches: The TLE is existed or not.
In the first approach, the predicted position and the motion of a user requested satellite can be calculated at the moment time using the TLE dataset and a propagator. But this data is not updated. On the other hand, the unknown satellites or other object spaces cannot be searched and detected by this method.
In the second approach, entire of the sky is monitored and sequences images are acquired until a satellite is observed. This acquisition mode is called Sidereal Stare Mode (SSM) and
sequence images contain point-like stars and the streak-like satellite. By a set of processing techniques, the position of the satellite is predicted at the current time.
Figure 1. General framework of detection and tracking the satellite
After predicting position of the satellite, some acquisition commands are generated in Track Rate Mode (TRM) and at the appropriate time, the telescope is pointed to the satellite using the measured position of the satellite and the images are acquired by a CCD camera. In this mode, stars appear as streak and the satellite is a point source in the images. Then, the precise celestial coordinate of the satellite can be extracted from acquired images using detection methods. Also, the new orbital parameters can be generated and the TLE dataset can be updated.
In this paper, a searching and tracking scheme used by an optical satellite tracking system is implemented using simulated astronomical images.
2. PROPOSED METHOD
The main goal of the proposed method is addressed the efficient algorithms to track both the known and unknown satellites using celestial images in two acquisition modes (SSM and TRM). All these algorithms are applied on simulated celestial images (Figure 2). Therefore, some simulation parameters are considered for optical sensor such as CCD size, focal length, image size, field of view of telescope and exposure time. Also, orbital parameters are used to define the speed motion and primary position of satellite which are extracted from the TLE.
Figure 2. Image acquisition modes: SSM (left) and TRM (right)
In this study, the detection and tracking algorithms are divided into three general groups in each mode as image correction algorithms, star algorithms, and satellite algorithms. The
correction algorithms are employed to remove noise and background of the images. The aim of star algorithms is to identify of stars in celestial coordinate system. The satellite algorithms are used to extract satellite position.
2.1 Sidereal Stare Mode Algorithms
Figure 3 demonstrates the steps of SSM implementation. The image acquired by the camera includes several artefacts such as
detector’s bad pixels, noise and a background. The first group
of algorithms is correction algorithms that are used to eliminate the artefacts and background of the image. It is assumed that the noise has Gaussian distribution and the 3-sigma rule is used to remove it. For this, the standard deviation is calculated. Since spike noise is single pixel with the brightness value greater than the 3 standard deviation of normal distribution, they are easily identified and removed from the image.
Figure 3. SSM algorithms
There are some popular methods such as using a dark fame or iterative background removal method in order to estimate and remove the background of the image. A dark frame is an image acquired with the same conditions of CCD temperature and exposition time but without a signal (Levesque, 2009). In second method, the local image average pixel value is calculated with polynomial fit or with local statistics in iterative steps. The model of polynomial is calculated based on the third order over each of the image columns as the equation 1 (Lelievre, 2007).
Pixel (i, j) = P0j + P1j i + P2j i 2
+ P3j i 3
(1)
where i and j are the number of image rows and columns, and Pk are polynomial parameters (k = 0, 1, 2, 3).
The star algorithms contain the double gate filter to detect and eliminate star points from the image. The detection filter is based on the star PSF and the stars are detected when the average signal in the inner window is high above the noise level while the outer window measures only the background. To erase the detected stars, a median filter is applied on groups of pixels having an equivalent distance from the star central point (Levesque, 2007). The star centroid is extracted which is used to identify stars in celestial coordinate system.
A wide variety of methods for star identification exist that most of them are based on calculations of angles between observed stars (Ho, 2012; Spratling, et. al., 2009; Cole, et. al., 2004). These methods use a database of reference stars that is
called “star catalogue”. A widely used or well-known
catalogues set can be used to provide astronomical data. The star catalogue usually includes inertial coordinates and visual magnitude of stars on the celestial sphere. The coordinates of a star are defined by two angles in the International Celestial Reference System (ICRS), which is consistence with the older J2000 equinox system. These angles are the right ascension (Ra) in hour and the declination (Dec) in degree and are related to a rotation around the z-axis and y-axis, respectively. The visual magnitude (Mv) is a measure of star brightness. The 3-D model of the star catalogue used for star identification presented in this study can be seen in Figure 4.
Figure 4. 3-Dimensional of the star catalogue
One well known and simplest Star-ID method is “angle-based
algorithm” that involves measuring the angular distance
between stars in the FOV and then matching them to angles within a catalogue of angles between stars (Gottlieb, 1978). The angle between two vectors of stars is given by:
= cos-1(r1.r2) (2)
where r1 and r2 are unit vectors pointing to each star in inertial
space and (.) is dot product. As the result of this step, the transformation parameters between image plane and celestial sphere are calculated.
Then, the third group of algorithms is used to detect the satellite streak by an iterative matched filter. In order to design the filter, the prediction of the length and direction of the streak is needed. This information is provided with the angular speed and direction of the satellite. The image is convolved by the template and the signal of streak becomes strong after some iteration. The location of the streak is given by:
R = F-1{I S*} (3)
where R is the filtered image, I and S are Fourier transform of
the input image and the streak filter, and ‘*’ is the complex
conjugate. The clipped image is the minimum between the image before convolution and the convolved image multiplied by two (Levesque, 2009):
In+ 1 = min (In, 2(In
*
streak_template)) (4)where ‘*’ is the convolution operator and I is the input image.
After detection of the satellite, the centroid of its streak is extracted and celestial coordinate of it is calculated using transformation parameters. This position is used to measure pointing data for the telescope in the tracking rate mode.
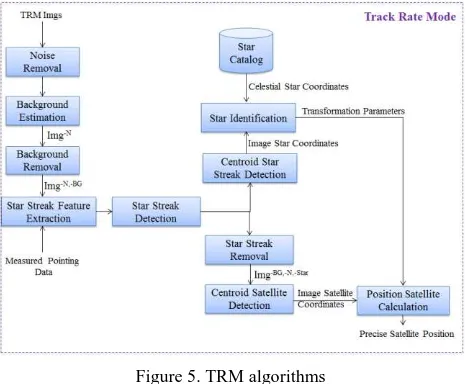
2.2 Track Rate Mode Algorithms
In TRM, the predicted position of the satellite which is calculated in SSM is used to define boresight direction of image plane and then some images are generated at the specific time. Again, the correction, star identification and satellite algorithms are applied on the images. Figure 5 demonstrates the detailed steps of the algorithms in TRM.
Figure 5. TRM algorithms
After eliminating noise and background of the image, the iterative matched filter is used to extract the star streaks. The Fast Fourier Transform (FFT) of an image is generated and the length and orientation of the streak is calculated based on a rectangle function of the streak. The maximum value of the Radon transform of the modulus of the FFT indicates the orientation of the streak and the position of the zeros of the rectangle function is calculated as the length of the streak (Levesque, 2011). The orientation of the streak is given by:
Sθ = Radon (ABS (FFT (I))) (5)
where Sθ is streak orientation and I is the input image. The star streaks on the image are detected with iterative convolution and clipping method. To extract of centre of star streaks and remove them, a binary mask is applied on the image and every streak areas are determined. The mask locates the streak pixels in the background-free image (Levesque, 2010). In star identification process, the image coordinate of the centres of stars are matched to the celestial coordinates and transformation parameters between two systems are calculated.
After removing the star streaks, the precise centre of the satellite is calculated by using centroiding algorithms with sub-pixel accuracy. The centre of an object is extracted by algorithms such as a Weighted Sum (WS) technique and a Maximum Likelihood Estimator (MLE) technique (Samaan, 2011; Huffman, 2006). Once the image coordinate is extracted, the precise celestial coordinate of the satellite is calculated by transformation parameters between two celestial and image coordinates systems.
3. EXPERIMENTS AND RESULTS
To design an optical satellite tracking system, the orbital parameters and optical specifications need to be defined. Accordingly the orbital parameters from the TLE dataset, the predicted position of the satellite is calculated at the appropriate time.
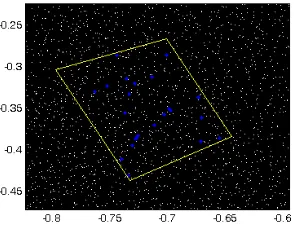
To simulate the sequences images, the telescope system’s configuration such as focal length of lens, CCD detector size, required time to exposure and the field of view are described as a Table 1. In order to create the sky, a 2D/3D model of celestial sphere is generated using a star catalogue such as Hipparcos, SKY2000, SAO or Tycho2. The Hipparcos catalogue contains 118218 stars and is complete to visual magnitude 7.3. The positional accuracies are 1 to 3 mili arc seconds at epoch 1991.25 and the proper motion accuracies are around 1 to 2 mili arc seconds in year. The right ascension and declination of the stars brighter than 7 Mv within sensor’s field of view were mapped to x and y coordinates for plotting in two-dimensions as
it’s shown in Figure 6.
Figure 6. The stars brighter than 7 Mv (blue points) in 1 degree FOV in celestial sphere
To create a real sky image, the boresight direction of the image plane is calculated based on the ground station location and the current time in celestial coordinate system (Ra, Dec, t). The image contains all the stars which are available for the CCD camera system limited by instrument sensitivity and exposure time of the sensor. A simulation scheme for the detection of a satellite is composed of a 10 second exposure time with a FOV of 1 degree.
Specification Value
Image size 512 x 512 pixels
Focal length 30 cm
CCD size 6.5 micron
Instrument sensitivity 7
Table 1. The optical parameters to simulate images
To simulate the point or streak of a satellite, different designs are considered for the TRM and SSM modes. Two fictitious point-like satellites near the center and top of the image are simulated for TRM. For the satellites which are bright enough, four or five images should be simulated. Thus, the magnitude of the first satellite is 2 and other one is 5. In Table 2, the orbital parameters of these satellites are given and Figure 7 illustrates the trajectory of them.
Orbital Parameter Sat_1 Sat_2 Semi major axis (km) 7373.786
2
7451.030 9
Eccentricity 0.002928
2
0.001885 5 Inclination (degree) 90.1461 89.6859 Right Ascension of Ascending
Node (degree)
342.9613 170.7828
Argument of Periapsis (degree) 109.296 291.5641 Mean Anomaly (degree) 251.1322 140.415
Table 2. Orbital parameters of two fictitious satellites
Figure 7. The schematic view of the path of two fictitious satellites (Sat_1 (up), Sat_2 (down))
Also, in SSM, based on the TLE parameters of the Iridium satellite that it is given in Table 3, a streak satellite with 20 pixels length is created. The trajectory of the Iridium satellite is shown in Figure 8.
Orbital Parameter Value
Semi major axis (km) 7155.7808
Eccentricity 0.0002371
Inclination (degree) 86.3941
Right Ascension of Ascending Node (degree) 40.6742 Argument of Periapsis (degree) 82.9304
Eccentric Anomaly (degree) 277.2166
Table 3. TLE parameters of the Iridium satellite
Figure 8. The schematic view of the path of the Iridium satellite
Based on the celestial coordinates of stars obtained from a star catalogue and the prediction pass of the satellites and taking into account optical factors, sequences images are generated as Figure 9.
Figure 9. The simulated images in SSM (left) and TRM (right)
To evaluate the performance of the algorithms, the noise was added to the images. The image noise group contains shot noise,
fixed pattern noise, photo response non-uniformity (PRNU), dark current, thermal (kTC) noise, and read noise (Knutson, 2012). Based on the Gaussian distribution assumption, all the electrical noise sources are modelled as Gaussian function. Therefore, the mean and standard deviation measures are considered for each noise source in simulation as shown in Figure 10.
Figure 10. Image noise simulation
After removing the background with polynomial fit method, the noise of the image is estimated (Lévesque, 2007). It is assumed that the noise of the CCD detector has a Gaussian distribution. In order to eliminate the noise, the statistical parameters like standard deviation and mean of the image values are calculated. The test yielded a standard deviation of 3 and a mean value of 2. It is estimated that the remained noise and background in the image are less than 0.5 of the noise level. The results are shown in Figure 11.
Figure 11. The free-background image (left), the noise (middle), the image without noise and background (right)
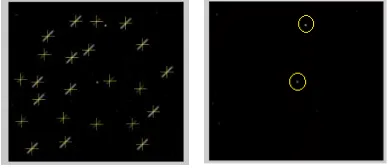
To extract the stars, a double-gate filter is used which is composed of 77 inner window for dim stars and 1313 outer window for bright stars. This filter has a capability to reject the satellite streaks. Also, a matched filter is used to detect the designed streaks. Based on the satellite apparent motion and exposure time, the length (20 pixels) and the orientation (45 degree) of the streak are calculated to design the matched filter. In Figure 12, the detected stars and the image residue are shown.
Figure 12. The detected stars (left) and the remained satellite streak (right)
The centre of the stars is calculated with a binary mask and sub-pixel accuracy and then used for star identification step. After matching of at least four stars from the images with
corresponding celestial coordinates from the Hipparcos catalogue, the image plane is calibrated and pointing coordinates are calculated. The predicted pointing coordinates is obtained about 11.7571 degree (celestial right ascension) and 11.9748 degree (declination). The accuracy of the satellite estimated position after star calibration is better than 5 arc seconds.
One of the important steps in TRM algorithms is streak detection for the group of the stars. To obtain the length and the orientation of star streaks, the Fast Fourier and Radon Transform are applied on the images that acquired in tracking mode. Figure 13 illustrates the typical pattern of applying the transforms on the image. The accuracy of the streak detection depends on the noise level (SNR>2) and the streak length (>20 pixels).
Figure 13. The result of Fast Fourier (left) and Radon Transform (right) on the image
After the streaks of stars are extracted in TRM images, the precise positions of them are calculated in celestial sphere due to star identification algorithms. The final results of star centroiding and the satellite detection in TRM is shown in Figure 14. Because the image coordinates of stars in simulated data are known, the accuracy of the centroiding algorithm of star streaks can be calculated. The overall RMSE for the 23 streak is about 0.2 pixels. The result of star matching is better than 1 arc second.
Figure 14. The result of the satellite detection in TRM
Finally, the precise celestial coordinates is obtained about 11.9201 degree (Ra) and 9.3564 degree (Dec) for the first satellite and 12.8973 degree (Ra) and 12.7827 degree (Dec) for second one. The accuracy of tracking the satellites is obtained around 1-3 arc seconds. It is depends on the noise level and the magnitude of the satellite. The proposed algorithms can detect satellites to magnitude 10 with a total signal to noise ratio of 3.
As the results of this study in searching mode, the predicted coordinates of the Iridium satellite (Ra, Dec) are obtained about 11.76 and 11.97 and in tracking mode, the precise celestial coordinates are computed about 11.92 (Ra) and 9.36 (Dec) and 12.90 (Ra) and 12.78 (Dec) for two fictitious satellites, respectively. Therefore, the precise celestial coordinate of the satellite can be obtained by implementation of a series of detection and tracking algorithms using inexpensive and
reliable ground based optical sensors in the desired accuracy and the appropriate time.
4. CONCLUSION
The design of an optical satellite tracking system was described which is composed of a set of reliable and efficient algorithms to search and track the satellite based on the simulated images. The easier detection, more sensitivity and more reliability of the algorithms can be the advantages of acquiring sequences images. Based on the optical and orbital parameters, the sequences images were simulated for two SSM and TRM modes. The main components of these algorithms are the background estimation and removal, noise removal, star detection and removal, iterative matched filtering, star identification and the astrometry calibration, image filtering and masking, etc. There are many consideration and parameters due to implement the searching and tracking algorithms that can effect on the overall accuracy and the precision of the satellite position like time exposure, noise, local condition of image acquiring, satellite motion, etc. For example, the performance of detection algorithms for the streaks depends on the noise level and the length of the streak. On the other hand, the star points in the image should be erased completely before the matched filter is used to the satellite streak detection.
REFERENCE
Nikolaev, S., et. al., 2011. Analysis of Galaxy 15 Satellite Images from a Small Aperture Telescope. Proc. of Advanced Maui Optical and Space Survillance Technologies Conference, Wailea, Maui, Hawaii, September 13-16, 2011. P.E71.
Lévesque, M. P., 2009. Automatic Reacquisition of Satellite Positions by Detecting Their Expected Streaks in Astronomical Images. In: Advanced Maui Optical and Space Surveillance Technologies Conference (AMOST), Wailea, Maui, Hawaii, September 1-4, 2009, p.E81.
Bruski, S. M., Jones, M. P., Dahlke, S. R., 2012. An Optical Satellite Tracking System for Undergraduate Research. In: The Advanced Maui Optical and Space Surveillance Technologies Conference, Wailea, Maui, Hawaii, September 11-14, 2012.
Lévesque, M. P., 2011. Detection of Artificial Satellites in Images Acquired in Track Rate Mode. Presented to: Advanced Maui Optical and Space Surveillance Technologies Conference, Maui, September 13-16, 2011, p.E66.
Lévesque, M. P., 2010. Image and processing models for satellite detection in images acquired by Space-based Surveillance-of-Space sensors. Defence R&D Canada Valcartier TR 2009-095.
L. M. Simms, et. al., 2011, Optical Payload for the STARE Mission. Proc. of SPIE, Sensors and Systems for Space Applications IV. Vol. 8044, article id. 804406, pp. 13.
Lévesque, M. P., Buteau, S., 2007. Image Processing Technique for Automatic Detection of Satellite Streaks. Defence R&D Canada Valcartier TR 2005-386.
Earl, M. A., 2010. The CASTOR Satellite Survey, 2007 January 1 to 2009 December 31. The Journal of the Royal Astronomical Society of Canada. Vol. 104, No. 4 [743].
Gottlieb, D. M., 1978. Star Identification Techniques In: Spacecraft Attitude Determination and Control, Kluwer: Dordrecht, The Netherlands, Chapter 7.7, pp. 259–266. Kim, J. et. al., 2011. Visibility Analysis of Domestic Satellites on Proposed Ground Sites for Optical Surveillance. Journal of Astronomy and Space Sciences. 28(4), pp. 319-332.
Duke, B. H., 2012. Web Repository for Satellite Detection Purposes Utilising Post-Processing of Variable Source Astronomical Images. The UNSW Canberra at ADFA Journal of Undergraduate Engineering Research, 2012, Vol. 5, No. 1.
Zhang, Z., et. al., 2012. The use of laser ranging to measure space debris, Research in Astronomy and Astrophysics. Vol. 12, No. 2, 2012, pp. 212-218. 24th Annual AIAA/USU Conference, Logan, UT, USA, Aug. 9-12, 2010, SSC10-II-3.
Schildknecht, T., 2007. Optical surveys for space debris. Astron. Astrophys. Rev. 2007, 14, 41–111.
Liou, J. C., Shoots, D., 2007, Orbital Debris Quarterly News. National Aeronautics and Space Administration, A publication of The NASA Orbital Debris Program Office, Lyndon B. Johnson Space Center, Volume 11, Issue 4.
Earl, M. A., 2000. The Space Surveillance Research and Anlysis Laboratory, Journal of the Royal Astronomical Society of Canada, Vol. 94, p.213.
Leilevre, M., Lévesque, M. P., 2007. Evaluation of the Accuracy of the Dark Frame Subtraction Method in CCD Image Processing. Defence R&D Canada Valcartier TR 2007-343.
Ho, k., 2012. A Survey of Algorithms for Star Identification with Low-cost Star Trackers. Acta Astronautica, Vol 73, pp. 156–163, April–May 2012.
Cole, C. L., Crassidus, J. L. 2004. Fast Star Pattern Recognition Using Spherical Triangles. AIAA/AAS Astrodynamics Specialist Conference and Exhibit. Providence, Rhode Island: AIAA
Spratling, B.B., IV; Mortari, D. 2009. A Survey on Star Identification Algorithms. Algorithms 2009, 2, 93-107.
Vincent, A. R., et. al., 2012. Analysis of Stellar Radiance Contamination in Observed Satellite Spectra, Proc. of SPIE, Ground-based and Airborne Instrumentation for Astronomy IV, Vol. 8446, article id. 8446H, 10pp.
Samaan, M., Theil, S., 2011. Development of a low cost star tracker for the SHEFEX mission. German Aerospace Center, Institute of Space Systems, Bremen D-28359, Germany.
Huffman , K. M., 2006. Designing Star Trackers to Meet Micro-satellite Requirements. Dept. of Aeronautics and Astronautics Engineering, Massachusetts Institute of Technology.