AUTOMATIC PROCESSING OF CHINESE GF-1 WIDE FIELD OF VIEW IMAGES
Yongjun Zhang*, Yi Wan, Bo Wang, Yifei Kang, Jinxin Xiong
School of Remote Sensing and Information Engineering, Wuhan University, Wuhan, Hubei, 430079, P.R. China (zhangyj, yi.wan)@whu.edu.cn
KEY WORDS: digital ortho map, GF-1, wide field of view, image matching, geometric distortion correction. ABSTRACT:
The wide field of view (WFV) imaging instrument carried on the Chinese GF-1 satellite includes four cameras. Each camera has 200km swath-width that can acquire earth image at the same time and the observation can be repeated within only 4 days. This enables the applications of remote sensing imagery to advance from non-scheduled land-observation to periodically land-monitoring in the areas that use the images in such resolutions. This paper introduces an automatic data analysing and processing technique for the wide-swath images acquired by GF-1 satellite. Firstly, the images are validated by a self-adaptive Gaussian mixture model based cloud detection method to confirm whether they are qualified and suitable to be involved into the automatic processing workflow. Then the ground control points (GCPs) are quickly and automatically matched from the public geo-information products such as the rectified panchromatic images of Landsat-8. Before the geometric correction, the cloud detection results are also used to eliminate the invalid GCPs distributed in the cloud covered areas, which obviously reduces the ratio of blunders of GCPs. The geometric correction module not only rectifies the rational function models (RFMs), but also provides the self-calibration model and parameters for the non-linear distortion, and it is iteratively processed to detect blunders. The maximum geometric distortion in WFV image decreases from about 10-15 pixels to 1-2 pixels when compensated by self-calibration model. The processing experiments involve hundreds of WFV images of GF-1 satellite acquired from June to September 2013, which covers the whole mainland of China. All the processing work can be finished by one operator within 2 days on a desktop computer made up by a second-generation Intel Core-i7 CPU and a 4-solid-State-Disk array. The digital ortho maps (DOM) are automatically generated with 3 arc second Shuttle Radar Topography Mission (SRTM). The geometric accuracies of the generated DOM are 20m for camera-2 and 3, and 30m accuracy for camera-1 and 4. These products are now widely used in the fields of land and resource investigation, environment protection, and agricultural research.
* Corresponding author. This is useful to know for communication with the appropriate person in cases with more than one author.
1. INTRODUCTION
There are three trends in the development of modern remote sensing technologies. (Li, 2003) The first one is to improve the ground resolution so that users can distinguish more details of the ground covers. The newly launched Worldview-3 satellite which is available to acquire 0.31m panchromatic images reflects this trend. The second one is to improve the spectral resolution so that people can more accurately measure and analyse the chemical composition of land covers. The third one is to shorten the revisit time so that periodically land-monitoring can be achieved. Shorter revisit period can make the remote sensing images very useful in agricultural and environmental monitoring applications.
In order to shorten the revisit time of the widely used pushbroom remote sensing satellite, two methods can be employed. One is to improve the rotation ability of the satellite; the other is to improve the swath width of sensors. Using the former method, users can acquire high ground resolution images at a few important locations. However, the latter method has to be used while acquiring images in short revisit time on large-scale area.
The first satellite of the high resolution land-observation system of China (GF-1 satellite), launched on April 26th, 2013, applied the wide swath width method and thus greatly shortened its revisit time. It carries two imaging system: Panchromatic and Multi-Spectral (PMS) system which is used for common high-resolution observation, and wide field of view (WFV) system which is used for large-scale observation. Figure 1 shows four images that the WFV system observed at the same time. Table 1
lists part of the characteristics of the GF-1 satellite and its imaging systems. As is illustrated in figure 2, the WFV imaging system is made up by four cameras, and each of them has about 16 degrees of viewing angle. The WFV images are most commonly delivered in sensor-corrected (SC) data type, i.e. with square images, RFMs, (Fraser et al., 2006; Zhang et al., 2012) and other metadata. The images of four cameras are delivered separately and they are correspondingly processed separately in this paper.
Figure 1. Four SC images that the WFV imaging system observed at the same time.
section 4, block adjustment experiment using 86 WFV images covering Tibet, China, and generation of DOMs covering the most part of mainland of China are introduced. Section 5 gives the conclusions.
Figure 2. Configuration of WFV imaging system
Items Parameters
Orbit type sun synchronous orbit
Average Orbit height 644.5km
descending node 10:15 am local solar time
Imaging system PMS WFV
Revisit time 41 days, 4 days if
rotation 4 days
Ground resolution of
panchromatic camera 2m at nadir - Ground resolution of
multispectral camera 8m at nadir 16m at nadir
Swath width >60km >800km
Spectral bands (
m)Table 1. Part of the parameters of GF-1 satellite and its imaging systems
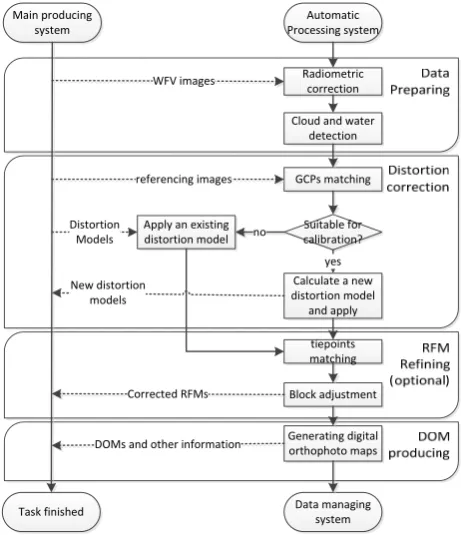
2. WORKFLOW OF AUTOMATIC PROCESSING The processing workflow of WFV SC images is data driven and is called by the main processing system. The main processing system supplies the automatic processing system with WFV SC images, referencing images (most of them are Landsat-8 panchromatic orthophoto maps), and distortion correction models. The whole workflow is illustrated in figure 3 and can be divided into four main steps, i.e. data preparation, geometric distortion correction, RFM refining and DOM generating. 2.1 Data preparation
In the data preparation step, the radiometric correction is optional and for users having special requirement, it can be ignored. Cloud and water detection is used for removing the images that have too much cloud-covered area or water-covered area out of the automatic processing workflow. The removed images can be processed with manual intervention. The detection results (mask images) are also used for eliminating the
mismatched GCPs and tie-points which fall in the cloud or water covered area.
Task finished Data managing system
Figure 3. Workflow of the automatic processing system.
A Gaussian mixture model based method is used for cloud detection. Firstly, the initial model parameters are obtained by the intensity histogram of the grey level image which is composed by the corresponding four bands WFV image. Then the parameters are iteratively adjusted with expectation maximization criterion. When the optimal fitting result is reached, the intensity threshold is automatically obtained. Experiments show that when WFV images are processed on a desktop computer having Intel Core-i7 CPU and solid state disk (SSD), the time of obtaining the threshold and generating the mask image are less than 10 seconds and 30 seconds, respectively.
Figure 4 shows one of the cloud-detection results. Most of the thick clouds are successfully detected. However, the detection of thin clouds is not quite good yet. For geometric correction, this result is enough for mismatch elimination, but for image-fusion, other methods should be utilized. (Panem et al., 2005; Wu et al., 2013; Zhu and Woodcock, 2012)
(a) WFV image (b) cloud detection result Figure 4. An WFV SC image and the result of the Gaussian
2.2 Distortion correction
Through the experiments on a large number of WFV images, we have found that there exist non-linear geometric distortions in the WFV SC images. The distortions in different WFV cameras are slightly different, but they are stable in a relatively short period, for example one month. Thus, a well calculated distortion correction model can be used on the images acquired in similar times by the same camera.
In this step, the matched GCPs are used for calculating the distortion correction models and for refining the RFMs. The distribution of GCPs (the mismatches in the cloud or water covered area are already eliminated by the mask images) have to be evaluated to determine whether the image is suitable for calculating the distortion correction model. For an image that is not suitable for calculating a new model, a calibrated model of the same camera image is used.
If a block adjustment is needed, the distortion correction models are used for correcting the image-space position of the GCPs and tie-points, and the already refined RFMs are used to guide the matching of tie-points. The detailed theory and method of distortion correction will be discussed in section 3.
2.3 RFM Refinement
Although the RFMs are refined by GCPs in the above step, a block adjustment using both GCPs and tie-points is still important to ensure the relative precision of DOMs (Teo et al., 2010; Toutin, 2003; Toutin, 2006; Xiong and Zhang, 2011; Zhang and Zheng, 2012) .
The tie-points are matched with the guidance of GCP-refined RFMs and the constraint of digital elevation model (DEM) in three steps. (Xiong et al., 2012; Xiong and Zhang, 2013) Firstly, the RFM and DEM data are used to compute the approximate topographic relief within the image coverage. Based on the topographic relief, the approximate epipolar lines are constructed and their accuracy is analysed. Secondly, the point matching is executed within the error range of the epipolar line. Finally, the Multi-photo geometrically constrained matching algorithm (Zhang and Gruen, 2006) is adopted to refine the matching result.
After the preparation of GCPs and tie-points, the elevation constrained block adjustment is conducted. The image-space affine transformation is used as adjustable function and after block adjustment, the affine transformation models of all the images are combined into the new RFM parameters.
2.4 DOM Generation
Once the distortion correction models and refined RFMs of the WFV images are prepared, the DOMs can be generated. Parallel processing strategy is used to speed up the computation efficiency of DOM generation.
3. GEOMETRIC DISTORTION CORRECTION 3.1 Error analysis
The geo-referencing errors of pushbroom satellite images are mainly caused by the interior orientation error of the imaging system and the exterior error of the satellite platform.
When RFM is used to transform a point from ground to a pushbroom satellite image, the transforming error (denoted as
x
and y), caused by the exterior orientation error, can be parameterized by the image-space affine transform model. To simplify the using of the affine model, the nominal image-space position xnom and ynom (the position just calculated by the RFM and the ground position) are mostly used as arguments, as is denoted:
The interior orientation error is mainly caused by lens distortion and errors in the focal length, principal point position, and camera assembly angle. (Jiang et al., 2013; Pan et al., 2013; Zhang et al., 2014) The value and direction of interior orientation error are only related to the real position of CCD pixel, i.e. the real position on the image (denoted as xmea and
mea
y ). However, for pushbroom images, y-coordinate represents the number of scanning lines. Thus, only the x-coordinates of the real image position can be used as the argument in interior orientation error model. In fact, the disparity between the real and nominal image position is relatively small (usually several pixels), which means that the interior and exterior orientation error models have very strong correlation. Thus, these two models cannot be solved separately. To solve this problem, the linear part of interior orientation error is usually combined into the exterior orientation error model, and only the nonlinear part (distortion correction model, denoted as Dx and
D
y.) is solved separately.In conclusion, for a ground point, the relationship between its nominal image position and its real image position (measured by image matching) is:
are the random error of image matching.3.2 Distortion correction model
For the users of GF-1 SC image, the detailed structure of GF-1 WFV camera is hidden in the RFMs, so geometric distortion can only be corrected by an empirical model. When ignoring the geometric distortion (
D
x andD
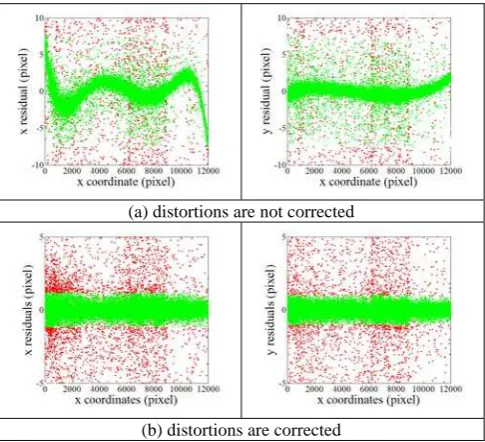
y) in the least squared solving of the affine model (x and y), the distribution of image-space residual errors (
x and
y) on the real image-space x-coordinates of the WFV camera is illustrated in figure 5(a).3.3 Solving strategy
Because of the strong correlation, the distortion correction model and the affine model cannot be solved simultaneously. Furthermore, the fitting of B-spline curves needs uniformly distributed GCPs, and only the images satisfying this condition can be used to calculate their distortion model parameters. To judge whether an image is suitable for calculation, its GCPs are divided into several groups (12 groups for WFV image) based on their image-space x-coordinates (see figure 6). If the number of GCPs in each group is larger than a certain threshold (>20 for WFV image), the image is treated as suitable for calibration.
(a) distortions are not corrected
(b) distortions are corrected
Figure 5. The distribution of the image-space residuals against x-coordinates. The red dots represent the GCPs that are
eliminated as outliers, while the green dots are inliers.
Figure 6. The GCPs are divided into several groups based on the x-coordinates. A white dot represents a GCP.
For the images suitable for calculation, their affine model (x
and y) are firstly solved by ignoring their distortion. Then, with the already solved affine model, the distortion correction model is solved by the robust least squares method with the loss function:
s log 1
s
(3)where
s
is the value of cost function.For the images not suitable for calculation, their distortion models should be searched from the data management system. The searched model should be calculated using the image acquired by the same camera, and their shooting time intervals should be less than a month. Then, the searched models are used to correct the image-space position of GCPs. Finally, the corrected GCPs are used to solve the affine models. A RANSAC based method is used to eliminate outliers.
4. EXPERIMENTS AND DISCUSSIONS 4.1 Block adjustment experiment
This test is to compare the relative precision of DOMs which are generated in two different conditions: (1) the distortion correction models is not used, but the RFMs are block adjusted, (2) the distortion correction model is used and the RFMs are block adjusted.
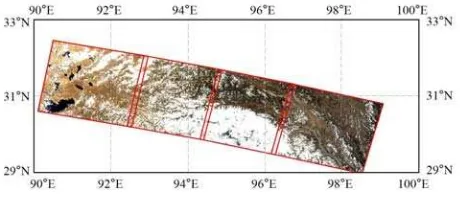
In this experiment, 86 GF-1 WFV images covering Tibet, China are involved in. All the images were acquired between June, 2013 and September, 2013. The distribution of their DOMs is shown in figure 7. The SRTM data with 90m grid size is used as elevation constraint. The image positions of tie-points are corrected before the block adjustment.
Figure 7. The DOMs of the involved 86 GF-1 WFV images
In condition (2), the image positions of the tie-points are corrected with the distortion correction models, while in condition (1) they are not corrected. The root of mean squared error (RMSE) of the image residuals and the elevation residuals (the tie-points are constrained in elevation) in the block adjustment are listed in table 2. The statistic information shows that the RMSE of image-space residuals and elevation is remarkably reduced if the image-space coordinates are corrected by the distortion correction models.
Items Condition (1) Condition (2)
Tie-point number 123977 123977
Detected outliers 266 213
RMSE
Sample (pixel) 1.02 0.35
Line (pixel) 0.50 0.46
Elevation (meter) 77.35 22.61
MAX
Sample (pixel) 6.69 3.78
Line (pixel) 4.31 4.25
Elevation (meter) 525.02 164.69
Table 2. Statistic information of the block adjustment results of condition (1) and condition (2).
(from the tie-points list) of the image-pair; secondly, compute the two ground positions with the two RFMs and the SRTM DEM; finally, the mean value and RMSE of the differences in ground positions are calculated. Totally 358 image-pairs are evaluated in this test area. The histograms of the mean value and RMSE of the ground position differences of the image-pairs are illustrated in figure 8. The mean value reflects the overall relative precision of an image-pair. The RMSE reflects the relative precision in parts of the overlapping area and is influenced by the elevation accuracy of SRTM data and the viewing angle of the image-pair.
Figure 8. The histograms of the mean value and RMSE of the ground position difference of the corresponding points in all the
image-pairs. The relative precision of the whole test area in condition 2 is obviously better than that in condition 1, whether
judged by the mean value of by the RMSE.
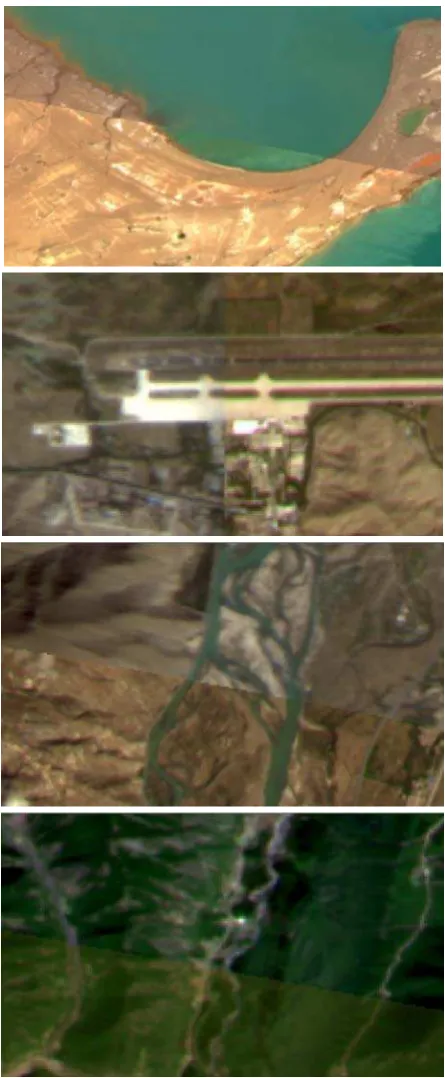
The results show that the geometric distortion in the GF-1 WFV images strongly influences the relative precision of the DOM products. However, after the correction of geometric distortion, the relative precision is significantly improved, i.e. the means of the ground position differences of over 99% image-pairs are less than one ground sample distance of WFV image (16m). The RMSE is also improved when the geometric distortion is corrected. Several screenshots of the generated DOMs are shown in figure 9. The screenshots show that the mosaicking errors in these areas are less than 2 pixels. It is also revealed by the RMSE in figure 8, that most RMSE of image-pairs are less than 2 GSDs (32m).
Figure 9. Screenshots of Tibet DOMs under condition 2.
4.2 Producing DOMs covering mainland of China
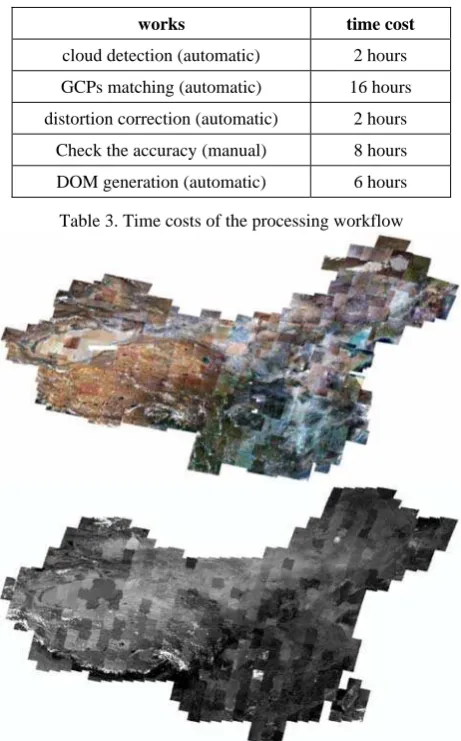
works time cost cloud detection (automatic) 2 hours
GCPs matching (automatic) 16 hours
distortion correction (automatic) 2 hours
Check the accuracy (manual) 8 hours
DOM generation (automatic) 6 hours
Table 3. Time costs of the processing workflow
Figure 10. The ortho-rectified GF-1 WFV images (above) and the referencing Landsat-8 images (below).
The accuracy check took our operator about 8 hours and this work can only be processed manually. The DOM generation is executed after the accuracy check to avoid doing this time-costing work again. The land-covers of the WFV images and the referencing Landsat-8 images are illustrated in figure 10.
5. CONCLUSION
Having four days revisit time, the GF-1 WFV imaging system enables people to quickly obtain remote sensing images in a large scale. This property enables people to make periodically land-monitoring in many fields, such as crop condition monitoring and management, air pollution monitoring, and land-cover monitoring. However, the improved ability of data-acquisition also promotes the requirements of the degree of automation in data processing. The automatic workflow described in this paper gives a feasible solution that can be universally used in the production of DOM over national wide scale.
REFERENCES
Fraser, C., G. Dial, and J. Grodecki, 2006. Sensor orientation via RPCs. ISPRS Journal of Photogrammetry and Remote Sensing, 60(3):182-194.
Jiang, Y., G. Zhang, X. Tang, X. Zhu, Q. Qin, D. Li, and X. Fu, 2013. High accuracy geometric calibration of ZY-3 three-line image. Acta Geodaetica et Cartographica Sinica, 42(4), pp.523-529.
Li, D., 2003. Towards the development of remote sensing and GIS in the 21st century. Geomatics and Information Science of Wuhan University, 28(2), pp.127-131.
Pan, H., G. Zhang, X. Tang, et al., 2013. The geometrical model of sensor corrected products for ZY-3 satellite. Acta Geod. Cartogr. Sin, 42(4), pp.516-522.
Panem, C., S. Baillarin, C. Latry, et al., Automatic cloud detection on high resolution images. IEEE International Geoscience and Remote Sensing Symposium, Seoul, Korea, 25– 29 July, 2005.
Teo, T. A., L. C. Chen, C. L. Liu, et al, 2010. DEM-aided block adjustment for satellite images with weak convergence geometry. IEEE Transactions on Geoscience and Remote Sensing, 48(4), pp.1907-1918.
Toutin, T., 2003. Block bundle adjustment of Landsat 7 ETM+ images over mountainous areas. Photogrammetric Engineering & Remote Sensing, 69(12), pp.1341-1349.
Toutin, T., 2006. Spatiotriangulation with multisensor HR stereo-images. IEEE Transactions on Geoscience and Remote Sensing, 44(2), pp.456-462.
Wu, X., W. Yang, and G. Li, Thin cloud removal of ZY-3 image based on improved homomorphism filtering method. 21st International Conference on Geoinformatics, Kaifeng, China , June 20-22, 2013.
Xiong, J., Y. Zhang, M. Zheng, and Y. Ye, 2013. An SRTM assisted image matching algorithm for long-strip satellite imagery. Journal of Remote Sensing, 17(5), pp.1103-1117.
Xiong, Z., and Y. Zhang, 2011. Bundle adjustment with rational polynomial camera models based on generic method, IEEE Transactions on Geoscience and Remote Sensing, 49(1), pp.190-202.
Xiong, J., and Y. Zhang, 2012. Combined multi-view matching algorithm with long-strips of satellite imagery from different orbits. ISPRS Annals of Photogrammetry, Remote Sensing and Spatial Information Sciences, 1, pp.87-92.
Zhang, L., and A. Gruen, 2006. Multi-image matching for dsm generation from ikonos imagery. ISPRS Journal of Photogrammetry and Remote Sensing, 60(3), pp.195-211.
Zhang, Y., Y. Lu, L. Wang, and X. Huang, 2012. A new approach on optimization of the rational function model of high-resolution satellite imagery. IEEE Transactions on Geoscience and Remote Sensing, 50(7), pp.2758-2764.
Zhang, Y., and M. Zheng, 2012. Bundle block adjustment with self-calibration of long orbit CBERS-02B imagery, ISPRS-International Archives of the Photogrammetry, Remote Sensing and Spatial Information Sciences, 1, pp.291-296.
Zhang, Y., M. Zheng, J. Xiong, Y. Lu, and X. Xiong, 2014. On-orbit geometric calibration of ZY-3 three-line array imagery with multistrip data sets. IEEE Transactions on Geoscience and Remote Sensing, 52(1), pp.224-234.