AUTOMATED SYSTEM FOR GENERATION OF SOIL MOISTURE PRODUCTS FOR
AGRICULTURAL DROUGHT ASSESSMENT
S.S. Raja Shekhar*, K. Chandrasekar, M. V. R. Sesha Sai, P. G. Diwakar, V.K. Dadhwal
National Remote Sensing Centre, Indian Space Research Organisation, Hyderabad 500037, India -
( ssraj, chandrasekar_k, seshasai_mvr, diwakar_pg, director ) @nrsc.gov.in
KEY WORDS: Automation, Software, Processing, Agriculture, Application, Disaster, Soil, Hydrology
ABSTRACT:
Drought is a frequently occurring disaster affecting lives of millions of people across the world every year. Several parameters, indices and models are being used globally to forecast / early warning of drought and monitoring drought for its prevalence, persistence and severity. Since drought is a complex phenomenon, large number of parameter/index need to be evaluated to sufficiently address the problem. It is a challenge to generate input parameters from different sources like space based data, ground data and collateral data in short intervals of time, where there may be limitation in terms of processing power, availability of domain expertise, specialized models & tools. In this study, effort has been made to automate the derivation of one of the important parameter in the drought studies viz Soil Moisture. Soil water balance bucket model is in vogue to arrive at soil moisture products, which is widely popular for its sensitivity to soil conditions and rainfall parameters. This model has been encoded into "Fish-Bone" architecture using COM technologies and Open Source libraries for best possible automation to fulfill the needs for a standard procedure of preparing input parameters and processing routines. The main aim of the system is to provide operational environment for generation of soil moisture products by facilitating users to concentrate on further enhancements and implementation of these parameters in related areas of research, without re-discovering the established models. Emphasis of the architecture is mainly based on available open source libraries for GIS and Raster IO operations for different file formats to ensure that the products can be widely distributed without the burden of any commercial dependencies. Further the system is automated to the extent of user free operations if required with inbuilt chain processing for every day generation of products at specified intervals. Operational software has inbuilt capabilities to automatically download requisite input parameters like rainfall, Potential Evapotranspiration (PET) from respective servers. It can import file formats like .grd, .hdf, .img, generic binary etc, perform geometric correction and re-project the files to native projection system. The software takes into account the weather, crop and soil parameters to run the designed soil water balance model. The software also has additional features like time compositing of outputs to generate weekly, fortnightly profiles for further analysis. Other tools to generate “Area Favorable for Crop Sowing” using the daily soil moisture with highly customizable parameters interface has been provided. A whole India analysis would now take a mere 20 seconds for generation of soil moisture products which would normally take one hour per day using commercial software.
1. INTRODUCTION 1.1 Drought Assessment and Monitoring
A drought is defined as "a period of abnormally dry weather sufficiently prolonged for the lack of water to cause serious hydrologic imbalance in the affected area." -Glossary of Meteorology (1959). In easier to understand terms, a drought is a period of unusually persistent dry weather that persists long enough to cause serious problems such as crop damage and/or water supply shortages. The severity of the drought depends upon the degree of moisture deficiency, the duration, and the size of the affected area. Drought is a serious creeping disaster affecting entire world and numerous works and research are still a shortfall to capture, understand and forecast with satisfactory degree.
Over the years efforts have been made to understand agricultural drought right from early part of crop season to the seeding and growing stage till harvesting or yield. Popular methods involve the analysis based on rainfall, vegetation and temperature data from different land observation and space based inputs like NDVI, NDWI etc. Estimation of drought conditions like Normal, Mild, Moderate and Severe are used to represent the situation in regions of Assessment and Monitoring. These are based on vegetation parameter based indices, Moisture or hydrological based indices or a combination of these along with other
parameters directly or indirectly effecting the assessments. Sources for collection of these parameters are both based on observations from land and space based inputs. Due to synoptic view and repetivity, Remote Sensing based indices gained significant importance with most prominent vegetation index is certainly the Normalized Difference Vegetation Index(NDVI; Tucker, 1979) that was first applied to drought monitoring by Tucker and Choudhury (1987). Later several derivates for drought monitoring such as the Vegetation Condition Index(VCI; Kogan, 1990, 1995), the anomaly of the NDVI called NDVIA (Anyamba et al., 2001), Standardized Vegetation Index SVI (Peters et al., 2002) have been used. Most prominent of all is the Palmer Drought Severity Index (PDSI ) which has added more sensitivity for moisture or available water content.
In India drought assessment and monitoring is mainly carried out by multi-discipline approach using Remote Sensing data both from optical and microwave domains, Meteorological data from global weather service providers along with vast automatic weather information networks from meteorological and oceanographic satellite data archival centre (MOSDAC ) and Indian Meteorological Department (IMD). National Agricultural Drought Assessment and Monitoring System ( NADAMS ) is a holistic approach that is operational carried out for this purpose, from more than two decades.
With increasing geographical area and involvement of multiparameter approach the processing the available data, modelling and preparation of inputs for interpretation, assessment and monitoring is a challenge. Large processing systems call for high end infrastructure, software, skills and involve high learning curve. Technological solutions to meet these requirements suggest a divide and conquer approach. Software architecture and designs like component model, rapid application development model, integrated designs etc allow a large framework to be subdivided into smaller modules which interact with each other through hand shaking at process levels for achieving the processing goals.
1.2 Soil Moisture estimation methods
Water or moisture availability is the central driving factor for all manifestations of drought like Meteorological drought, Hydrological drought and Agricultural drought. Understanding the availability of moisture in a given area and its estimation and monitoring become the foremost factors for modelling and understanding the phenomena. Collecting field information about the soil moisture is one of the tedious processes and is limited to point based approach that is sparse and with significant costs for each iteration. Space based information of soil moisture has its unique advantage of synoptic view covering larger areas and receptivity with less human interactions and cost. However, availability of soil moisture at required resolutions is still limited with coarse resolution information from AMSRE, SMOS etc. This needs a significant improvement for ground implementation with ground based information and modelling.
Water balance is based on the law of conservation of mass that states “any change in the water content of a given soil volume during a specified period must equal the difference between the amount of water added to the soil volume and the amount of water withdrawn from it”. Conservation principle balances the incoming and outgoing moisture content with a book ping approach.
A water balance model can be considered as a system of equations designed to represent some aspects of the hydrological cycle. These models can be constructed with varying levels of complexity right from simple “bucket” model representing most important process effecting the estimation of soil moisture and complex processes involving the feedbacks from interrelated dynamic interactions like vegetation type, atmosphere, energy balance etc. A simple bucket model may be suitable for many purposes as a first hand indicator of moisture, as compared to more complex models for a high degree of interpretation like crop growth for specific cases based on crop type and impact on yield etc. It is important to recognise that increasing model complexity does not necessarily improve accuracy (Walker and Zhang 2001).
Models of varying complexities like Variable Infiltration Capacity (VIC), Decision Support System for Agrotechnology Transfer (DSSAT), Climatic Water Budget (CWB) models etc are commonly used for simulating soil moisture. Present automation work is developed around bucket model and being improvised for varying Indian climatic conditions. (Chandrasekar& M. V. R. SeshaSai, 2014 )
1.3 Software Architectures and Challenges
Spatial modelling involves processing of geospatial data and related attributes at different scales. The goal for any geospatial software in specific domain involves objectives, criteria and simulations that can be modelled to provide inputs for a decision making process. With the advent of open source software in geospatial domain, the ability to integrate hardware, software and data seamlessly together with processing, analyzing and displaying has remarkably changed the dependency on commercially of the shelf software ( COTS ).
Free and Open Source Software serves the collective interest of the global community to share and develop interoperable platforms enabling faster development and implementation of Remote Sensing and GIS applications domains. Reusability is the key driving factor served through these components and libraries. Core libraries vastly used towards raster and vector based operations are Geospatial Data Abstraction Library (GDAL) and OGR. GDAL provide a generalized application programming interface (API) for raster data and OGR does the same for vector data. GDAL can be used to read, manipulate and write most of the commercial and scientific raster formats. Some of the available open source remote sensing software includes GRASS, QGIS, Open Source Software Image Map (OSSIM) and Orfeo Toolbox (OTB) (Camps-Valls et al.,2011). OSSIM in particular is a high performance engine for remote sensing, image processing, geographical information systems and photogrammetry (Kala and Silori, 2013). Christophe and Inglada (2009) mentioned that OSSIM software has the best established libraries to work with remote sensing data. The OSSIM image processing software provides tools for registering the satellite images (Bunting et al., 2013; OTB-exploratory analysis and development of software features, and components along with open source geospatial technologies supporting high end processing tasks.
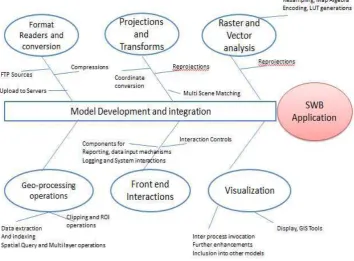
Process models involve complexities at different stages of data ingest, synchronous and asynchronous integration mechanisms, requirement of additional information at parametrisation and initiation of model at different levels. Thus software development for such systems call for integrated approach from different domain solutions that fall into the domain of fish bone problem solving methods. A fishbone diagram, also called a cause and effect diagram or Ishikawa diagram, is a tool for categorizing the potential causes of a problem in order to identify its root causes. The same can be extended into different disciplines to understand the interactions of the inter related process or functionality to arrive at an integrated best solution.
The problem in geospatial domain is that there is no single software solution for all the modelling and processing requirements. A combination of libraries, functionality, visualisation tools etc is invoked to solve problem of a given domain. In this paper, implementation of fish bone architecture to implement the Soil Water Balance model in a software solution is discussed.
2. METHODOLOGY
2.1 Model development and data flow
SWB model as described is a bucket model with book keeping approach. Based on law of conservation initial moisture ( previous day ) in a given area forms the seed and moisture sources and sinks in the form of rainfall and evaporation / evapotranspiration respectively are assimilated into the system for arriving at present day moisture content.
The basic assumptions and the inaccuracies resulting from the failure of the assumptions of the model are i) the first is that the rain water instantaneous and uniform redistributes to entire root zone. This assumption may fail under low rainfall scenario and dry soil profile conditions since in reality the less amount of rainfall may not fully infiltrate the entire depth of dry soil considered. ii) The second assumption is the uniform abstraction from soil through the entire root zone. It may overestimate the ET abstraction, as majority of the roots are present in the top 50% of the root zone considered. iii) The third assumption is runoff, deep percolation and evapotranspiration are sinks. The uncertainties with this assumption is that, in reality the runoff could have contributed to the water influx of adjacent pixel. With respect to deep percolation when the soil depth is confined by an impervious layer, deep percolation could contribute to the water influx of adjacent pixel, iv) the forth assumption is interception losses are not considered. The interception losses is not considered separately because the initial abstraction component of the SCS curve number equation includes surface storage, interception and infiltration prior to runoff. v) The fifth assumption is that agriculture land is prepared and ready for sowing before the start of the season. This
assumption is made in order to choose the appropriate curve number and vi) Only the un-irrigated rain-fed agricultural area is considered because the model does not take irrigation input and the results are applicable only to the rain-fed agricultural areas.
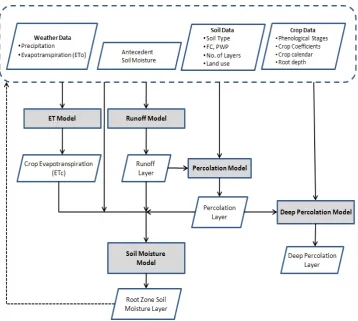
Figure 1 presents the overview of the soil water balance model. The soil root zone was divided into two layers. Top layer is the active root zone while the bottom layer is the passive root zone. The root zone depth for the cotton and the millet crop were adopted from Food and Agriculture Organization (FAO) Irrigation and Drainage Paper No: 56 for all four stages of the crop. The soil water balance in the active root zone layer is governed by daily values of rainfall, evapotranspiration (ET) and drainage to the second layer. When the upper layer saturates in excess of Field Capacity (FC) due to rainfall, the excess water percolates to the lower passive root zone and are instantaneously redistributed in that zone. Excess soil water that moves out of the passive root zone is lumped as runoff and deep percolation losses. As the upper layer is exposed to the atmosphere and subjected to upward flux due to the direct solar radiation, the lower limit of soil water in the active root zone is the residual water content of the soil. The components of the generic hydrological model include rainfall, irrigation, runoff, infiltration, evapotranspiration, percolation and deep percolation and each of the components is described here under( Chandrasekar K et al, 2014).
Figure 1. Methodology and data flow
2.2 Software integration and design
Model implementation calls for large software development efforts if started from scratch. This leads to development of multiple libraries with specialised skill sets in geospatial domain, software development, architecture design, high input costs and time. The problem is best analysed in fish bone architecture to arrive at a better and faster solution as shown in fig 2. The common use of fish bone diagram is to build an effective product design. Here fish bone diagram is
used to simulate the geospatial software development problem. The “causes” are the functionalities required for geospatial information extraction( Misra et al, Inca 2010) . Further ERD approach is implemented to develop each of the modules to arrive at multiple versions in succession along with improvements in a short time.
Figure 2. Fish bone Architecture Solution
Data ingest from multiple sources involve file formats reading and writing like TIF, HDR, ZIP, CSV, SHP, etc. Geospatial libraries GDAL and OGR, available in open source with C++ base development and API interfaces form a perfect base. Operations involving projection and transformation are essential parts of the process to match data from different coordinate systems and resolutions. Proj4 library supports these and is available as an integral part of GDAL collections. Large volumes of data processing involve use of parallel processing support where ever available. GDAL is compiled with basic options of supporting multi-processor environment with usage of switching environments.
C++ interfaces can best be implemented in native matching environments like VC++ based MFC libraries. All the components for developing rich front end interfaces are available to customise the model building and running routines. SWB model is coded in VC++ with geospatial analysis from GDAL and OGR as integrated models for each of the data flow shown in fig 1.
For visualisation of geospatial data and further analysis, readily available free and open source utilities from QGIS environments are used. Further supporting libraries for system calls and reporting features are integrated into the system as per requirement.
Automation of the system is done at module level using MFC libraries.. Data is organised in structured stores with date time stamps for standardisation. All the interim data for assimilation requirements is pre-fetched in an automated way from FTP servers where ever applicable for the user selected date ranges. System is facilitated to configure for unattended operations with windows service agents that can facilitate the echo of output data to main server for visualisation over the web. BHUVAN portal ( ISRO’s Geo-portal ) server is configured presently for this service.
At second level of ERD, an extension module of the SWB software facilitates generation of Area favourable for Crop Sowing ( AFCS ) based on soil moisture, type, agriculture regions and crop types. Reporting mechanism supports both desktop and web interfaces with CSV and HTML reports. The software is amenable to integrate with web interfaces as the base development is on GDAL and OGR which are also the fundamental mechanism for GIS server based technologies like MAPSERVER and GEOSERVER, The outputs can be pre-compiled as WMS services and integrated to the hosting servers for a wider reach.
3. RESULTS AND ANALYSIS
3.1 Software Interface
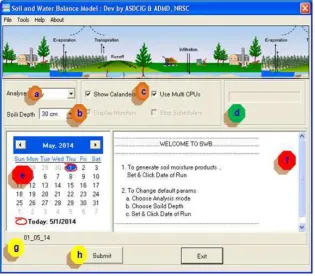
SWB Version 1.0 of the software is highly optimised and designed for high level of automation to reduce any logical errors from user interactions. The interface is as shown in figure 3. For entire country processing takes just 15 seconds on a two processing / 8 GB machine. All the instructions / messages are dynamically shown during the model run. Input parameters and optimised operations relevant for the model
are intelligently chosen by the software, thereby minimising the interaction time and scope for any user induced errors.
Software can schedule internal jobs on multi CPU / core environments and thus is highly efficient for running for multi temporal data analysis. User can run the application for a single date or a range of dates as required.
Figure 3. SWB Software Interface
a) Analysis Mode : User can choose daily, weekly, monthly, till end of month from the present day for data analysis. Default mode is for the present day selected in the calendar.
b) Soil Depth : Application is configured for running with variable soil depth regions. Default is 30 cm. User can choose 5 cm or 15 cm as per processing requirement. The parameter is applied for entire processing region.
c) Utilities : Show calendar and Use Multi CPU/ Core is check boxes are default applied for the running environment to automatically optimise the performance. In this version these are defaults and choice is mandatorily applied by the system.
d) Progress bar : Indicates the status of the process
e) Calendar : Enables user to choose the date for which analysis has to be done and soil moisture products to be prepared. For modes involving multiple dates i.e weekly, monthly etc. numbers of days from the selected date is chosen as the criteria for preparing temporal products.
f) Status register : Entire process states including the functionality running, success, failures if any are shown
step by step to the user. Most of the information required for user analysis and system functioning is displayed here.
g) Date of processing: User selected date taken for reference for the process.
h) Submit: Submit button initiates the process for generation of products.
3.2 Outputs generated
Figure 4 shows the output of the soil moisture i from the software on the left and the correspon USDA soil moisture published every ten days Explorer website (www.pecad.fas.usda.gov/c
Two sample date were chosen on 10th of July September, 2014 randomly for comparison wit output. It can be observed that the spatial patter of soil moisture saturation and deficiency are m closely. The spatial pattern match between th moisture has been found consistent throughout th
The district average soil moisture derived fro software was compared with the district average derived from Variable Infiltration Capacity (VIC sample was taken at every 10 days interval fr 2014 to 30th October, 2014 which give a go distribution. Districts were choose across the Uttar Pradesh in north to Tamil Nadu in the across various soil types. Figure 5 shows the value from SWB software compared with the derived soil moisture.
It can be observed that the soil moisture of S closely followed the soil moisture of VIC model soil districts. In loamy and other soils districts moisture underestimates the VIC model so Though there is underestimation the trend of the matches with VIC model soil moisture. This m model software shows spatial cohere USDA soil moisture model. The soil comparable in the clayey soil regions wh in the loamy and other soil regions.
ACKNOWLEDGEME This work was performed under assessment and monitoring division of I Organisation (ISRO) at NRSC, Hydera indebted to Dr. V.K. Dadhwal, Direct Sensing Centre for his encouragement a whom this endeavour would not ha gratitude is due to Dr. P.G. Diwakar, De NRSC who gave unstinted coope endeavour. The Authors thank project Agriculture, Soils and Land Use di The International Archives of the Photogrammetry, Remote Sensing and Spatial Information Sciences, Volume XL-8, 2014
REFERENCES
Camps-Valls, G., Tuia, D., Gómez-Chova, L., Jiménez, S., &Malo, J., (Eds.) (2011). "Remote sensing image processing," in Collection “Synthesis Lectures Image, Video, Multimedia Processing. LA Porte, CO, USA: Morgan & Claypool.
Kala, C. P.,& Silori, C. S. (Eds.) (2013). Biodiversity, Communities and Climate Change. TERI Press.
Sami OUALI, Naoufel KRAIEM, Henda BEN GHEZALA, 2011. Framework for Evolving Software Product Line.International Journal of Software Engineering & Applications (IJSEA), Vol.2, No.2, April 2011.
Niemeyer S. N ewdrough t i n di ces. In :López-Fran cos A. (ed.). Drought management: scientific andtechnological innovations. Zaragoza : CIHEAM, 2 008. p. 2 67 -2 7 4
(Option s Méditerranéen n es
:SérieA.SéminairesMéditerranéen s; n . 80)
Klein S,. Staring M,. Murphy K,.Viergever MA,.&Pluim, J. (2010).elastix: A Toolbox for Intensity-Based Medical Image Registration. IEEE Transactions on Medical Imaging. 29 (1), 196-205. doi: 10.1109/TMI.2009.2035616.
Steiniger, S., &Bocher.E. (2008).An Overview on Current Free and Open Source Desktop GIS Developments.International Journal of Geographical Information Science. 23 (10), 1345-1370. doi:10.1080/1365881080802634956
N. Romano, M. Palladino, and G. B. Chirico,2011.Parameterization of a bucket model for soil-vegetation-atmosphere modeling under seasonal climatic regimes, Hydrol. Earth Syst. Sci., 15, 3877–3893.
Misra, Indranil.,Moorthi,S.Manthira., Darji, Nikunj. P., &Ramakrishnan, R. (2010). Open Source software solution for land and crop studies by Geospatial Analysis of Remote Sensing Data. XXX INCA International Congress Dehradun, India. 10-12 November, 2010.
Moorthi, S.Manthira., Misra, Indranil., Ramakrishnan, R., &Srivastava, P.K. (2011).Discovery of software systems for composition and their customizability in free and open source geospatial software environments – A Case Study. Map World Forum 2011, Hyderabad, India.
Qiaozhen Mu, Maosheng Zhao, John S. Kimball, Nathan G. McDowell, and Steven W. Running. 2013. A Remotely Sensed Global Terrestrial Drought Severity Index. DOI:10.1175/BAMS-D-11-00213.1
Wu, M.W., Lin, Y. D "Open Source Development: An Overview," IEEE Computer, 2001, pp. 33-38
Scacchi, W. "Understanding the Requirements for Developing Open Source Software Systems," IEE Proceedings - Software, 2002
Jolma, A., Ames, D.P., Horning, N., Mitasova, H., Neteler, M., Racicot, A., &Sutton, T. (2008). Free and open source geospatial tools for environmental modelling and management. In: Jakeman, A.J., Voinov, A.A., Rizzoli, A.E.,
Serena, H.C. (Eds.), Environmental Modelling, Software and Decision Support. Elsevier, Amsterdam.