DISCUSS ON SATELLITE-BASED PARTICULATE MATTER MONITORING
TECHNIQUE
Bicen Li a, *, Lizhou Hou b
a Beijing Institute of Space Mechanics and Electricity (BISME), Beijing, China - [email protected] b
Beijing Institute of Space Mechanics and Electricity (BISME), Beijing, China - [email protected]
KEY WORDS: Fog and haze, PM2.5 concentration, Aerosol optical depth, Satellite remote sensing, Multi-angle polarimetric
imager
ABSTRACT:
Satellite measurements for atmospheric pollutants monitoring provide full mapping, large spatial coverage, and high spatial resolution. Retrieved aerosol optical depth (AOD) from satellite data as the key parameter has been used in the study on particulate matter (PM) distributions which is complementary to ground-based measurements. Based on the empirical relations between aerosol optical properties and PM10 or PM2.5 concentration and its influencing factors, combining the Beijing-Tianjin-Hebei regional PM distribution feature, the specifications including bands, viewing angles and polarization measuring requirements of the on-orbit PM monitoring instrument are discussed. The instrument is designed to obtain the data for retrieving atmospheric AOD, shape and size of particles, refractive index, aerosol single scattering albedo (SSA), etc. The major pollutant PM2.5 concentration can be retrieved from the remote sensing data especially, and its global distribution can be mapped as well. The progress of conventional aerosol retrieval method using visible data is presented along with its limitation for serious haze-fog condition. Adding ultra violet (UV) bands to obtain UV aerosol index (UVAI) is useful for monitoring the main constituents of haze.
1. INTRODUCTION
With the rapid growth of China's economy, the problem of air quality is more and more serious. Because of the national energy structure adjustment and the increasing motor vehicle emissions, the current pollutions characteristics of ambient air quality have transformed to mixed pollutant from smoke pollutant. The dust haze pollution which mainly consists of atmospheric fine particulate matter happens frequently in the relevant developed areas such as Beijing-Tianjin-Hebei, Yangtze River Delta and Pearl River Delta (He, et al., 2002), which causes widespread public concern. Atmospheric fine particulate matter PM2.5 (the particulate matter whose aerodynamic equivalent diameter is less than or equal to 2.5 micron) which is the critical factor generating the pollution characteristics will reduce air visibility and affect health of human respiratory system and cardiovascular system. In recent years, research on PM monitoring have been developed rapidly along with the improving public attention to the air pollution.
The monitoring methods include satellite measurements and ground-based measurements. The time resolution and accuracy of ground based measurements are better but the effective observation range is limited by the fixed location of the instruments. Polar orbit satellite can obtain data of aerosol optical properties over very large spatial scale. Due to full mapping, large spatial coverage, and high spatial resolution, retrieved AOD from satellite data has been applied in the study on PM distributions. Although they are less precise than ground observations, satellite measurements can be very useful to improve the understanding of regional PM distributions and thus be complementary to ground-based measurements. Empirical relations between aerosol optical properties and PM10 or PM2.5 measurements have been studied for different parts of the world (Kacenelenbogen, et al., 2002; Hutchison, 2003; Wang and Christopher, 2003; Zhang and Li, 2013; Zhao,
et al., 2013). The capacity for monitoring and estimating fine particulates near the surface by satellite remote sensing will be improved based on these empirical results.
In this study, we discuss the specifications including bands, viewing angles and polarization measurement requirements of the on-orbit PM monitoring instrument based on the empirical relations between aerosol optical properties and PM concentration and the PM distribution features in Beijing-Tianjin-Hebei area. And some advices on development of the remote sensing instrument for fine PM monitoring are present.
2. REGIONAL FEATURES OF PM POLLUTION IN BEIJING-TIANJIN-HEBEI AREA
For a long time, pollution data formally released by China Ministry of Environment until 1st January 2013 were about PM10, and research on the relationship between pollutant and meteorological conditions mostly focused on PM10 (Wang and Li, 2003; Sui, et al., 2007). According to ambient air quality standard GB2095-2012 promulgated by Ministry of Environment in 2012, PM2.5 has been brought into the scope of general air quality monitoring and evaluation system along with O3 and CO. Thus six kinds of pollutants including PM10, PM2.5, O3, CO, SO2 and NO2 are monitored and evaluated comprehensively according to the standard. During January and February 2013, there were 51 days that PM2.5 was the critical pollutant in Beijing according to the statistical results based on the measurements of environment departments. PM2.5 is becoming the focus of public concern.
particulate matters in summer spread from the surrounding provinces and cities near Beijing (Streets, et al., 2007). By using PM2.5 concentration and aerosol scattering coefficient measured in urban and rural environment in Beijing area in autumn 2011, PM2.5 pollution and aerosol optical properties in fog-haze days are discussed (Zhao, et al., 2013).
As a new method to study atmospheric aerosol and particulate matter, satellite remote sensing can obtain pollution distributions of large scale and so provide more information to improve the insight in regional PM distributions. Global satellite-derived PM2.5 averaged over 2001-2006 is mapped by using Terra and Aqua data of NASA which is present in Figure 1 (van Donkelaar, et al., 2010). This figure show that PM2.5
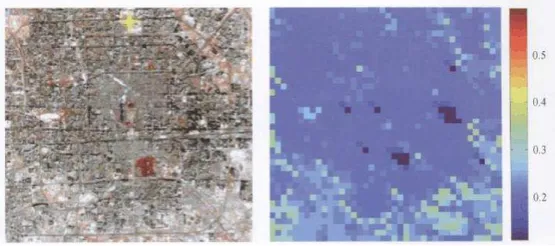
concentrations is much higher in the regions including north Africa, west Asia and east Asia, especially over eastern China which exist long-term serious PM2.5 pollution. The fog and haze pollution situation in Beijing region are analyzed base on the AOD retrieved from data in 14th and 17th January 2013 obtained by HJ-1A and HJ-1B satellites (Figure 2). Figure 2(a) shows the heavy polluted weather in this fog-haze period that the air quality index (AQI) in 14th January was 331 which was measured at Olympic Sports Centre (OSC) observation station. Figure 2(b) shows the clean weather after fog-haze disappeared that the AQI in 17th January was 99 which also was measured at OSC station (Xu, et al., 2013). These retrieved AOD maps show many spatial distribution details of the fog and haze.
Figure 1. Global satellite-derived PM2.5 concentration
(a) The color composite image (left) and retrieved AOD map in 14th Jan 2013 in Beijing region
(b) The color composite image (left) and retrieved AOD map in 17th Jan 2013 in Beijing region
The measurements of PM concentration and distribution near the surface by satellite will be more and more important for the fog-haze monitoring and treatments. Meanwhile, the study on correlation between AOD and PM2.5 concentration near surface is theoretical basis of applying satellite remote sensing to PM monitoring more effectively.
3. CORRELATION BETWEEN AEROSOL OPTICAL PROPERTIES AND PM CONCENTRATION
Haze is a kind of air turbidity phenomenon that horizontal visibility is less than 10km, which is generated by plenty of fine dry particles floating in the air. The composition of haze is complex. Haze often occurs when a large number of man-made particulate matters and aerosol particles transformed by gas and particulate matter increase and accumulate.
Atmospheric aerosol is a suspension of solid and liquid particles in air whose diameter are about 0.001-100μm. Aerosol is the important component of atmosphere, which play a critical role in global climate change and atmospheric heat balance. Also aerosol is the main composition of local photochemical smog and regional air pollution, which can reduce air visibility and affect human health. Compared with other properties of aerosol, AOD has been measured by ground-based and satellite-based instruments with relatively more mature technology. AOD refers to the integral for aerosol extinction coefficient from earth's surface to top of atmosphere, representing the extinction by aerosol in atmospheric vertical column without cloud.
In recent years, the estimations of PM concentration near surface from satellite remote sensing data focus on how to establish a correlation model between AOD and PM concentration. Linear regression methods have been widely used (Wang and Christopher, 2003; Hutchison, 2003; Li, et al., 2005). The influences of vertical distribution of aerosol, relative humidity (RH) and other climate factors have been introduced to correct the model so that the correlation ratio can be improved (Donlelaar, et al., 2006; Wang, et al., 2010).
The promising correlation between AOD and PM pollution has been found base on the measurements during the serious dust haze period in January 2013 in Beijing (Zhang and Li, 2013). The data of aerosol optical and microphysics properties from AERONET (Aerosol Robotic Network) at Beijing site are used. Fine-mode aerosol optical depth is estimated by aerosol fine-mode fraction using the data measured by sun photometer (CE318). Meanwhile, the correlation between AOD and PM2.5 is established:
2 2.5
PM 244.48AOD
10.6, R 0.77 (1)Height of planetary boundary layer (PBL), the mean of RH profile at the bottom of the troposphere, surface RH, near-surface temperature and other meteorological factors are introduced into the simple PM2.5-AOD correlation model to establish multiple regression linear and nonlinear models for near-surface PM concentration monitoring over Beijing and its surrounding area (Jia, et al., 2014). The relation between AOD through the atmosphere and PMx is:
f(RH) = function of RH profile in PBL <Qext> = normalized PM extinction efficiency reff = PM effective radius
α = ratio of AOD of PBL to AOD of whole atmosphere.
Furthermore, shape and size of aerosol particle, refractive index, single scattering albedo and other properties retrieved from remote sensing data provide plenty of information for investigating the composition, distribution and variation trend of pollution aerosol particles.
4. REQUIREMENTS OF PM MONITORING INSTRUMENT
Measuring aerosol optical properties accurately is the basis of improving the accuracy of particulate matters monitoring. Based on the Beijing-Tianjin-Hebei regional PM distribution feature and the empirical relations between AOD and PM concentration, the specifications including bands, viewing angles and polarization measuring requirements of the on-orbit PM monitoring instrument are discussed in this section.
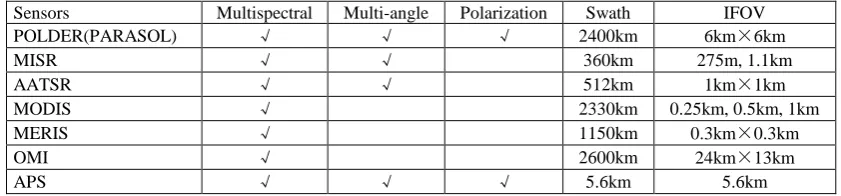
Traditional optical remote sensing is only to measure the spectrum, radiance and geometrical information, and not to identify the chemical composition in aerosol and to determine the quantity and concentration of aerosol particles. Currently, most sensors used to measure aerosol are not designed for this mission specially. Aerosol retrieval need the capacity for detecting the multispectral, multi-angle and polarization information. Considering less amount of data obtained by polar orbit satellite generally with a single daily overpass, a imager with required swath and spatial resolution will be better for the regional monitoring of pollutants. The major characteristics of some aerosol measuring instruments are listed in Table 1.
Sensors Multispectral Multi-angle Polarization Swath IFOV
POLDER(PARASOL) √ √ √ 2400km 6km×6km
4.1 Bands
Based on light scattering theory, the bands used for aerosol retrieval are in visible and near infrared range of 0.4-0.9μm. Different bands are chose respectively for observation of surface, ocean, cloud, water vapour and other objects according to their wavelength sensitivity. Typical bands for aerosol polarized reflectance measurements are with the central wavelength of 443nm, 555nm, 670nm and 865nm. In addition, the bands of 1610nm and 2250nm are used to determine the surface polarized reflectance as short wave infrared (SWIR) band is insensitive to atmosphere. Thus the contribution of surface reflectance to aerosol measurement can be removed on basis of the SWIR data, and the accuracy of aerosol retrieval can be improved.
Only the clean data in visible band with no cloud can be used in AOD retrieval. For aerosol observation by visible band instrument, the data should be identified whether it is with cloud, and the cloud contamination data should be deleted. If the spatial resolution of the instrument is not enough to identify the cloud data, high resolution cameras could be coupled with it for cloud detection. For example, Aerosol Polarimetry Sensor (APS) has only one single pixel which is carried on Glory spacecraft with two Cloud Cameras. The difference between the reflectance of cloud and earth surface is usually used to identify the cloud data. This method is applicable to the region that the surface albedo is quite different from cloud, but is not working for snow or other surface with high reflectance. Strong scattered solar radiance by cirrus can be determined in the water vapour strong absorbing band around 1380nm. And upper cirrus can be determined by setting respective threshold according to the reflectance of the cirrus over different surface.
During fog-haze days which are always with lots of cloud and absorbing aerosol optical path (AAOD) and aerosol index have been retrieved by applying OMAERO algorithm using spectral reflectance in UV and visible bands from OMI (Ozone Monitoring Instrument) (Torres, et al., 2007). AAOD which is very sensitive to absorptive aerosol is applicable for aerosol measurements over bright surface or cloud. And comparing to other instrument not covering UV band, the instrument with near UV bands obtain more information which also can be used to identify the aerosol type of weak absorbing aerosol or strong absorbing aerosol.
In conclusion, the required bands for pollution particulate matter monitoring instrument need to cover from UV to SWIR. The typical bands are 380nm, 443nm, 555nm, 670nm, 865nm, angle methods and multiple viewing angles methods according to the imaging manner of the instrument. The retrieval methods for single angle observation data include histogram matching
matching method. Based on the phenomenon that the reflectance of dense vegetation pixels in 2.13μm is strongly correlative to the reflectance of blue and red bands, dark object method is to calculate the reflectance of blue and red bands using band 2.13μm which is less affected by aerosols. This method is a typical and simple aerosol retrieval method with no polarization to estimate AOD by measuring surface reflectance of dark object, whose accuracy isn't much high, and not applicable to desert.
Multiple views imagers such as MISR and POLDER have been applied in remote sensing. Unlike traditional remote sensing which suppose earth surface to be Lambert, multiple views imaging can determine bidirectional reflectance accurately. The advantages of this imaging manner are:
1. Polarized reflectance of aerosol increases with the decreasing of scattering angle. The information which can be retrieved from polarized reflectance data are much less or even can be ignored when the scattering angle is up to larger than 150°. The reduction of polarized retrieval accuracy due to the large scattering angle can be solved by applying multiple viewing angles observation.
2. AOD retrieval by multiple viewing angles method only need to measure the ratio of corresponding surface reflectances of multiple views, which don't need the accurate surface reflectance itself. Furthermore, the requirement for calibration accuracy of instrument can be reduced.
The difference of the radiances through different atmospheric paths should be considered to design the view angles. This radiance difference increases along with the increasing of the zenith angle of tilt observation, thus the calculating error using known atmospheric model increases with it. Generally, zenith angle should be less than 60° to guarantee the calculation accuracy.
On basis of retrieval stability, retrieval accuracy will be higher if data of more viewing angles are brought into calculation. The instrument design will be much complex with too many angles. Selecting appropriate viewing angles can realize the required retrieval accuracy and can also adopt to the dedicated satellite platform.
4.3 Polarization
Removing the contribution of surface is very important for aerosol retrieval. Surface reflectance is much higher and with complex spatial distribution. In particular, the reflectance of bright surface changes obviously with time and different regions, which requires more higher calibration accuracy for the instrument. The change of surface reflectance of 1% can lead to the AOD error of 10%. However, the polarized reflectance of surface is much smaller and more stable than reflectance, which almost doesn't change with wavelength. And the polarization effects of aerosols scattered sunlight is much strong especially in small scattering angle. Therefore, the retrieval accuracy can be improved based on polarization determination.
to aerosol type. The polarization parameters such as degree of polarization, angle of polarization and polarization ellipticity are measured, which provide more dimensions of sensing information. Aerosol properties including refractive index, single scattering albedo, shape and size of aerosol particle can be retrieved from the data of multiple angles and polarization. The limitation of conventional optical measurements to determine atmospheric aerosol scattering phase function, particle size and its accuracy can be solved by remote sensing with multiple view angle and polarization.
According to polarization properties of aerosol, the determination of linear polarization characteristics is enough, while the circular polarization characteristics have very small influence to the measurements. The system of equations can be established with the values of three directions of 0°, 60° and 120° to derive the stokes parameters I, Q and U. The polarization measuring accuracy of instrument is corresponding to the extinction ratio of polarizing element, error of polarization axis, alignment error and polarization error of optical system. On ground and on orbit polarized radiometric calibration is critical for the polarization measuring accuracy so as to guarantee the retrieval accuracy of aerosol.
5. CONCLUSION
For the problems of the serious fog-haze pollution in Beijing-Tianjin-Hebei region and global particulate matter pollution, 3-D monitoring capability of ground-based measurement is limited to study the generating, developing and disappearing of fog and haze in air. Satellite remote sensing can provide regional coverage which is complementary to ground-based measurements. The remote sensing of global aerosols especially of fine PM need multispectral, multi-angle and polarization measurement in UV, visible, NIR and SWIR bands by using one instrument with all these functions or several instruments to cooperate. Optical and microphysical properties of atmospheric aerosol including AOD, shape and size of particle, refractive index and single scattering albedo can be retrieved from the remote sensing data. Furthermore, the spatial distribution and variation trend of PM2.5 can be used for the research on atmospheric environmental monitoring, climate change and weather forecast.
REFERENCES
van Donkelaar, A., R.V. Martin, and R.J. Park, 2006. Estimating ground-level PM2.5 using aerosol optical depth determined from satellite remote sensing. Journal of Geophysical Research, 111(d21), pp. D21201-1.
van Donkelaar, A., R.V. Martin, M. Brauer, R. Kahn, R. Levy, C. Verduzco, and P.J. Villeneuve, 2010. Global estimates of ambient fine particulate matter concentrations from satellite-based aerosol optical depth: development and application. Environmental Health Perspectives, 118(6), pp. 847-855.
He, K., H. Huo, and Q. Zhang, 2002. Urban air pollution in China: current status, characteristics and progress. Annual Review of Energy and the environment, 27, pp. 397-431.
Hutchison, K.D., 2003. Applications of MODIS satellite data and products for monitoring air quality in the state of Texas. Atmos. Environ., 37, pp. 2403-2412.
Jia, S., L. Su, J. Tao, Z. Wang, L. Chen, and H. Shang, 2014. A study of multiple regression method of estimating concentration of fine particulate matter using satellite remote sensing. China Environment Science, 34(3), pp. 565-573.
Kacenelenbogen, M., J.-F. Léon, I. Chiapello, and D. Tanré, 2006. Characterization of aerosol pollution events in France using ground-based and POLDER-2 satellite data. Atmos. Chem. Phys., 6, pp. 4843-4849.
Streets, D.G., J.H.S. Fu, C.J. Jang, J.M. Hao, K.B. He, X.Y. Tang, Y.H. Zhang, Z.F. Wang, Z.P. Li, and Q. Zhang, 2007. Air quality during the 2008 Beijing Olympics Games. Atmos. Environ., 41(26), pp. 480-492.
Sui, K., Z. Wang, J. Yang, F. Xie, and Y. Zhao, 2007. Beijing persistent PM10 pollution and its relationship with general meteorological features. Research of Environmental Sciences, 20(6), pp. 77-82.
Torres, O., A. Tanskanen, B. Veihelmann, C. Ahn, R. Braak, P.K. Bhartia, J.P. Veefkind, and P.F. Levelt, 2007. Aerosols and surface UV products from OMI observations: an overview. J. Geophs. Res., 112, pp. D24S47.
Wang, J., and S.A. Christopher, 2003. Intercomparison between satellite-derived aerosol optical thickness and PM2.5 mass: implications for air quality studies. Geophys. Res. Lett., 30(21), pp. 2095.
Wang, X., and J. Li, 2003. A numerical simulation study of PM10 pollution in Beijing during summer time. Acta Scientiarum Naturalium Universitatis Pekinensis, 39(3), pp. 419-427.
Wang, Z., L. Chen, J. Tao, Y. Zhang, and L. Su, 2010. Satellite-based estimation of regional particulate matter (PM) in Beijing using vertical-and-RH correcting method. Remote Sensing of Environment, 114(1), pp. 50-63.
Xu, H.,Y. Zhang, W. Hou, Y. Lv, L. Li, X. Gu, and Z. Li, 2013. Monitoring of haze in Beijing region from HJ-1 data. Journal of Remote Sensing, 17(2), pp. 476-477.
Zhang, Q., C. Zhao, X. Tie, Q. Wei, M. Huang, G. Li, Z. Ying, and C. Li, 2006. Characterizations of aerosols over the Beijing region: a case study of aircraft measurements. Atmos. Environ., 40(24), pp. 4513-4527.
Zhang, Y., and Z. Li, 2013. Estimation of PM2.5 form fine-mode aerosol optical depth. Journal of Remote Sensing, 17(4), pp. 929-943.