Modeling radiation- and carbon-use efficiencies
of maize, sorghum, and rice
Bhaskar J. Choudhury
∗NASA Goddard Space Flight Center, Hydrological Sciences Branch, Laboratory for Hydrospheric Processes, Greenbelt, MD 20771, USA Received 11 May 2000; received in revised form 1 September 2000; accepted 8 September 2000
Abstract
A previously developed model for radiation-use efficiency (RUE) for gross photosynthesis and net carbon accumulation by wheat before anthesis [Agric. Forest Meteorol. 101 (2000) 217], with some improvement, has been applied to maize, sorghum, and rice during their vegetative period under unstressed conditions. The objective of the present study is to assess the extent to which the model can provide RUE for net carbon accumulation and carbon-use efficiency (CUE; the ratio of daily net carbon accumulation and gross photosynthesis) for a range of incident irradiance and leaf area indices of maize, sorghum and rice, recognizing that (a) these crops are grown in substantially different environmental conditions than those for wheat, and (b) while rice is a C3crop like wheat, maize and sorghum are C4crops. The calculated RUE values for net carbon accumulation differed from observations (five for maize, two for sorghum and three for rice) by−24% to+19%, with an average (n =10) of−4% (underestimation), while the calculated CUE values are found to be within the range of observations. The model parameters have not been calibrated or adjusted for these comparisons. Calculations suggest that there is much room to increase the RUE of sorghum over the currently available measurements, although it might not attain the potential maximum value for maize. The effects of variations in the maximum rate of leaf photosynthesis among cultivars, changes in the relationship between maximum rate of photosynthesis by leaves and its nitrogen content, and uncertainties in the input canopy parameters on RUE and CUE are assessed by sensitivity analysis. Published by Elsevier Science B.V.
Keywords: Photosynthesis; Respiration; Radiation-use efficiency; Carbon-use efficiency; Maize; Sorghum; Rice
1. Introduction
A model for radiation-use efficiency (RUE) of wheat during its vegetative phase under unstressed conditions has been developed (Choudhury, 2000) considering diurnal variations of direct and diffuse PAR on sunlit and shaded leaves, and variation of the maximum rate of leaf photosynthesis within the canopy due to changes in leaf nitrogen content to calculate daily total gross photosynthesis. The
main-∗Tel.:+1-301-614-5767; fax:+1-301-614-5808.
E-mail address: [email protected] (B.J. Choudhury).
tenance respiration at a prescribed temperature was determined from nitrogen content per unit ground area of foliage, stem and roots, while growth res-piration was calculated as being proportional to the difference of gross photosynthesis and maintenance respiration. Comparison of the calculated RUE with those determined from observations (number of ob-servations;n=3) gave differences of−7% to+25% without any model calibration.
The objective of the present study is to assess the extent to which the model can provide RUE and carbon-use efficiency (CUE; the ratio of daily carbon accumulation and gross photosynthesis) for a range
of incident irradiance and leaf area indices of maize, sorghum, and rice during their vegetative phase under unstressed conditions. These crops have been cho-sen because environmental conditions (particularly temperature) during their growth differ substantially from those for wheat. Also, while rice has C3 type
photosynthesis like wheat, maize and sorghum have C4type photosynthesis.
2. Description of the model
The components of the model (Choudhury, 2000), particularly those relevant to the present study, are presented below.
2.1. Gross photosynthesis by a leaf
The variation of the maximum rate of photosynthe-sis by a leaf (Am; Eq. (4) in Choudhury, 2000) within
a canopy due to changes in nitrogen content per unit leaf area, nl(mmol N m−2), has been prescribed as
fol-lows; for maize and sorghum (Muchow and Sinclair, 1994):
and, for rice (Sinclair and Horie, 1989):
Am=34
where Amax is the potential maximum rate of gross
photosynthesis by leaves.
Considering field measurements, the mean maxi-mum rate of net photosynthesis for maize leaves ap-pears to be 55mmol CO2 m−2s−1 (n = 11; range
50–60mmol CO2m−2s−1), while dark respiration has
been found to be 2mmol CO2 m−2s−1. Thus, Amax
for maize leaves has been taken to be 57mmol CO2
m−2s−1, and the effect of variations in Amaxhas been
addressed by sensitivity analysis (Section 4.3.1). Field observations by Kidambi et al. (1990) gave mean maximum net photosynthesis of sorghum leaves as 45mmol CO2m−2s−1(n=30; range 30–55mmol CO2m−2s−1). With dark respiration as 2mmol CO2
m−2s−1, Amaxfor sorghum leaves has been taken to
be 47mmol CO2m−2s−1, while the effect of varietal
differences in Amax on RUE and CUE has been
as-sessed by sensitivity analysis (Section 4.3.1). The effect of variations in Amfor rice (Peng et al.,
1995) and varietal differences in Amax on RUE and
CUE have been addressed by sensitivity analysis (Sec-tion 4.3.2).
The quantum efficiency (ε; Eq. (5) in Choudhury, 2000) is independent of foliage temperature for C4
species (maize and sorghum), but vary with tempera-ture for C3 species (rice). Choudhury (2000)
consid-ered foliage temperature to be equal to air temperature for calculating RUE of wheat, and found by sensitiv-ity analysis that 5◦C change in temperature affected the RUE for gross photosynthesis by 3% for clear sky condition and 6% for overcast condition. To improve accuracy of determining RUE, the diurnal variation of canopy temperature has been calculated from an energy balance equation.
2.2. Respiration
The daily total respiration by a stand (foliage, stem and roots) per unit ground area at temperature T◦C {R(T); mol CO2m−2per day}has been calculated as
Agis the daily total gross photosynthesis by a canopy,
Q10 the temperature response coefficient (taken to be
2.0) and YG is the growth conversion efficiency.
Choudhury (2000) used mean daily air temperature (T) in Eq. (2b) to calculate Rm(T) for wheat. Such a
procedure, however, underestimates Rm(T) because of
diurnal variation of T and non-linear dependence of
Rm(T) on T. As an improvement, the following
where I0(x) is the modified Bessel function, 1T the
diurnal temperature range and
K= ln(Q10)
10 (2e)
From elemental and proximal analyses, Lafitte and Loomis (1988) obtained the following equation for YG
of sorghum in terms of plant nitrogen concentration N (percent of dry matter):
YG =0.814−0.051N (3)
The YG for rice has been taken to be 0.74 (n=4).
2.3. Radiation- and carbon-use efficiencies
From daily total gross photosynthesis (Ag; mol CO2
m−2 per day) and respiration (R; mol CO2 m−2 per
day), carbon accumulation per day (C; mol CO2m−2
per day) (or CO2equivalent of crop growth rate) has
been determined as
C=Ag−R (4)
Then RUE (mmol CO2 per mol intercepted photon;
mmol mol−1) has been obtained as the ratio of C and daily total IPAR (mol photon m−2per day):
RUE= C
Using Eqs. (2) and (6), one can also express CUE as
CUE=YG
Eq. (7) shows that YG sets the upper limit of CUE.
It also follows from Eq. (7) that, for a given canopy, CUE will decrease with decreasing irradiance because
Agdecreases with decreasing irradiance, while YGand
Rm(T) do not depend upon irradiance. If RUE for gross
photosynthesis (RUEg; mmol CO2 mol−1 photon
intercepted) is defined as
RUEg= Ag
IPAR×1000 (8)
then one can express RUE as
RUE=RUEg×CUE (9)
Unlike the case for CUE, changes in RUE due to variations of irradiance cannot be stated precisely be-cause, while CUE decreases with decreasing irradi-ance, RUEg tends to increase, as will be shown in
Section 4.1 (see also Choudhury, 2000).
2.4. Maximum radiation-use efficiency
To provide a reference to the calculated and served RUE presented below, some estimates are ob-tained for a theoretical maximum RUE. Knowledge of a theoretical maximum RUE can be used to nor-malize actual RUE, and thus provide an aesthetically pleasing dimensionless efficiency varying between 0 and 1.
As discussed in Section 2.3, the growth conversion efficiency (YG) provides a theoretical maximum value
for CUE (Eq. (7)), although CUE can only approach, but not attain, this value because neither maintenance respiration can be zero nor gross photosynthesis can be infinity. It can be shown that under some condi-tions RUE for gross photosynthesis (RUEg) can attain
its maximum value (RUEg,max) equal to the
appar-ent quantum efficiency (=εα) of photosynthesis by a leaf. Thus, from Eq. (9), a theoretical maximum RUE (RUEmax) is obtained as
RUEmax=YGεα (10)
and any realizable (estimated or observed) RUE would have to be less than that given by Eq. (10).
Representative values of YG and α are,
re-spectively, 0.74 and 0.85. Since ε of C4 crops
(maize and sorghum) is about 62 mmol CO2 mol−1
photon, RUEmax for maize and sorghum is obtained
as 39 mmol mol−1, which is equivalent to about 5.4 g (CH2O) MJ−1 (IPAR). The quantum efficiency of
C3 crops (wheat and rice) is about 69 and 55 mmol
CO2 mol−1 photon at day-time foliage temperature
of, respectively, 18 and 28◦C. For these values of the quantum efficiency, the values of RUEmax are,
respectively, 43 and 34 mmol mol−1. Eq. (10) can be used to assess relative limitations in RUEg and
3. Input data
3.1. Stand characteristics
The input data needed for stand characteristics are leaf area index (Lo) and nitrogen content of foliage,
stem and roots per unit ground area. Each of these
Table 1
Number of data values (n), mean and standard deviation (in parenthesis) of canopy leaf area index (Lo) and nitrogen content per unit
ground area (mmol N m−2) of foliage, stem and roots used in the calculations
Crop n Lo Nitrogen content
Foliage Stem Roots
Maize 24 2.7 (1.5) 281 (177) 160 (110) 55 (42)
Sorghum 13 2.7 (1.9) 230 (115) 161 (115) 109 (17)
Rice
Transplanted 9 3.5 (1.7) 327 (139) 127 (88) 39 (17)
Direct seeded 5 6.2 (1.7) 335 (128) 282 (112) 107 (19)
All 14 4.5 (2.1) 330 (130) 182 (120) 64 (38)
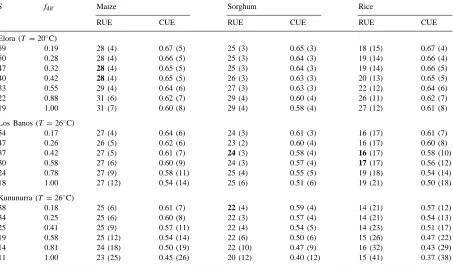
Table 2
The daily total incident irradiance (S, mol m−2 per day), diffuse fraction of the irradiance (f
dif), radiation-use efficiency for net carbon
accumulation (RUE, mmol mol−1) and carbon-use efficiency (CUE, mol mol−1) for maize, sorghum, and ricea
S fdif Maize Sorghum Rice
RUE CUE RUE CUE RUE CUE
Elora (T =20◦C)
59 0.19 28 (4) 0.67 (5) 25 (3) 0.65 (3) 18 (15) 0.67 (4)
50 0.28 28 (4) 0.66 (5) 25 (3) 0.64 (3) 19 (14) 0.66 (4)
47 0.32 28 (4) 0.65 (5) 25 (3) 0.64 (3) 19 (14) 0.66 (5)
40 0.42 28 (4) 0.65 (5) 26 (3) 0.63 (3) 20 (13) 0.65 (5)
33 0.55 29 (4) 0.64 (6) 27 (3) 0.63 (3) 22 (12) 0.64 (6)
22 0.88 31 (6) 0.62 (7) 29 (4) 0.60 (4) 26 (11) 0.62 (7)
19 1.00 31 (7) 0.60 (8) 29 (4) 0.58 (4) 27 (12) 0.61 (8)
Los Banos (T =26◦C)
54 0.17 27 (4) 0.64 (6) 24 (3) 0.61 (3) 16 (17) 0.61 (7)
47 0.26 26 (5) 0.62 (6) 23 (2) 0.60 (4) 16 (17) 0.60 (8)
37 0.42 27 (5) 0.61 (7) 24 (3) 0.58 (4) 16 (17) 0.58 (10)
30 0.58 27 (6) 0.60 (9) 24 (3) 0.57 (4) 17 (17) 0.56 (12)
24 0.78 27 (9) 0.58 (11) 25 (4) 0.55 (5) 19 (18) 0.54 (14)
18 1.00 27 (12) 0.54 (14) 25 (6) 0.51 (6) 19 (21) 0.50 (18)
Kununurra (T =26◦C)
38 0.18 25 (6) 0.61 (7) 22 (4) 0.59 (4) 14 (21) 0.57 (12)
34 0.25 25 (6) 0.60 (8) 22 (3) 0.57 (4) 14 (21) 0.54 (13)
25 0.41 25 (9) 0.57 (11) 22 (4) 0.54 (5) 14 (23) 0.51 (17)
19 0.58 25 (12) 0.54 (14) 22 (6) 0.50 (6) 15 (26) 0.47 (22)
14 0.81 24 (18) 0.50 (19) 22 (10) 0.47 (9) 16 (32) 0.43 (29)
11 1.00 23 (25) 0.45 (26) 20 (12) 0.40 (12) 15 (41) 0.37 (38)
aThe coefficients of variation (%) of RUE and CUE are given in parenthesis for all canopies of maize (n=24), sorghum (n=13),
and rice (n=14). The highlighted figures appear in Table 3.
stand characteristics changes during growth, and at any time they can vary with husbandry, cultivar of a species and meteorological conditions prevailing dur-ing growth. It is desirable to have all the needed data measured concurrently for a variety because while Ag
depends upon Loand foliage nitrogen content, Rm(T)
roots. Estimating Loor foliage nitrogen content using
data from different sources introduce uncertainty in determining Ag, and such uncertainty appears in
de-termining Rm(T) when shoot and root nitrogen
con-tent have not been determined concurrently. However, such desirable sets of data were very limited, and thus measurements from different sources have been used to determine the needed stand characteristics. The impact of uncertainties in the input data on RUE and CUE has been addressed by sensitivity analysis (Section 4.3.3).
The Lo and nitrogen content per unit ground area
(mmol m−2) of foliage, stem and roots used in the calculations are summarized in Table 1. These data have been extracted from published tables and figures (after enlargement to minimize error), or estimated using allometric relations.
3.2. Incident irradiance
The direct and diffuse incident irradiance have been calculated from a model (Choudhury, 2000) by pre-scribing the atmospheric conditions and times during the day being cloudy at Elora (43.7◦N, 80.4◦W) during July, Los Banos (14.2◦N, 121.3◦E) during April, and Kununurra (15.7◦S, 128.7◦E) during June (Table 2). These locations and time have been chosen for hav-ing RUE data and to capture the diversity of radia-tion regime which can prevail during growth of these crops.
4. Results and discussion
4.1. Illustrative results
The variations of average RUE and CUE for the three crops with incident irradiance are given in Table 2 for Elora, Los Banos, and Kununurra. Calcu-lations have been done for representative mean daily air temperature of 20◦C at Elora, and 26◦C at Los Banos and Kununurra. Since the irradiance is similar at Elora and Los Banos, the effect of temperature on RUE and CUE can be assessed by comparing the results in this table. Thus, RUE and CUE values are seen to be higher at Elora as compared to those at Los Banos because of lower respiration at Elora (Eq. (2d)). The effect of temperature on RUE and CUE is seen to
be more noticeable for rice as compared to maize and sorghum because the quantum efficiency of photo-synthesis by leaves of C4crops (maize and sorghum)
is independent of temperature, while it decreases with increasing temperature for C3 crops (rice). As a
consequence, canopy gross photosynthesis of rice de-creases with increasing temperature. Moreover, since quantum efficiency becomes progressively important determinant of gross photosynthesis as irradiance decreases, so also the effect of temperature. Thus, the RUE for rice decreases by 11% for clear skies (18 vs. 16 mmol mol−1; the first line in this table at each location), and by 30% for overcast skies (27 vs. 19 mmol mol−1; the last line in this table at each loca-tion) in going from Elora to Los Banos. This sensitiv-ity to temperature has been elaborated in Choudhury (2000).
One can see in this table that CUE for all crops de-creases with decreasing total irradiance, for the reason discussed in Section 2.3. However, RUE does not have any systematic pattern of variation with total irradi-ance. At Elora, the RUE of all three crops increases with decreasing irradiance. At Los Banos, the RUE of maize is relatively constant, while it is decreasing and then increasing for rice with decreasing irradiance. At Kununurra, the RUE of maize and sorghum remains steady and then decreases with decreasing irradiance, while it remains steady and then increases for rice. This lack of a systematic pattern appears because RUE is the product of RUE for gross photosynthesis (RUEg)
and CUE (Eq. (9)), and RUEgalso changes with
inci-dent total irradiance (Fig. 1).
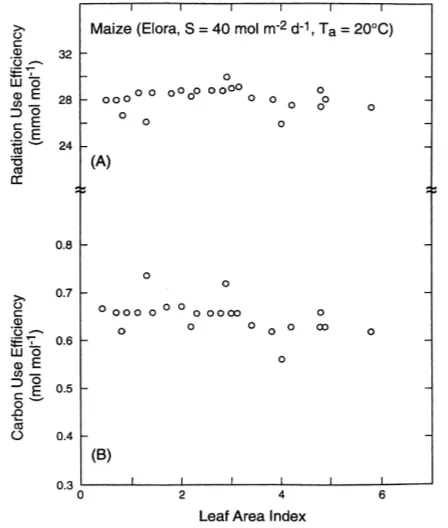
The RUE and CUE are found to be relatively in-sensitive to changes in leaf area index (Lo) for maize
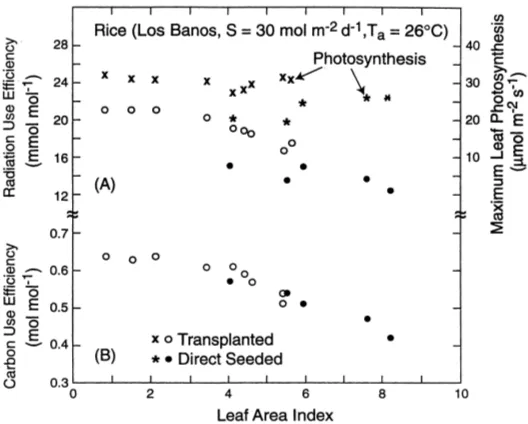
(Fig. 2) and sorghum (Fig. 3), but they tend to de-crease with increasing Lowhen greater than three for
rice (Fig. 4). With plant growth, respiration remains closely in balance with gross photosynthesis by maize and sorghum.
In Section 2.4 a theoretical maximum RUE (RUEmax) for maize was found to be 39 mmol mol−1.
The results at Elora for maize (Table 2) show that the calculated average RUE (29 mmol mol−1) is about 26% lower than the RUEmax. In this case the
cal-culated average CUE (ca. 0.64) is about 14% lower than the maximum possible value, YG (0.74).
Simi-larly, the RUEmax for rice in a tropical environment
Fig. 1. The variation of average radiation-use efficiency for gross photosynthesis (mmol CO2 per mol intercepted photon;
mmol mol−1) by maize (n=24) and rice (n=14) canopies with
incident total irradiance at Kununurra (Australia).
the calculated average RUE at Los Banos (Table 2) is about 50% lower. In this case, the calculated average CUE (ca. 0.57) is about 23% lower than YG
(0.74).
The RUEmax for sorghum was found to be
39 mmol mol−1 (Section 2.4). For clear sky con-dition at Kununurra (Table 2), the calculated RUE (22 mmol mol−1) is 44% lower, while the correspond-ing CUE is 23% lower than the respective maximum values. Thus, CUE is contributing to about half the departure for RUE. However, for overcast condition, the calculated RUE (20 mmol mol−1; Table 2) is 49% lower than RUEmax, but in this case CUE is 46%
lower than the theoretical maximum values (=0.74). Thus, the major fraction of departure of RUE from RUEmax for overcast condition is occurring due to
the departure of CUE from its theoretical maximum value.
Fig. 2. The variation of radiation-use efficiency (mmol CO2 per
mol intercepted photon; mmol mol−1) and carbon-use efficiency
(mol CO2per mol CO2; mol mol−1) with leaf area index for maize
at Elora (Canada).
4.2. Comparison with observations
4.2.1. Radiation-use efficiency
The reported values of RUE are based on field measurements of biomass accumulation (generally above ground dry matter, although a few studies have included below ground dry matter) and IPAR (either measured in different ways or calculated from measured Lo and incident irradiance). Some of the
Fig. 3. The variation of radiation-use efficiency (mmol mol−1)
and carbon-use efficiency (mol mol−1) with leaf area index for
sorghum at Los Banos (Philippines), and Kununurra (Australia).
Fig. 4. The variation of radiation-use efficiency (mmol mol−1) and carbon-use efficiency (mol mol−1) with leaf area index for rice at Los
Banos (Philippines). Also shown are the maximum rate of leaf photosynthesis (mmol m−2s−1) obtained from Eq. (2b).
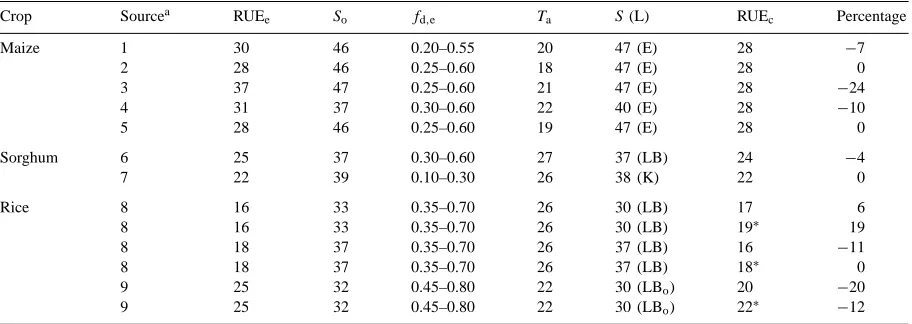
Table 3
Comparison of estimated (based on observations) and calculated radiation-use efficiency for net carbon accumulation (respectively, RUEe
and RUEc; mmol mol−1). Also given are the sources for the observations, mean daily irradiance (So, mol m−2 per day), estimated range of
diffuse fraction for the irradiance (fd,e) and mean daily air temperature (Ta,◦C) corresponding to the RUEe, the irradiance S (L: location;
E for Elora, LB for Los Banos, and K for Kununurra) corresponding to the calculated RUE (highlighted figures in Table 2) and percent difference of the RUE values (%). The calculated RUE values for rice with asterisk are averages for the transplanted canopies (n=9), and subscript ‘o’ when observed temperature is used
Crop Sourcea RUEe So fd,e Ta S (L) RUEc Percentage
Maize 1 30 46 0.20–0.55 20 47 (E) 28 −7
2 28 46 0.25–0.60 18 47 (E) 28 0
3 37 47 0.25–0.60 21 47 (E) 28 −24
4 31 37 0.30–0.60 22 40 (E) 28 −10
5 28 46 0.25–0.60 19 47 (E) 28 0
Sorghum 6 25 37 0.30–0.60 27 37 (LB) 24 −4
7 22 39 0.10–0.30 26 38 (K) 22 0
Rice 8 16 33 0.35–0.70 26 30 (LB) 17 6
8 16 33 0.35–0.70 26 30 (LB) 19∗ 19
8 18 37 0.35–0.70 26 37 (LB) 16 −11
8 18 37 0.35–0.70 26 37 (LB) 18∗ 0
9 25 32 0.45–0.80 22 30 (LBo) 20 −20
9 25 32 0.45–0.80 22 30 (LBo) 22∗ −12
aSources: 1 (Tollenaar and Bruulsema, 1988); 2 (Andrade et al., 1992); 3 (Andrade et al., 1993); 4 (Kiniry, 1994); 5 (Westgate et al.,
1997); 6 (Sivakumar and Huda, 1985); 7 (Muchow and Coates, 1986); 8 (Kiniry et al., 1989); 9 (Horie and Sakuratani, 1985).
averages for only transplanted canopies are also given). A brief elaboration of some of the data in Table 3 is given below.
From the measured growth rate of above ground dry matter and the rate of PAR absorbed by maize grown at Elora (43.7◦N, 80.4◦W), Tollenaar and Bruulsema (1988) found the maximum RUE to be 0.753 g mol−1during the vegetative period. This value has been multiplied by 0.96 (Tollenaar and Bruulsema, 1988) to convert RUE based on absorbed PAR to IPAR. Thus, the estimated RUE is 30 mmol mol−1 (=0.753×0.42×1.2×0.96×1000/12). The calculated value is 7% lower.
From periodic measurements of above ground dry matter and interception of PAR by maize at Morris (45.6◦N, 95.9◦W), Westgate et al. (1997) found the maximum RUE to be 3.02 g MJ−1. The observed
irra-diance at St. Cloud was considered in the calculation. From periodic measurements of total dry matter and
Lofor transplanted rice (cv. IR54) grown at Los Banos
(14.2◦N, 121.3◦E) and incident irradiance, Kiniry et al. (1989) calculated IPAR and determined RUE to be 2.2 g MJ−1. The estimated RUE is 16 mmol mol−1. The calculated average RUE for all canopies is 6% higher than the estimated value, while it is 19% higher
if only transplanted canopies are considered. A dis-crepancy of 19% would be more appropriate because the crop was transplanted.
Kiniry et al. (1989) quote another value of RUE for above ground dry matter production for rice as 2.1 g MJ−1 (the citation for these data suggest that these measurements were at Los Banos). The IPAR was estimated from measured Lo and incident
irradi-ance. It is not stated whether these data are for trans-planted or direct seeded rice. The estimated RUE is 18 mmol mol−1 (=2.1×1.15×0.4×1000/(4.6×12)). The average RUE calculated for all canopies and those for transplanted canopies are, respectively, 16 and 18 mmol mol−1. Considering that transplanting is the most common practice for growing rice, the estimated and calculated RUE values are in good agreement.
mean daily irradiance (May–September) at this loca-tion is about 32 mol m−2 per day, while mean daily temperature at Shimodata (36.2◦N, 140.0◦E) is found to 22◦C. The calculated average RUE for transplanted canopies is 12% lower than the estimated value.
For the above comparisons, the estimated and calculated RUE values differ by −24% to +19%. The ensemble average (n = 10) calculated RUE (25 mmol mol−1) differs from the estimated value (26 mmol mol−1) by 4%. As noted above,
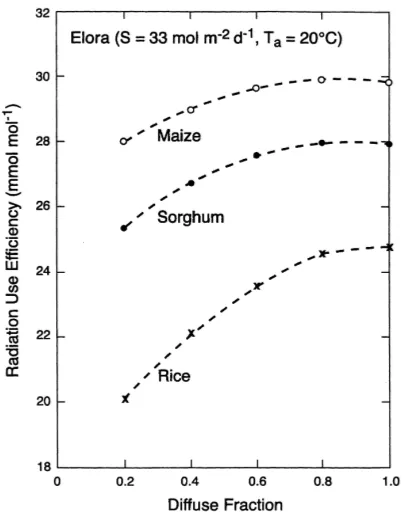
discrep-ancies of up to 10% between the estimated and calculated RUE for maize and sorghum, and 5% for rice cannot be resolved due to residual uncertainty in specifying root biomass, when this was not included in the measurements. Although the diffuse fraction of the calculated incident irradiance (Table 2) is within the range of observations (Table 3), uncertainty in specifying this fraction for the observed incident ir-radiance was found to introduce additional ca. 2–7% variability in the calculated RUE (Fig. 5). Thus, an attempt has been made in Section 4.3 to understand
Fig. 5. The variation of average radiation-use efficiency (mmol mol−1) with diffuse fraction for a constant total incident
irradiance of 33 mol m−2 per day at Elora for maize (n=24),
sorghum (n=13), and rice (n=14).
rather large discrepancies for maize (−24%) and rice (+19%).
4.2.2. Carbon-use efficiency
For potted maize plants, Yamaguchi (1978) found CUE to be in the range 0.49–0.73 (average 0.60,
n = 14). Field studies at Moscow (55.8◦N, 37.6◦E) by Koshkin et al. (1987) gave CUE in the range 0.60–0.73 (average 0.67,n = 10) during vegetative stage. Louwerse et al. (1990) provide measurements of gross photosynthesis, above ground biomass and respiration for a field study with maize at Wageningen (51.9◦N, 5.7◦E). These measurements suggest CUE to be in the range 0.60–0.65 during the vegetative stage, if root biomass is assumed to be 20% of the above ground biomass. The calculated values at Elora are within this range, but somewhat lower values are ob-tained at Los Banos and Kununurra because of higher temperature (and thus higher maintenance respiration) at these two locations (Table 2). However, since the reported values are from temperate locations, com-parison with the results at Elora is more appropriate.
Measurements reported by Wilson et al. (1980) for a growth chamber study of sorghum suggest CUE to be 0.56–0.64 (average 0.60,n = 15) in the absence of severe stress (daytime leaf water potential greater than−1 MPa). The CUE values reported by McCree (1988) based on growth chamber study are in the range 0.54–0.66 (average 0.60, n = 29). The calculated values are fairly consistent with these data (Table 2, Fig. 2). It is desirable to have field measurements for a better evaluation of the calculated values.
be 0.59–0.65. The calculated range of average CUE for all canopies at Los Banos is 0.50–0.61 (Table 2), but it is 0.54–0.64 when only transplanted canopies (n=9) are considered. The calculated average CUE for the transplanted rice at Los Banos for represen-tative mean daily irradiance during the vegerepresen-tative pe-riod (0.59 at the irradiance of 30 mol m−2 per day, 0.61 at the irradiance of 37 mol m−2 per day, and 0.62 at the irradiance of 44 mol m−2per day, n=9) compare well with field measurements at this loca-tion (0.59, Tanaka and Yamaguchi, 1968; 0.6, Cock and Yoshida, 1973, as quoted above), although the average values for all canopies is somewhat lower (0.56–0.59; Table 2). The calculated decreasing trend of CUE with increasing Lo(Fig. 3) is consistent with
measurements reported by Hirota and Takeda (1978), but Cock and Yoshida (1973) did not observe such variation.
The calculated CUE values for the three crops are consistent with the reported data. The model param-eters were not calibrated or adjusted for the above comparisons. Field measurements are desirable for a better evaluation of the calculated results for sorghum. A comparison of CUE values for the three crops in Table 2 and the results shown in Fig. 3 also suggest that CUE is less sensitive to changes in Amaxand
dif-fuse fraction for a given total irradiance.
4.3. Sensitivity analysis
4.3.1. Maximum leaf photosynthesis
Calculations for maize and sorghum reported above were done by taking the maximum rate of leaf pho-tosynthesis (Amax; Eq. (2a)), respectively, as 57 and
47mmol m−2s−1, which are the mean maximum val-ues, while it was noted in Section 2.1 that the range for maize is 52–62mmol m−2s−1, and for sorghum is 32–57mmol m−2s−1.
At Elora, calculations using Amax of 57 for
maize gave average RUE and CUE as, respectively, 28 mmol mol−1and 0.65 mol mol−1for incident irra-diance of 40 or 47 mol m−2per day (Table 2). When calculations were re-done using the range of Amax,
changes in RUE and CUE were, respectively, about 3 and 1% from the base values.
At Los Banos, calculations using Amax of 47
for sorghum gave average RUE and CUE as, re-spectively, 24 mmol mol−1 and 0.58 mol mol−1 for
incident irradiance of 37 mol m−2 per day (Table 2). When calculations were re-done, the RUE and CUE decreased by, respectively, 17 and 4% when Amax
was 32mmol m−2s−1, and they increased by, respec-tively, 8 and 1% when Amaxwas 57mmol m−2s−1, as compared to the base values.
At Kununurra, calculations using Amax of 47 for
sorghum gave average RUE and CUE as, respectively, 22 mmol mol−1 and 0.59 mol mol−1 for incident ir-radiance of 38 mol m−2 per day (Table 2). When
calculations were re-done, the RUE and CUE de-creased by, respectively, 22 and 5% when Amax was
32mmol m−2s−1, and they increased by, respectively, 10 and 2% when Amax was 57mmol m−2s−1, as compared to the base values.
For a given uncertainty in Amax, the relative changes
in RUE and CUE depend upon incident irradiance, and the changes in CUE are found to be lower than those in RUE. These differing sensitivity for RUE and CUE appears because changes in Amaxdirectly affects gross
photosynthesis (and RUEg), while maintenance
respi-ration does not get affected. These sensitivity results suggest that, when grown in similar environmental conditions, cultivar related variability of RUE would be expected to be more noticeable in sorghum than in maize.
The calculated RUE of maize, in one case, was found to be 24% lower than the estimated value (Table 3). Consideration of the uncertainties in spec-ifying the maximum rate of leaf photosynthesis and the diffuse fraction associated with the observed in-cident irradiance (Tables 2 and 3), suggests that the potential maximum RUE might be 30 mmol mol−1 in-stead of 28 mmol mol−1given in Table 3 (see further discussion below). Now, to reconcile the remaining difference (37 vs. 30 mmol mol−1), it is pertinent to analyze possible reasons for overestimation. If, instead of 20%, root biomass is taken to be 10% of shoot biomass, the estimated RUE would be 34 (=37×1.1/1.2) mmol mol−1. Moreover, Uhart and
uncertainties in the measurements and in specifying input parameters of the model.
By ignoring the above data due to varied uncertain-ties, the average (n=4) estimated and calculated RUE for maize are, respectively, 29 and 28 mmol mol−1, while those for sorghum (n=2) are, respectively, 24 and 23 mmol mol−1 (Table 2). Based on these aver-ages, the estimated RUE for sorghum is 17% lower than that for maize, while it is 18% lower for the calculated values of RUE. Thus, present calculations are providing a reasonable understanding about lower RUE observed for sorghum as compared to that for maize, which was not understood previously (Sinclair and Muchow, 1999).
The results in Table 2 show that when maize and sorghum are “grown” side-by-side, the RUE of sorghum would be, on the average, ca. 7–13% lower than that for maize. Higher difference found above is primarily because the RUE values for maize are from temperate locations, while those for sorghum are from tropical locations (lower respiration at temperate loca-tions). The average potential (observable) maximum RUE, calculated by takingAmax=62mmol m−2s−1 for maize andAmax=57mmol m−2s−1for sorghum, and the likely maximum fraction of diffuse radi-ation for a given total incident irradiance appears to be about 30 and 28 mmol mol−1, respectively, for maize and sorghum at Elora, and these values are, respectively, about 28 and 26 mmol mol−1 at Los Banos (Fig. 6). These potential maximum val-ues are not the same at both locations because of the difference in mean daily temperature; 20◦C at Elora vs. 26◦C at Los Banos. The potential maxi-mum value for maize at Elora is 23% lower than a theoretical maximum value of 39 mmol mol−1 (Sec-tion 2.4), and this shortfall of 23% is contributed about equally by the shortfall of CUE (=0.65) from a theoretical maximum value (YG=0.74) and RUEg
(=46 mmol mol−1) from its potential maximum value (= αε = 53 mmol mol−1). Loomis and Amthor (1999) estimated the potential maximum RUE of maize to be 4.6 g (carbohydrate) MJ−1(IPAR) (which is equivalent to 33 mmol mol−1) in the temperature range 20–30◦C for a canopy which has a dry matter of 14 t ha−1and is intercepting 62 mol m−2per day. The present calculations are giving somewhat lower aver-age values (ca. 10% at Elora, and 15% at Los Banos) for the potential maximum RUE of maize for
reason-Fig. 6. The variation of the average potential maximum radiation-use efficiency (mmol mol−1) of maize (n = 24) and
sorghum (n=13) with incident total irradiance at (a) Elora, and (b) Los Banos.
able values of mean daily incident irradiance during the vegetative period (Fig. 6). Nevertheless, consider-able room appears to exist for improving the RUE of sorghum over the presently available observations.
4.3.2. Leaf photosynthesis — nitrogen relationship
Field measurements by Peng et al. (1995) gave the following relationship for rice:
Am=0.20(nl+30) (11)
While the average RUE for gross photosynthesis (RUEg) calculated using Eq. (1b) is 31.0 mmol mol−1,
it is 31.5 mmol mol−1 obtained using Eq. (11) at Los
20 (9) mmol mol−1and 0.59 (8) mol mol−1, which are nearly equal to those quoted above (Section 4.1) ob-tained using Eq. (1b). Thus, application of Eq. (11) is not providing an explanation for the discrepancy of 19% between the estimated and calculated RUE (Table 3).
If one accepts the estimated RUE of 16 mmol mol−1 (Table 3) and CUE of 0.60 mol mol−1 (Tanaka and Yamaguchi, 1968; Cock and Yoshida, 1973) are representative for transplanted rice at Los Banos, it follows from Eq. (9) that a representative RUEg
would be 27 mmol mol−1. The calculated mean RUEg
of 33 mmol mol−1 for transplanted canopies (noted above in this section) is 22% higher than the esti-mated RUEg. Such an error in RUEgcan occur when
the calculated canopy gross photosynthesis is higher or IPAR is lower than observations. Comparison of the calculated and observed canopy gross photosyn-thesis at Los Banos did not show the calculated gross photosynthesis to be noticeably higher than the ob-servations (results not shown). As noted in Section 4.2.1, Kiniry et al. (1989) had estimated IPAR from measured Lo and incident irradiance, assuming PAR
extinction coefficient to be 0.65. The results from radiative transfer model (Choudhury, 2000), used to determine IPAR and irradiance on leaves, gave an average extinction coefficient of 0.62. This difference in the extinction coefficient can cause ca. 3% differ-ence in IPAR whenLo=1, and the difference would
be much less for higher Lo. Thus, the above
consid-erations are not providing an understanding of 19% discrepancy in Table 3.
While Eqs. (1b) and (11) describe variation of the maximum rate of leaf photosynthesis within a canopy due to variation in leaf nitrogen content, observations show that different cultivars of rice achieve varied maximum leaf net photosynthesis during its vegeta-tive phase: 19–32mmol m−2s−1(n=50; Kawamitsu and Agata, 1987), and 38–40mmol m−2s−1 (n =2; Peng et al., 1995). When calculations were done replacing Amax of 34mmol m−2s−1 in Eq. (1b) by 25mmol m−2s−1, the average RUE and CUE for transplanted canopies (n = 9) were found to be, re-spectively, 17 mmol mol−1 and 0.58 mol mol−1 for incident irradiance of 30 mol m−2 per day at Los Banos. This calculated RUE is 6% higher than the estimated value rather than 19% (Table 3). However, these average RUE and CUE for incident irradiance
of 37 mol m−2 per day at Los Banos were found to be, respectively, 15 mmol mol−1and 0.59 mol mol−1, and this RUE is 17% lower than the estimated value, rather than 0% (Table 3). These comparisons strongly suggest that a knowledge of Amax (or the maximum
leaf nitrogen content for a specific variety, if Eqs. (1a) and (11) are assumed to describe also the variability of Amax among cultivars) is highly desirable for a
better quantitative understanding of RUE of rice.
4.3.3. Stand characteristics
There are uncertainties in the input stand character-istics (Table 1) because of inaccuracies in the reported data and synthesis of data from different sources. For example, Daughtry and Hollinger (1984) found the co-efficient of variation of the foliage biomass and spe-cific leaf area to be, respectively, about 18 and 5% in the vegetative phase based on measurements on 20 plants selected randomly from uniform plots. They also noted that the natural variability of leaf area per plant may exceed 10% of the mean in an uniform field. Determining Lo from separate sources for
fo-liage biomass and specific leaf weight introduces un-certainty in Lo.
The effect of uncertainties in Loand nitrogen
con-tent of foliage, stem and roots on RUE and CUE of Maize at Elora for the incident irradiance of 40 mol m−2 per day is given in Table 4. It is seen that increases (decreases) in the nitrogen content de-creases (inde-creases) the CUE due to increase (decrease) in maintenance respiration. Increasing Lo by 25%
is seen to decrease RUE by 3%, and such an effect
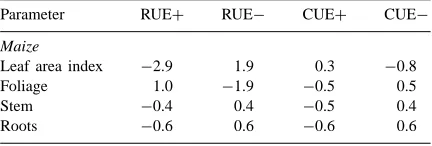
Table 4
Percent change in RUE and CUE of maize (n=24) at Elora when the incident irradiance is 40 mol m−2 per day due to uncertainties
in the input stand parameters. The results given are the effect of either increasing (RUE+and CUE+) or decreasing (RUE−and CUE−) leaf area index by 25%, nitrogen content of foliage and stem by 15%, and of roots by 35%. A positive value for percent change appears when the effect of changing a specific parameter resulted in an increase of RUE or CUE with respect to the base values given in Table 2
appeared because, while canopy gross photosynthesis increased by 4%, RUEgdecreased by 3% (i.e., IPAR
increased more than gross photosynthesis). And, because of increase in gross photosynthesis, CUE increased by 0.3% (Eq. (9)). Increasing the foliage nitrogen content by 15% is seen to decrease CUE by 0.5%, but RUE increases by 1%. Such an effect appeared because, while canopy gross photosynthesis (and RUEg) increased by 1.6% as a result of increases
in the leaf photosynthesis (Eq. (2a)), this increase was insufficient to negate the increase in maintenance respiration. And, as a result, the CUE decreased. An increase (decrease) in the nitrogen content will de-crease (inde-crease) CUE, which get directly reflected in the RUE (Table 4). The effect of changing Lo or
foliage nitrogen content on RUE or CUE is somewhat complex, as noted above. Nevertheless, the results in Table 4 suggest that limited uncertainties in the stand characteristics affect RUE or CUE generally by a few percent.
5. Summary and conclusions
A previously developed model for RUE for gross photosynthesis and net carbon accumulation by wheat, with some improvement, was used to calculate RUE for net carbon accumulation and CUE of maize, sorghum, and rice during their vegetative phase under unstressed conditions. The objective was to assess the applicability of the model to the three crops which are grown under substantially different environmental conditions than those for wheat. Also, while rice is a C3crop like wheat, maize and sorghum are C4crops.
Comparison of the calculated RUE with those es-timated from observations (five for maize, two for sorghum and three for rice) gave differences of−24% to +19%, while the average of all values (n = 10) differed by −4% (underestimation) without calibrat-ing or adjustcalibrat-ing any model parameter. The present cal-culations, consistent with observations, showed that the average RUE of sorghum is about 20% lower than that for maize. The average observable maximum RUE for maize and sorghum was found to be, respec-tively, about 30 and 28 mmol mol−1 at a temperate location, while these values were, respectively, about 28 and 26 mmol mol−1at a tropical location. Consid-erable room appears to exist for improving over the
presently observed RUE of sorghum. Sensitivity anal-ysis showed that variations in Amax among cultivars
around the mean maximum value can cause ca. 3% variation in RUE for maize, but ca. 20% variation in RUE for sorghum. Substantial variability in RUE of rice was also found due to varietal differences in Amax.
The calculated CUE values were generally consistent with the reported values. Sensitivity analysis showed that CUE is less sensitive to changes in the maximum rate of leaf photosynthesis than RUE. Limited uncer-tainties in the input canopy parameters (leaf area in-dex, and nitrogen content of foliage, stem and roots), which could arise from errors in the measurements or synthesis of data from different sources, were found to affect RUE or CUE by a few percent.
References
Andrade, F.H., Uhart, S.A., Arguissain, G.G., Ruiz, R.A., 1992. Radiation use efficiency of maize grown in a cool area. Field Crops Res. 28, 345–354.
Andrade, F.H., Uhart, S.A., Cirilo, A., 1993. Temperature affects radiation use efficiency in maize. Field Crops Res. 32, 17–25. Choudhury, B.J., 2000. A sensitivity analysis of the radiation use efficiency for gross photosynthesis and net carbon accumulation by wheat. Agric. For. Meteorol. 101, 217–234.
Cock, J.H., Yoshida, S., 1973. Photosynthesis, crop growth, and respiration of a tall and short rice varieties. Soil Sci. Plant Nutr. 19, 53–59.
Daughtry, C.S.T., Hollinger, S.E., 1984. Costs of measuring leaf area index of corn. Agron. J. 76, 836–841.
Hirota, O., Takeda, T., 1978. Studies on utilization of solar radiation by crop stands. III. Relationships between conversion efficiency of solar radiation energy and respiration of construction and maintenance in rice and soybean plant populations. Jpn. J. Crop Sci. 47, 336–343.
Horie, T., Sakuratani, T., 1985. Studies on crop–weather relationship model in rice. I. Relation between absorbed solar radiation by the crop and the dry matter production. J. Agric. Meteorol. (Japan) 40, 331–342.
Kawamitsu, Y., Agata, W., 1987. Varietal differences in photosynthetic rate, transpiration rate and leaf conductance of leaves of rice plants. Jpn. J. Crop Sci. 56, 563–570. Kidambi, S.P., Krieg, D.R., Rosenow, D.T., 1990. Genetic variation
for gas exchange rates in grain sorghum. Plant Physiol. 92, 1211–1214.
Kiniry, J.R., 1994. Radiation-use efficiency and grain yield of maize competing with johnsongrass. Agron. J. 86, 554–557. Kiniry, J.R., Jones, C.A., O’Tool, J.C., Blanchet, R., Cabelguenne,
Koshkin, E.I., Motorina, M.V., Tret’yakov, N.N., 1987. Respiration and productivity of corn under conditions of different radiation regimes. Soviet Plant Physiol. 34, 220–228.
Lafitte, H.R., Loomis, R.S., 1988. Calculation of growth yield, growth respiration and heat content of grain sorghum from elemental and proximal analyses. Ann. Bot. 62, 353–361. Loomis, R.S., Amthor, J.S., 1999. Yield potential, plant
assimilatory capacity, and metabolic efficiencies. Crop Sci. 39, 1584–1596.
Louwerse, W., Sibma, L., van Kleef, J., 1990. Crop photosynthesis, respiration and dry matter production of maize. Neth. J. Agric. Sci. 38, 95–108.
McCree, K.J., 1988. Sensitivity of sorghum grain yield to ontogenic changes in respiration coefficient. Crop Sci. 28, 114– 120.
Muchow, R.C., Coates, D.B., 1986. An analysis of the environmental limitation to yield of irrigated grain sorghum during the dry season in tropical Australia using radiation interception model. Aust. J. Agric. Res. 37, 135–148. Muchow, R.C., Sinclair, T.R., 1994. Nitrogen response of
leaf photosynthesis and canopy radiation use efficiency in field-grown maize and sorghum. Crop Sci. 34, 721–727. Peng, S., Cassman, K.G., Kroff, M.J., 1995. Relationship between
leaf photosynthesis and nitrogen content of field-grown rice in tropics. Crop Sci. 35, 1627–1630.
Sinclair, T.R., Horie, T., 1989. Leaf nitrogen, photosynthesis, and crop radiation use efficiency: a review. Crop Sci. 29, 90–98. Sinclair, T.R., Muchow, R.C., 1999. Radiation use efficiency. Adv.
Agron. 65, 215–265.
Sivakumar, M.V.K., Huda, A.K.S., 1985. Solar energy utilization by tropical sorghums. Agric. For. Meteorol. 35, 47–57. Tanaka, A., Yamaguchi, J., 1968. The growth efficiency in relation
to the growth of the rice plant. Soil Sci. Plant Nutr. 14, 110– 116.
Tollenaar, M., Bruulsema, T.W., 1988. Efficiency of maize dry matter production during periods of complete leaf area expansion. Agron. J. 80, 580–585.
Uhart, S.A., Andrade, F.H., 1995. Nitrogen deficiency in maize. I. Effects of crop growth, development, dry matter partitioning, and kernel set. Crop Sci. 35, 1376–1383.
Westgate, M.E., Forcella, F., Reicosky, D.C., Somsen, J., 1997. Rapid canopy closure for maize production in the northern US corn belt: radiation-use efficiency and grain yield. Field Crops Res. 49, 249–258.
Wilson, D.R., van Bavel, C.H.M., McCree, K.J., 1980. Carbon balance of water-deficient grain sorghum plants. Crop Sci. 20, 153–159.