accredited by DGHE (DIKTI), Decree No: 51/Dikti/Kep/2010 347
Power Quality Signal De-noising with Sub band
Adaptive Algorithm
Yingjun Sang1, 3, Yuanyuan Fan2 1
Faculty of Electronic and Electrical Engineering, Huaiyin Institute of Technology, Huaian 223003, China 2Faculty of Mathematics and Physics, Huaiyin Institute of Technology, Huaian 223003, China
3
Electrical Engineering School, Southeast University, Nanjing 210096, China e-mail: [email protected]
Abstrak
Paper ini mengenalkan suatu algoritma pengurangan derau sub-band berbasis transformasi wavelet yang bersifat level-dependent untuk meningkatkan efek dari power quality signal de-noising untuk sistem monitoring power quality. Algoritma ambang ini memiliki dua parameter yang dapat disesuaikan untuk mengatur ambang baik secara halus maupun secara kasar, parameter yang optimal ditentukan dengan algoritma jaringan saraf tiruan perambatan balik. Data gangguan daya merujuk pada data gangguan daya aktual yang terdapat pada IEEE open source dan diaplikasikan untuk pengujian. Hasil pengujian menunjukkan bahwa algoritma yang diusulkan, mampu menghilangkan berbagai jenis gangguan daya secara efektif serta mampu memperbaiki rasio sinyal dengan nilai mean square error yang lebih kecil.
Keywords:gangguan daya, transformasi wavelet, penghialangan derau nilai ambang, algoritma adaptif sub-band
Abstract
A new level-dependent sub band adaptive noise reduction algorithm based on wavelet transform is proposed in order to improve the effect of power quality signal de-noising for power quality monitoring system. This threshold algorithm has two adjustable parameters to adjust the threshold both fine and coarsely, and the optimal parameters are determined by BP neural networks algorithm. Power disturbance data is referred to actual power disturbance data at IEEE open source and applied for test. The test results indicate that the proposed algorithm could denoise the different kind of power disturbances effectively, and the signal noise ratio is improved further with a smaller mean square error.
Keywords: power disturbances, wavelet transformation, threshold value de-noising, sub-band adaptive algorithm.
1. Introduction
Electric power quality issues have captured increasing attention in recent years in electric engineering, with increasing use of solid state switching devices, nonlinear load switching, rectifiers, inverters, and improper load balance. Thus, power quality monitoring has gained tremendous importance in the power industry and would be an effective means for providing customer services.
In practice, the electric signal is often corrupted by noise, which not only degrades the detection capability of power quality monitoring (PQM) systems, but also degrades the features extracted for the classification of disturbances. Various transformation methods have been proposed for detecting and analyzing the PQ events [1]-[3]. The discrete wavelet transform (DWT) method has been proved an effective tool for the transient PQ signals.
algorithm and how to select the suitable threshold do still the problems need to be resolved. A new level-dependent sub band adaptive algorithm is proposed in this article which is useful to fix the suitable threshold with two adjustable parameters. The experimental results show a plausible improvement in de-noising performance in comparison with other three similar approaches.
This paper is organized as follows. Section 2 is a brief review of discrete wavelet transform theory. In section 3, the wavelet de-noising method is particularly described. Section 4 evaluates the effects of the proposed algorithm. Finally, the conclusion of present work is given in Section 5.
2. Discrete Wavelet Transform
Discrete wavelet transform was developed by Mallat from fast algorithm based on the conjugate quadratic filters (CQF) [14][15], J-level wavelet decomposition can be computed as equation (1) and (2).
(1)
(2)
Where , are scale and wavelet coefficients derived from the projection of the signal on the space of scale and wavelet functions respectively.hn andgn are the low-pass and high-pass filters respectively. The reconstruction algorithm is shown as equation (3).
(3)
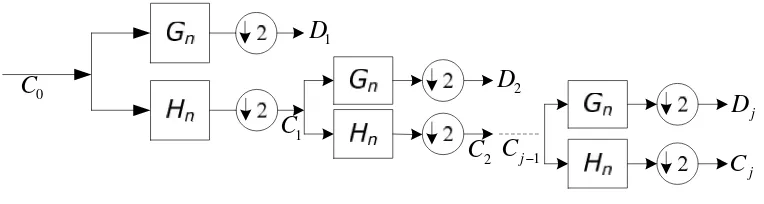
The discrete wavelet decomposition is shown as Figure 1, and the reconstruction is an inverse transformation. WhereCi is called the approximation at level i andDi is called the detail at level i.
1
D
1
C
0
C
2
C
2
D
j
D
j
C
1
j
C
Figure 1. Schematic diagram of DWT
3. Wavelet De-Noising for PQM
DWT-based PQM is an effective means to detect the transient power disturbances, such as voltage sag, swell, oscillation, pulse. In literature wavelet singularity detection was used for multi-resolution analysis of transient power quality disturbance signals, and got the accurate disturbance position information in time domain. Literature described the use of perturbation detection method with 3 kinds of Daubechies wavelet, and pointed that Daub4 wavelet is suitable for detecting short-term abrupt phenomena. Scale and wavelet function filter coefficients are shown as Table 1, with choosing Daub4 wavelet as mother wavelet.
, 2 1,
j k n k j n
n
c
h
c
, 2 1,
j k n k j n
n
d
g
c
,
j k
c
d
j k,1, 2 , 2 ,
,
,
1, ,1
j k k n j n k n j n
n
Table 1. Filter coefficients of Scale and wavelet function
3.1. Wavelet De-Noising Scheme
Signals obtained from any system are never a prefect reflection of the actual measurement. Rather, signals are always corrupted by noise introduced by the device itself, or by other means. Therefore, an observed signal is a combination of actual signal and noise, as equation (4),
(4)
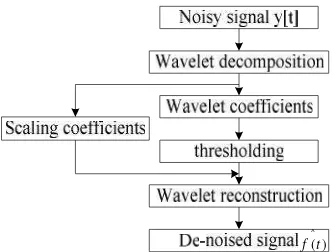
Where is the standard Gaussian white noise, is the noise level coefficient, is original pure signal, noise reduction course could be described as follows, and the procedure shown in Figure2.
a. Carry out wavelet decomposition using the noisy signal, and the signal scale and wavelet coefficients are obtained. Wavelet coefficients can be expressed as equation (5),
(5)
b. Select the appropriate threshold and thresholding the wavelet coefficients. The estimated
coefficient series can be gotten by setting the wavelet coefficients values below the threshold to zero.
c. Reconstruct the de-noised signal with the scale coefficients and the wavelet coefficients processed by step b, computed as equation (6),
(6)
^ ( )
f t
Figure 2. Flow chart of Wavelet de-noising
3.2. Wavelet De-Noising Threshold Algorithm
The key of wavelet de-noising is thresholding. Hard and soft threshold algorithm introduced by Donoho and Johnstone are the common used thresholding algorithms, shown in
1
h h2 h3 h4
(1 3) / 4 2 (3 3) / 4 2 (3 3) / 4 2 (1 3) / 4 2
1
g g2 g3 g4
(1 3) / 4 2 ( 3 3) / 4 2 (3 3) / 4 2 (1 3) / 4 2
( ) ( ) ( ) y t f t αε t
( )
t
ε
α
f t
( )
( )
( )
( )
d
Wy t
Wf t
α ε
W
t
^
d
^ ^
1
( )
Figure 1, where , is the universal threshold, N is the observation data length, is the noise standard deviation estimate, and the threshold is changed with the data length N.
The hard threshold function is not a continuous function, and thus the signal reconstruction process will appear oscillations, the soft threshold function is continuous, but
when , which is a constant deviation and can impact the estimated degree of signal reconstruction, it results in the loss of useful information, and brings a great distortion of reconstructed signal.
(7)
(8)
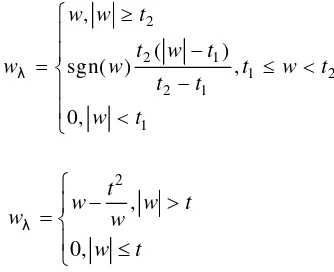
Gao and Bruce proposed firm threshold algorithm and garrote algorithm balancing the
soft and hard threshold algorithm. Garrote threshold algorithm has only a threshold , which is more convenient in actual application. The threshold functions are shown as equation (9) and (10).
(9)
(10)
3.3. Sub band Adaptive Threshold Selection
There are many formulas for obtaining threshold value, including global threshold which is a constant threshold at all the decomposition levels. According to the analysis of Lipschiz exponent, we know that the amplitude of signal and noise coefficients show different representation with the decomposition level increasing. The noise coefficients show a gradually decreasing trend, while the signal coefficients increase gradually or remain unchanged [16-18]. The nonlinear threshold function raised recent years is one of the common changeable threshold functions, which is shown in Figure 3.
This article presents a new sub band adaptive de-noising algorithm based on wavelet decomposition level. The thresholds are determined by two adjustable parameters, and the appropriate threshold is gotten by the optimization algorithm. The sub band adaptive algorithm is described as equation (11).
, , (11)
^
2 lo g ( )
t σ N σ^
w
t
,
0,
w w
t
w
w
t
λ
sgn( )(
),
0,
w w t w
t
w
w
t
λ
1t
2 2 1 1 2 2 1 1,
(
)
sgn( )
,
0,
w w
t
t
w
t
w
w
t
w
t
t
t
w
t
λ
2,
0,
t
w
w
t
w
w
w
t
λ
2 , 0, tw w t
w w w t λ , 2log( ) L K N t S n σ /( ) , 2
mL mL K L K
Where the is level dependent function, L is the amount of wavelet decomposition level, and K is the current level number where the threshold is calculated (for example, 5 levels wavelet transform, L = 5, K = 1, 2, 3, 4, 5). A fine-tuning factor m is used to adjust the threshold function changing ratio from low to high decomposition level, with the range ; a coarse-tuning factor n is used to adjust the whole range of thresholds. The noise standard deviation is estimated by the median estimator as equation (12).
(12)
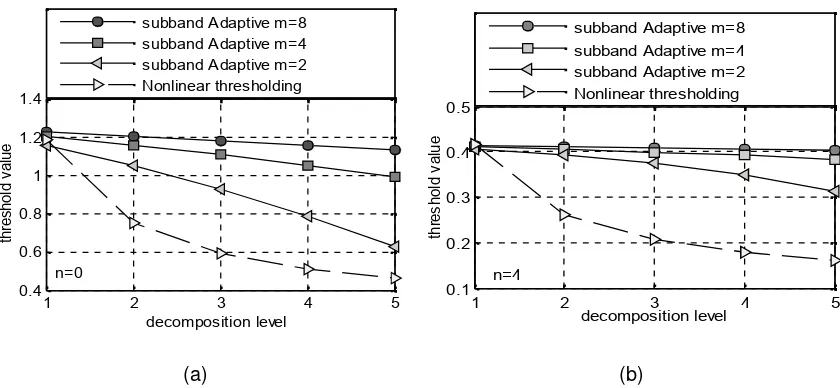
The function is shown in Figure 3, we can see that the difference of threshold between the different level becomes small with the value of m increasing, and the threshold curve becomes a horizontal line when . It is also shown that the whole threshold range is different in different value of n. Sub band adaptive threshold is adjustable and gradual compared with the nonlinear threshold function.
(a) (b)
Figure 3. Threshold based on the decomposition level (a threshold with n=0, b threshold with n=4)
3.4. Optimization of Threshold Function
The selection of parameters m and n is the key to determine the threshold, and they are obtained by neural network training based on the error back-propagation algorithm [19].
The [2 10 2] single hidden layer neural network is selected, which adopts tansig and purelin function respectively in hidden layer and output layer, with the signal to noise ratio (SNR) and mean square error (MSE) as input data, adjustable parameters m and n as output data. (0.5 * rands) function is used to initialize the weights in the network initialization, and the training target error is selected as 0.05, maximum training times as 5000. The optimal parameters of the threshold function in different noise coefficients are shown in Table 2.
Table 2. Optimal parameters of the threshold function at different noise coefficient
0.025 0.05 0.075 0.1 0.125 0.15
m 2.0145 2.4552 3.3046 3.9822 4.1938 4.3065
n 31.2502 17.9518 9.0762 4.2249 2.9071 2.5102
,
L K
S
1
m
^
0.6745 median x
σ
m
1 2 3 4 5
0.4 0.6 0.8 1 1.2 1.4
decomposition level
th
re
s
h
o
ld
v
a
lu
e
n=0
subband Adaptive m=8 subband Adaptive m=4 subband Adaptive m=2 Nonlinear thresholding
1 2 3 4 5
0.1 0.2 0.3 0.4 0.5
decomposition level
th
re
s
h
o
ld
v
a
lu
e
n=4
subband Adaptive m=8 subband Adaptive m=4 subband Adaptive m=2 Nonlinear thresholding
4. Experiments and Analysis
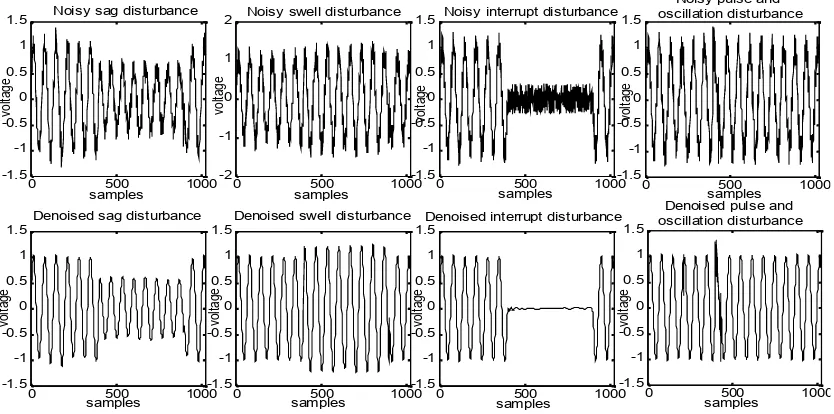
To test the effectiveness of the proposed scheme more realistically, actual power line disturbance data have also been considered. For this, actual power disturbance data (available at IEEE open source) is referred. Using this algorithm taken from recorded wave power system voltage sag, temporary rise, break, vibration and pulse signal de-noising effect is shown in Figure 6. After the parameters of threshold function are determined, the threshold results in different noise level are calculated and shown in Table 3.
Figure 6. De-noised sag, swell, interrupt, pulse and oscillation signals.
Table 3. Threshold of sub band adaptive algorithm in different noise level
α Decomposition Level
1 2 3 4 5
.025 0.0844 0.0841 0.0839 0.0836 0.0833
0.050 0.1408 0.1402 0.1396 0.1387 0.1378
0.075 0.2459 0.2440 0.2419 0.2394 0.2365
0.100 0.4452 0.4392 0.4324 0.4246 0.4157
0.125 0.5523 0.5429 0.5324 0.5205 0.5069
0.150 0.6148 0.6034 0.5908 0.5764 0.5602
The purpose of signal de-noising is to minimize the difference between de-noised signal and the ideal signal, which is usually measured with two indicator functions value, the signal noise ratio (SNR) and the mean square error (MSE), SNR and MSE is determined as equation (13) and (14).
(13)
0 500 1000 -1.5 -1 -0.5 0 0.5 1 1.5 samples vo lta ge
Noisy sag disturbance
0 500 1000 -2 -1 0 1 2 samples vo lta ge
Noisy swell disturbance
0 500 1000 -1.5 -1 -0.5 0 0.5 1 1.5 samples vo lta ge
Noisy interrupt disturbance
0 500 1000 -1.5 -1 -0.5 0 0.5 1 1.5 samples vo lta ge
Noisy pulse and oscillation disturbance
0 500 1000 -1.5 -1 -0.5 0 0.5 1 1.5 samples vo lta ge
Denoised sag disturbance
0 500 1000 -1.5 -1 -0.5 0 0.5 1 1.5 samples vo lta ge
Denoised swell disturbance
0 500 1000 -1.5 -1 -0.5 0 0.5 1 1.5 samples vo lta ge
Denoised interrupt disturbance
0 500 1000 -1.5 -1 -0.5 0 0.5 1 1.5 samples vo lta ge
Denoised pulse and oscillation disturbance 2 0 2 ^ 0 ( ) 10 lg ( ) ( ) N i N i f i SNR
f i f i
(14)
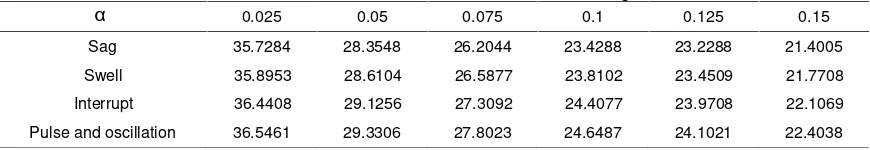
Where is the reconstruction signal amplitude at the point i, and is the original pure signal amplitude at the point i, N is the length of sample data. The SNR and MSE values of the different voltage signals de-noised by the proposed algorithm under different noise level are shown in Table 4 and Table 5. The SNR and MSE values of the voltage sag signal de-noised by the four threshold algorithms under different noise level are showed in Table 6 and Table 7. We can see, the SNR values from the proposed algorithm are larger than other algorithms with the MSE values are smaller.
Table 4. SNR value of the different de-noised signals
0.025 0.05 0.075 0.1 0.125 0.15
Sag 35.7284 28.3548 26.2044 23.4288 23.2288 21.4005
Swell 35.8953 28.6104 26.5877 23.8102 23.4509 21.7708
Interrupt 36.4408 29.1256 27.3092 24.4077 23.9708 22.1069
Pulse and oscillation 36.5461 29.3306 27.8023 24.6487 24.1021 22.4038
Table 5. MSE value of the different de-noised signals
0.025 0.05 0.075 0.1 0.125 0.15
Sag 9.2590e-005 5.0573e-004 8.2978e-004 0.0016 0.0016 0.0025
Swell 9.1890e-005 4.9105e-004 8.0912e-004 0.0015 0.0016 0.0024
Interrupt 9.0085e-005 4.8532e-004 7.9470e-004 0.0014 0.0015 0.0022
Pulse and oscillation 8.9804e-005 4.8273e-004 7.8163e-004 0.0014 0.0015 0.0022
Table 6. SNR value comparison of the de-noised sag signal
0.025 0.05 0.075 0.1 0.125 0.15
Heuristics Sure 31.8966 26.9829 23.5303 21.3395 20.0564 18.5978
Nonlinear Threshold 31.5362 27.3125 24.2015 22.1105 21.4160 19.9478
Penalize Medium 35.2434 27.7747 25.6355 22.9544 22.3613 20.6725
Sub band Adaptive 35.7284 28.3548 26.2044 23.4288 23.2288 21.4005
Table 7. MSE value comparison of the de-noised sag signal
0.025 0.05 0.075 0.1 0.125 0.15
Heuristics Sure 2.2374e-004 6.9360e-004 0.0015 0.0025 0.0034 0.0048
Nonlinear Threshold 2.3762e-004 6.4971e-004 0.0012 0.0021 0.0027 0.0042
Penalize Medium 1.0353e-004 5.7801e-004 9.4592e-004 0.0018 0.0020 0.0030
Sub band Adaptive 9.2590e-005 5.0573e-004 8.2978e-004 0.0016 0.0016 0.0025
5. Conclusion
In this paper, a new level-dependent sub band adaptive threshold algorithm based on wavelet transform is proposed. This threshold algorithm has two adjustable parameters to adjust the threshold both fine and coarsely, and the optimal parameters are determined by BP neural networks algorithm. The de-noising performance is evaluated with actual power disturbance
2 ^
0
( ) ( ) N
i
f i f i MSE
N
^
( )
f i
f i
( )
α
α
α
data, and the results prove the validity of the proposed algorithm for voltage disturbance signals de-noising. The signal noise ratio of voltage sag signal de-noised by the proposed algorithm is further improved, and the reconstruction error is smaller compared with three similar algorithms.
Acknowledgments
The work was supported in part by Science Research Foundation of Huaiyin Institute of Technology (HGC1103).
References
[1] CT Hsieh, SJ Huang, CL Huang. Data reduction of power quality disturbances—a wavelet transform approach,Electr Power Syst. Res.1998; 47:79-86.
[2] SA Yilmaz, A Subasi, M Bayrak, et al., Application of lifting based wavelet transforms to characterize power quality events,Energy Convers Manage. 2007; 48:112-123.
[3] S Santaso, WM Grady, and EJ Powers. Characterization of distribution power quality events with Fourier and wavelet transforms. IEEE Trans Power Delivery.2000; 15: 247-254.
[4] UD Dwivedi, SN Singh. Denoising techniques with change-point approach for wavelet-based power-quality monitoring,IEEE Trans Power Delivery.2009; 24:1719-1727.
[5] O Poisson, P Rioual, M Meunier. Detection and measurement of power quality disturbance using wavelet transform,IEEE Trans Power Delivery.2000; 15: 1039-1044.
[6] S Chen, HY Zhu. Wavelet transform for processing power quality disturbances.Eurasip J Adv Signal Process. 2007: 176-196.
[7] D Donoho. Denoising by soft-thresholding.IEEE Trans Inf Theory. 1995; 41: 613-617.
[8] H Yang, CC Liao. A de-noising scheme for enhancing wavelet-based power quality monitoring system,IEEE Trans. Power Delivery.2001; 16: 353-360.
[9] Q Zhang, H Liu, Q Lan. Power quality signal denoising based on wavelet hybrid threshold method,
Electric Power Autom Equip.2008; 28: 28-30.
[10] M Zhang, K Li, Y Hu, A high efficient compression method for Power Quality Applications .IEEE Trans Instrum Meas. 2011; 60:1976-1985.
[11] L Zhang, P Bao, Q Pan. Threshold analysis in wavelet-based denoising.Electron Lett.2001; 37:1485-1486.
[12] NSD Brito, BA Souza, EAC Pires.Daubechics Wavelets in Quality of Electrical Power. Proceedings of the 8th International conference on Harmonics and Quality of Power, Greece, Athens. 1998: 14-18. [13] HY Gao, AG Bruce. WaveShrink with firm shrinkage,Statistica Sinica.1997; 7: 855-874.
[14] TY Ji, Z Lu, QH Wu. Detection of power disturbances using morphological gradient wavelet. Signal Process. 2008; 88: 255-267.
[15] CC Liao, HT Yang, HH Chang. Denoising Techniques With a Spatial Noise-Suppression Method for Wavelet-Based Power Quality Monitoring.IEEE Trans Instrum Meas.2011; 60: 1986-1996.
[16] Huang J, Xie J, Li H, Tian G, Chen X. Self-adaptive decomposition level de-noising method based on wavelet transform.TELKOMNIKA,2012; 10(5): 1015-1020.
[17] Z Wang, H Jiang. Robust incipient fault identification of aircraft engine rotor based on wavelet and fraction.Aerospace Science Technology.2010; 14: 221-224.
[18] S Poornachandra. Wavelet-based de-noising using sub-band dependent threshold for ECG signals.
Digital Signal Process. 2008; 18: 49-55.