MANAGING GEOLOGICAL PROFILES IN DATABASES FOR 3D VISUALISATION
A.Jarna a, B.O.Grøtan a, I.H.C. Henderson a, S.Iversen a, E.Khloussy a, B.Nordahl a, B.I.Rindstad a
a
Norges geologiske undersøkelse (Geological Survey of Norway), Leiv Eirikssons vei 39, 7040, Trondheim, Norway
KEY WORDS: 3D geology, DTM, Geological maps, Geophysics, Bedrock geology, 2D geological profiles, WebGL, API, DXF, PostGIS, Norway, georeferencing, cross-sections, open source javascript framework
ABSTRACT: Geology and all geological structures are three-dimensional in space. GIS and databases are common tools used by geologists to interpret and communicate geological data. The NGU (Geological Survey of Norway) is the national institution for the study of bedrock, mineral resources, surficial deposits and groundwater and marine geology. 3D geology is usually described by geological profiles, or vertical sections through a map, where you can look at the rock structure below the surface. The goal is to gradually expand the usability of existing and new geological profiles to make them more available in the retail applications as well as build easier entry and registration of profiles. The project target is to develop the methodology for acquisition of data, modification and use of data and its further presentation on the web by creating a user-interface directly linked to NGU’s webpage. This will allow users to visualise profiles in a 3D model.
1. INTRODUCTION
Geology shown in full dimensionality has a long tradition and is influenced by progress in 3-dimensional (3D) software. There are plenty of solutions for visualising geological data in 3 dimensions like 3D Move, GeoVisionary, GeoModeller and GeoScene3D.
The Geological Survey of Norway (NGU), founded in 1858, is the Norwegian government agency responsible for geologic mapping of Norway's land and marine areas, and for the production and maintenance of national databases and maps and research. GIS techniques were applied to a great extend in order to store, proceed and present a high number of geological observations, analyses and calculations.
Geological mapping of the structures has always been done by geologists and the creation of cross-sections has been undertaken to display and interpret third dimension of the landscape. 2D geological maps are at the time the most important means of interpretation of geology. However, the third dimension of data, provides additional information and reduces the limitation of understanding from 2 dimensional maps.
Advantages of 3D models for better understanding of geology to a large audience are well known (Wijns, Boschetti et al. 2003, Wu, Xu et al. 2005).
Geological data based on all three dimensions provides better insight into the geological conditions, and better understanding of complex geological phenomenon and processes. The interest in 3D modelling in geology is expanding. 3D inversion applied to geological and geophysical data can provide new aspects in defining the geology (Jarna et al. 2015).
In order to create 3D geological models one has to consider available data, complexity, scale and size of the dataset.
Nowadays methods for visualising often imply 3D seismic data, cross-sections or boreholes.
With greater technical possibilities at the present day, the focus on offering geology in 3D to the society has increased. Efforts are being made to coordinating 3D activities at NGU to speed up the development of mapping and methods for 3D geology. In this contribution we present insights into the developing of methodology for acquisition, modification and use of data for its further presentation on the web. This by creating a user-interface linked to NGU's webpage in order to provide easy visualising in 3D space anywhere you are. With use of Three.js, which is a cross-browser JavaScript library/API used to create and display animated 3D computer graphics in a web browser without additional installing of plug-ins, downloading data or using another software to open results.
2. METHODS
2.1 3D Move georeferencing
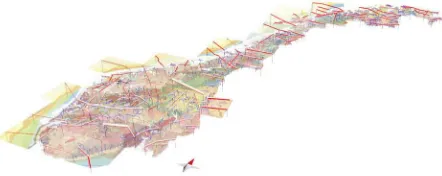
Figure 1: Geological profile coverage in the whole of Norway. In blue are the traces of the 110 250K profiles. In green are the
traces of the 54 950K profiles.
Figure 2: The 50-250K geological profile traces, the 3D georeferenced geological profiles and the surface bedrock data
loaded into 3D MOVE. View from the SE.
2.2 Georeferenced objects exported from 3DMove
A couple of different formats have been evaluated for this purpose. For 3D mesh bodies, DXF seems to do the job. For profiles - the KML export format sounded promising, but did not supply sufficient data. The last resort was to utilize the ASCII export format. From the ASCII export we get X,Y and Z separated by semicolon. But no reference to the actual profile.
DXF is a file extension for a graphic image format typically used with AutoCAD (Computer Assisted Drafting) software. DXF stands for Drawing eXchange Format.
ASCII stands for American Standard Code for Information Interchange. An ASCII file is a plain text file without much formatting other than line breaks.
2.3 FME transformation from 3DMove to loading into PostGIS
Having a table in Postgresql that contains data on bedrock profiles as linestring geometry, our task was to associate each profile to its corresponding upper left and lower right coordinates. These coordinates have to be extracted from a text file (ascii) that contains the coordinates of related georeferenced images. This text file was generated with the help of 3DMove.
The challenge resides in the association of the profiles that we have in the database with the corresponding image coordinates. Once we join each profile to the correct image, it becomes easy to retrieve the elevation values. Finally, we update the database with the extracted upper left and lower right values. This task was implemented and executed in FME (from safe). The different steps are explained in Figure 3.
Figure 3: Steps of joining profiles.
2.4 Rest API
A REST api is being designed for exposing the profiles for use in WebGL-integration. Since the data about the profiles are stored in PostgreSQL with PostGIS geometries, it is easy to make use of PostGIS spatial queries to return profiles of a certain type that is within or intersects an area of interest.
REST (REpresentational State Transfer) is an architectural style consisting of a coordinated set of components and data elements where the focus is on component roles and the interactions between data elements. For us, it was easy to choose REST over SOAP for use in web applications. It is stateless, easy to scale and simple to use by utilizing the standard HTTP methods (such as GET, PUT, POST and DELETE).
2.5 Map WebGL integration and challenges
3D-viewing has been extended as a tool for our new upcoming releases of webmaps. Our webmaps are somewhat complex, meaning they are not simple mashups. We combine base maps from the national mapping authority, then add our thematic maps and in the end we add borders, roads, geonames, waters etc on top.
To use "what you see is what you get" (WYSIWYG) we have a service that combines all these map layers into one static image file. This image file is then draped over a terrain model (10 meter grid) using a Web Coverage Service (WCS) from the national mapping authority.
This WCS can deliver both XYZ and GeoTIFF. XYZ is nice for tiled services and slippy maps. For our use - GeoTIFF is much faster corresponds 100% the extent of the combined map image previously produced.
3. APLICATIONS
3.1 3D-Norge: 3D bedrock map of Norway
This is a project to create a 3D bedrock model over the whole of Norway. At present, there is no 3D bedrock geology model for Norway. Until now, Norway has had a relatively low 3D profile in the Scandinavian countries and in the rest of Europe. The Geological Survey of Norway has acquired 3D MOVEwhich is suitable for modelling regional scale complex geological models. This is seen as a test project to develop the ideas, methodology and workflow to allow the construction of a nationwide 3D model.
3.1.1 Surface bedrock mapping
To create the model, we use several, integrated pre-existing data sources. We use a national 10m DEM, a simplified 1:2M surface bedrock map, both regional and local high and low resolution aeromagnetic surveys, 1:250K and 1:50K geological profiles (Figure 1), available seismic profiles and a national structural data database. A total of 110 250K x-sections in and 549 50K x-sections are used (Figure 1 and Figure 4). In some cases, the 3D mapping of individual structures has been done for the first time and corresponds exactly with offshore seismic data.
Figure 4: Example of the 3D modelling of the geological structures in 3D MOVE. This shows the Lærdal-Gjende-Hardanger Shear Zone (LGHSZ), which for the first time is mapped in 3D over a strike length of over 500km and a dip length of 60km down to the MOHO with the help of offshore
seismic data.
Figure 5: Profile and screenshot from 3D MOVE showing an example of the correspondence of the DEM with a hand drawn
geological profile.
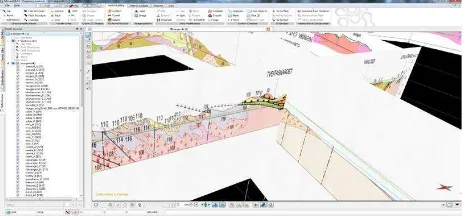
At present data are collected and compiled the basis data that are required to begin construction of the 3D model. This includes, 250k profiles (Figure 5), 50k profiles, 250k surface mapping, the simplified 1:2M tectonostratigraphic. All of the basis data have been entered into the modelling software. Once this is done then the basis data can be used to create 3D shapefiles (line files) and subsequent 3D mesh surfaces of the geology.
3.1.2 Geological Profiles
Geological profiles, both 50K and 250K (Figure 6), constructed for the inclusion in the associated map products, have been manually scanned as separate jpeg files (Figure 7). These have been georeferenced in 3D in 3DMOVE.
Figure 6: Examples of storing bedrock profiles in database.
There is a wide spectrum of quality of the profiles: the 250K profiles tend to be of high quality whereas many of the 50K profiles are poorly constructed and drawn (Figure 8).
Figure 7: 50K from Florø area on west coast of Norway.
Figure 8: Screen dump from 3DMOVE showing two intersecting 250K profiles that mismatch.
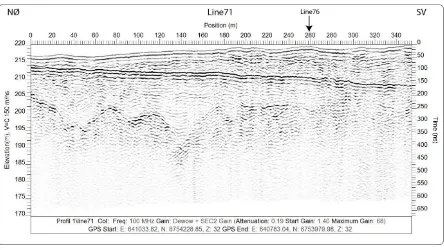
3.2 Ground geophysics profiles
of airborne and shipborne potential field data (gravity and magnetic measurements), as well as access to high-resolution seismic data.
The ground geophysical data for each selected anomaly was compiled in the map form. The magnetic profile data was gridded and presented as a colour background.
Ground geophysics profiles are very useful in order to get proper information about the base. One of the very important uses of these profiles is mapping of the quick clay. Geophysical and geotechnical information can be combined to obtain a good understanding of the ground conditions, giving important input for the stability assessments. Raw data give the apparent resistivity of the subsurface. This represents a weighted mean of all the resistivity values that fall within the influenced volume. To get specific resistivity data are inverted and a modelled pseudo section is produced that matches the measured data (Figure 9 and 10).
Figure 9: Intersecting profiles is very useful and give information on 3D geology. Example shows Rissa (Sør-Trøndelag, Norway): 17 profiles compose a network (~ 1 km2) of 2D resistivity data in an area with known stability challenges
(Solberg).
Figure 10: Example of profiles for ground geophysics.
3.3 WebGL facilitates accessibility of 3D geology
The WebGL (Web Graphics Library) is a JavaScript API is a cross-platform for rendering interactive 3D and 2D graphics within a compatible web browser without the use of plug-ins. It runs in the HTML5 Canvas element and has full integration with all Document Object Model (DOM) interfaces, which
means that it can be used from any DOM-compatible language like JavaScript. WebGL is based on OpenGL and the advantage of WebGL it runs directly in used browser. The advantage of the system is the ability to create 3D visualisations of imported data. There are clipspace coordinates and colours that are most important for proper functionality of WebGL.
3.3.1 Open Source JavaScript frameworks
Several Open Source JavaScript frameworks have been developed such as theejs (Three.js 2015), Cesium (AGI 2015). Cesium is supposed to be a coupled part of the OpenLayers3 (OpenLayers 3 2015) JavaScript framework, which is the key framework in NGU's map applications. Inspired by an implementation of threejs at the Norwegian Mapping Authority (Kartverket 2015), was started our own implementation in threejs for geological maps and geological profiles (Iversen 2015). The implementation needs 3 important components. The first of all is a composite map image or a static image. An elevation grid is delivered by a WCS provided by the Norwegian Mapping Authority (Open Geospatial Consortium 2015), The WCS delivers Geotiff or XYZ with elevation data, where Geotiff is compact and easily transferred. Second is a TIN model which is generated from the elevation grid. And as last the map image is draped on the TINs surface which ends up as an interactive “Scene” (Figure 11, 12 and 13).
3.3.2 Customisations and methods:
• The Model (canvas) always adapts to the window size, is responsive.
• The pivot point in the model is adjusted to the computed average height for making it easier to tilt. • Heights must be exaggerated in maps covering larger
areas same as in areas with smaller height differences. • 8x8 pixels in the map image represents standard
height cell.
• The number of pixels pr height cell for large scale maps (small areas) has to be increased to match the actual height resolution. Maximum is 10m and it leads to removing of stairs effect.
Figure 12: Bedrock N50 (Salten, Nordland).
3.3.3 Visualising of Geological Profiles
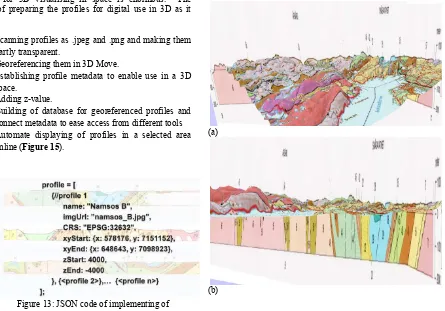
Plenty of geological profiles were produced in numerous maps over the years at the Geological Survey of Norway (Figure 14). The value for 3D visualising in space is enormous. The workflow of preparing the profiles for digital use in 3D as it follows:
1. Scanning profiles as .jpeg and .png and making them partly transparent.
2. Georeferencing them in 3D Move.
3. Establishing profile metadata to enable use in a 3D space.
4. Adding z-value.
5. Building of database for georeferenced profiles and connect metadata to ease access from different tools 6. Automate displaying of profiles in a selected area
online (Figure 15).
Figure 13: JSON code of implementing of visualisation of profile- Namsos B, (Nord-Trøndelag,
Norway).
Figure 14: Bedrock mapof Asker (south Norway) with geological profiles.
(a)
(b)
Figure 15: A geological profile projected into 3D space: (a) the view from above (top), (b) the view under the surface (bottom)
4. CONCLUDING REMARKS
Umar, Yelwa et al. 2016). For instance BGS (British Geological Survey) offer free 3D geological model for the United Kingdom available for download as 3D PDF, 3D Shapefiles, KML (BGS 2016).
Conventional 2D geological maps are useful. They present, for example, the rocks found at the surface and include some cross sections as representation of a slice through the earth's crust. That helps to show the relationship of the different rock layers in the ground at depth. By providing the possibility of seeing this in another dimension, this allows the users to better visualise the subsurface at county, without the need of download or installation of any additional software.
Three-dimensional geological modelling and mapping is hence becoming more popular, and an easier way to understand techniques of portraying geological data. 3D interpretation of geological information can help imagine geological conditions in space, increase interest in geology, and understand problems that are often of high complexity (Price, Terrington et al. 2016).
In this work, we presented the different tools for 3D visualisation that are currently implemented and are in use in various projects at NGU, as well as some preliminary results of creating geological profiles and making them available on the web to the end user. This has been accomplished by creating a user-interface that is linked to NGU's webmaps. The main objective was to highlight the results that may be achieved with the help of these tools and how this can contribute to a deeper understanding and more accurate analysis of the geological data known for its complexity.
Our approach of presenting geological profiles is quite innovative. At the localities where the profiles were drawn (about 160 000 profiles all over Norway), the user can get a drawing of a 3D map with geological profile under the surface. This allows easy visualisation in 3D space on various platforms, namely mobile phone, tablet and desktop. Using Three.js, a cross-browser JavaScript library/API enabling WebGL, we are able to create and display animated 3D computer graphics in a web browser.
For desktop, we can use the profiles as they are - but for smart phones, there is a certain limitation and images over 4000 pixels are shown as plain black images. Therefore it is important to make mobile-friendly editions of these profiles. For better integration in WebGL - these profiles also need to set an alpha channel where a portion of each pixel is reserved for information about transparency.
There are various aspects of 3D representation of geological models depending on the data usage: base map, stratigraphic schemes, geophysics, seismic profiles, nationwide dip and strike, data scales or resolutions of models.
The Geological Survey of Norway aims to facilitate the standardisation, systematisation, management of the 3D data, and has begun to assess the possibilities for a web-based user interface. Managing geological profiles in databases for 3D visualisation will be part of a three-year "Subsurface programme" which will be launched at NGU by the end of the year 2016.
REFERENCES
A. Jarna, A. Bang-Kittilsen, C. Haase, I. H. C. Henderson, F. Høgaas, S. Iversen, and A. Seither
Int. Arch. Photogramm. Remote Sens. Spatial Inf. Sci., XL-2/W4, 11-16, doi:10.5194/isprsarchives-XL-2-W4-11-2015, 2015
AGI, 2015-last update, Celsium. Available: http://cesiumjs.org/ [04, 2016].
BGS, UK3D — 3D geological model for the United Kingdom. Available:
http://www.bgs.ac.uk/research/ukgeology/nationalGeologicalM odel/GB3D.html[08/20, 2016].
GEOTEST.NGU.NO 2016-last update, 3D profile examples. Available:
http://geotest.ngu.no/kart/webgl/wxs.three-profile2.html?WIDTH=1028&HEIGHT=942&BBOX=295392. 13836159,7093561.5478055,363342.08214963,7155826.96322 21&IMAGE=img/BerggrunnNamsos.png&zMult=6.5 [05, 2016].
IVERSEN, S., 2015-last update, Sverre-Iversen/wxs.threejs. Available: https://github.com/Sverre-Iversen/wxs.threejs [04, 2016].
KARTVERKET, 07, 2015-last update, WCS i threejs. Available: http://labs.kartverket.no/wcs-i-threejs/ [07, 2015].
MATHERS, S. and FORD, J., 2014. Progress towards a national geological model of britain.
OPEN GEOSPATIAL CONSORTIUM, 2015-last update, Web Coverage Service. Available:
http://www.opengeospatial.org/standards/wcs [06, 2015].
OPENLAYERS 3, 2015-last update, OpenLayers 3. Available: http://openlayers.org [05, 2015].
PRICE, S.J., TERRINGTON, R.L., FORD, J.R. and CROFTS, R.G., 2016-last update, A 3D assessment of urban aquifer vulnerability using geological and buried asset models: Knowsley Industrial Park, NW England. Available: http://nora.nerc.ac.uk/4997/1/025.pdf].
SOLBERG, I.L., Experiences with 2D resistivity measurements (ERT) at the surface. Available:
http://www4.databasehuset.no/ngf/wp-content/uploads/2015/03/2D-resistivitet-Inger-Lise-Solberg.pdf [05, 2016].
THREE.JS, 2015-last update, Three.js. Available: http://threejs.org/ [07, 2015].
UMAR, I.M., YELWA, N.A. and JIBRIN, B., 2016. 3D Geological Models in Ground Investigation: Examples from the United Kingdom. Journal of Scientific Research & Report, 9(3): 1-6.
VAN DER MEULEN, M.J., DOORNENBAL, J.C.,
WEBGL, 2015-last update, Main Page. Available:
https://www.khronos.org/webgl/wiki/Main_Page [05, 2015].
WIJNS, C., BOSCHETTI, F. and MORESI, L., 2003. Inverse modelling in geology by interactive evolutionary computation. Journal of Structural Geology, 25(10), pp. 1615-1621.