BUILDING DETECTION USING AERIAL IMAGES AND DIGITAL SURFACE MODELS
Jia Mua, Shiyong Cuib, Peter Reinartzb
aElektronische Fahrwerksysteme GmbH, Dr.-Ludwig-Kraus-Strae 6, 85080 Gaimersheim - (jia.mu.bewerbung)@googlemail.com b
Remote Sensing Technology Institute, German Aerospace Center (DLR), 82234 Wessling, Germany, (shiyong.cui, peter.reinartz)@dlr.de
Commission VI, WG VI/4
KEY WORDS:Building detection, variational inference, logistic regression, Bag-of-Words (BoW), conditional random fields, aerial images, classification
ABSTRACT:
In this paper a method for building detection in aerial images based on variational inference of logistic regression is proposed. It consists of three steps. In order to characterize the appearances of buildings in aerial images, an effective bag-of-Words (BoW) method is applied for feature extraction in the first step. In the second step, a classifier of logistic regression is learned using these local features. The logistic regression can be trained using different methods. In this paper we adopt a fully Bayesian treatment for learning the classifier, which has a number of obvious advantages over other learning methods. Due to the presence of hyper prior in the probabilistic model of logistic regression, approximate inference methods have to be applied for prediction. In order to speed up the inference, a variational inference method based on mean field instead of stochastic approximation such as Markov Chain Monte Carlo is applied. After the prediction, a probabilistic map is obtained. In the third step, a fully connected conditional random field model is formulated and the probabilistic map is used as the data term in the model. A mean field inference is utilized in order to obtain a binary building mask. A benchmark data set consisting of aerial images and digital surfaced model (DSM) released by ISPRS for 2D semantic labeling is used for performance evaluation. The results demonstrate the effectiveness of the proposed method.
1. INTRODUCTION
Building detection from aerial and satellite images has been a main research issue for decades and is of great interest since it plays a key role in building model generation, map updating, ur-ban planning and reconstruction (Davydova et al., 2016). Various methods have been developed and difference data sources such as aerial images, digital surface/eleviation models, LIDAR data, multi-spectral images, synthetic aperture radar images, have been used for building detection. In this section we briefly review rele-vant methods in the literature on building detection. Decades ago the initial endeavor for building detection was relying on group-ing of low level image features such as edge/line segments and/or corners to form building hypotheses (Ok, 2013). For instance, a generic model of the shapes of building was adopted in (Huer-tas and Nevatia, 1988) and shadows cast by buildings were used to confirm building hypotheses and to estimate their height. A computational techniques for utilizing the relationship between shadows and man-made structures to aid in the automatic extrac-tion of man-made structures from aerial imagery is described in (Irvin and McKeown, 1989). An approach to perceptual grouping for detecting and describing 3-D objects in complex images was proposed in (Mohan and Nevatia, 1989) and was illustrated by ap-plying it to the task of detecting and describing complex buildings in aerial images. The vertical and horizontal lines identified us-ing image orientation information and vanishus-ing point calculation were used in (McGlone and Shufelt, 1994) to constrain the set of possible building hypotheses, and vertical lines are extracted at corners to estimate structure height and permit the generation of three dimensional building models from monocular views. Due to the neglected performance evaluation in building detection, a comprehensive comparative analysis of four building extraction systems was presented in (Shufelt, 1999) and he concluded that none of the developed systems were capable of handling all of
the challenges in building detection. Most of these initial meth-ods rely heavily on the adopted low level features and assumption of a specific type of building hypothesis. However due to the un-certainty in low level features, their performance is not likely to be perfect.
is not designed to detecting building regions instead the patches of a particular size corresponding to building. A novel decision fusion approach to building detection in VHR optical satellite im-ages is proposed in (Senaras et al., 2013). The method combines the detection results of multiple classifiers under a hierarchical architecture, called Fuzzy Stacked Generalization (FSG). How-ever, this method assumes statistical stability of the training and test data. A new approach based on an adaptive fuzzy-genetic al-gorithm was proposed in (Sumer and Turker, 2013) for building detection using high-resolution satellite imagery. This approach combines a hybrid system of evolutionary techniques with a tra-ditional classification method (Fishers linear discriminant) and an adaptive fuzzy logic component. Nevertheless it is by no mean-s determinimean-st that genetic algorithmmean-s can find a global optimum solution.
Methods based on graphical models are quite popular for building detection as well. An MRF model was used in (Krishnamachari and Chellappa, 1996) to group these lines to delineate buildings in aerial images. First straight lines are extracted from images by using an edge detector followed by a line extractor. Then an MRF model is formulated on these extracted lines with a suit-able neighborhood. The probabilistic model is chosen to support the properties of the shapes of buildings. In the end, the energy function associated with the MRF is minimized, resulting in the grouping of lines. However, no quantitative results were provided for evaluation. Similarly, a stochastic image interpretation model, which combines both 2-D and 3-D contextual information of the imaged scene, was proposed in (Katartzis and Sahli, 2008) for the identification of building rooftops. However, the approach is on-ly applicable to building rooftops with low inclination. A graph-based approach was developed in (Kim and Muller, 1999) for building detection. The whole process of building detection is di-vided into four small stages of line extraction, line-relation-graph generation, building hypothesis generation, and building hypoth-esis verification. This method is yet limited to certain building shapes. Another method for building detection based a graphical method was proposed by (Sirmacek and Unsalan, 2009), where the vertices in the graph are SIFT Keypoints. A multiple subgraph matching method was applied to detection individual building by matching graphs corresponding to a template and a test image. Nevertheless this method is applicable only to urban areas with well-separated buildings. A different method based on graphi-cal modeling of buildings was proposed by in (Cui et al., 2012), where the vertices in the graph are the intersections of line seg-ments. The graph was then adapted to the buildings by filtering the edges by considering the region properties. Then all cycles are search by an algorithm and the most probable cycle were considered as the best building candidate. A novel system was developed by (Izadi and Saeedi, 2012) for automatic detection and height estimation of buildings with polygonal shape roofs in singular satellite images and it employs image primitives such as lines, and line intersections, and examines their relationships with each other using a graph-based search to establish a set of rooftop hypotheses. The height of each rooftop hypothesis is estimated using shadows and acquisition geometry.
Another category of methods for building detection is based on active contour model. For example, a method based snake that combines the regional features of an image with context was pro-posed in (Peng and Liu, 2005) using the direction of the cast shadows. However, it is not applicable to complex buildings in urban areas. Similarly a modified ChanVese model based level set method was proposed in (Cao and Yang, 2007) for detect-ing man-made objects in aerial images. A three-stage level set
evolution strategy was used to minimize the proposed model en-ergy with a fractal error and texture edge descriptor. Unfortu-nately the method extracts only the boundaries of the man-made regions instead of the building outlines. A variational framework for building detection was proposed in (Karantzalos and Para-gios, 2009) by an integration of multiple competing shape priors that is pose/affine invariant through an explicit estimation of the transformation. However, this method is limited to prior building shape models. A new model, based on level set formulation, is introduced in (Ahmadi et al., 2010) to detect buildings in aerial images using active contour models. All building boundaries are detected by introducing certain points in the buildings vicinity. However, the number of building and background classes must be precisely known a priori to achieve the best results.
There are still a large number of relevant works to this paper. The above introduction is by no means comprehensive. In this paper, we introduce a method for building detection by classifying the pixels comprising building through a logistic regression classifier that is learned by a Bayesian method. In the following sections, the steps comprising the entire method are presented in detail and the method is evaluated using a benchmark data set consisting of aerial images and digital surfaced model (DSM) released by ISPRS for 2D semantic labeling.
2. METHOD 2.1 Overview of the method
The overview of the proposed method is shown in Figure 1. It consists of three step: Bag-of-Words (BoW) feature extraction, Bayesian learning via variational inference, and pixel labeling via a fully connected CRF model. For the purpose of building char-acterization, an effective bag-of-Words (BoW) method is applied for feature extraction in the first step. After that, a classifier of logistic regression is learned in this feature space via a Bayesian method. Due to the presence of hyper prior in the probabilis-tic model of logisprobabilis-tic regression, approximate inference methods have to be applied for prediction. In order to be fast, a variational inference method based the mean field theory is applied for in-ference. In the end, a fully connected CRF model is applied for labeling the building pixels, where the inference is performed by the mean field method.
2.2 BoW feature extraction
The Bag-of-Words (BoW) method has a large number of suc-cessful applications in various fields. In this paper we follow our previous work (Cui et al., 2015) on BoW method for image classification. The framework of BoW feature extraction is com-posed of four steps as shown in the second column in Figure 1, namely local feature extraction, dictionary learning, feature cod-ing, and feature pooling. Assume we have a data set ofNimages Ii, i= 1, ..., N, the first step is to sample a collection of patch-es from the imagpatch-es in the database. This can be done by dense sampling or sparse detection. The second step is to extract local descriptor vectorsxj
BoW feature extraction Local feature
extraction
Random codebook
Feature coding
Feature pooling
Bayesian learning
Variational inference
Bayesian inference Dense CRF inference Dense CRF
Inference
Input images Output building masks
Figure 1. The workflow of the proposed method for building detection. It consists of three steps: BoW feature extraction, Bayesian learning, and Dense CRF for building pixel labeling.
hard feature assignment or soft assignment. Hard assignment as-signs a single label, i.e., the index of the nearest neighbor in the dictionary, to each local descriptorx. Formally, it is defined as:
vk(x) =
1 ifk= argminikx−dik2
0 otherwise (1)
Thus, the final descriptor representation v = [v1, ..., vK] has only one non-zero element. The last step is to do the sum-pooling1of all local descriptors extracted from one imagevi= sum(vj
i, ...,vji).
This method for image classification can be easily extended and applied to pixel classification that is the goal of this paper. To this purpose, we first extract local features as described in our previ-ous work (Cui et al., 2015). Then we calculate a BoW feature representation of a local neighborhood surrounding each pixel. These BoW feature vectors are considered as the a characteriza-tion of building pixels and used in the next steps for learning a logistic regression.
2.3 Bayesian logistic regression
Logistic regression is a widely used statistical model for the ap-proximation to the underlying functional relation between a fea-ture vectorxand a binary response variabley ∈ {−1,1}. For-mally the probabilistic model is defined as
p(y= 1|x,w) = 1
1 + exp(−wTx) =σ(w T
x) (2)
whereσ(·)is the logistic sigmoid function. wis the model pa-rameters that is going to be inferred by the Bayesian method. Consequently, the probability thaty=−1isp(y=−1|x,w) = 1−p(y= 1|x,w). Thus, the model can be universally written asp(y|x,w) =σ(ywTx).
Given a training dataDconsisting of inputsX ={x1, ...,xN} and their corresponding target valuesy={y1, ..., yN}, the data likelihood is
p(y|X,w) = N Y
i=1
σ(yiwTxi). (3)
1Sum-pooling is equivalent to computing the histogram in the case of hard feature assignment.
The model is explicitly conditioned on the input dataXalthough they are not random variables. The prior on the model parameters
wis assumed to be an isotropic gaussian
p(w|α) =N(w|0, α−1
I) = (α 2π)
D/2exp−α 2w
T
w (4)
αis a hyper-parameter in the prior. To be a fully Bayesian treat-ment, all parameters including unknown quantities of interest and nuisance parameters are considered as random variables and are assumed to be following certain distributions. Therefore we as-sume a hyper-prior Gamma distributionp(α) = Γ(α|c, d)onα. Thus, the joint distribution of all the parameters{w, α}and the dataX={xi, yi}is
p(w, α,y) =p(y|X,w)×p(w|α)×p(α) (5) which can be verified through the graphical model shown in Figure2. Bayesian inference in this case revolves around two
N
y
W
α
c
d
Figure 2. Graphical model for Bayesian logistic regression. Circles denote random variables and shaded circles represent
observations while squares denote deterministic variables.
steps: the computation of the marginal posterior distribution p(w|y)and the computation of predicative distributionp(y∗|y) for a new test datax∗based on the posterior distribution. In prin-ciple, the marginal posterior distributionp(w|y)can be comput-ed by integrating outαin the full posterior distributionp(w, α|y) that is yet hard to compute because of the model evidencep(y). Accordingly the predicative distribution can be computed by in-tegrating over the model parametersw, as given in
p(y|x∗,X,y) = Z
p(y|x∗,w)×p(w|X,y)dw (6)
posterior and the predicative distribution are not trackable. There-fore, one has to resort to approximation to the posterior, which can be solved mainly in two ways: deterministic and stochas-tic approximation. The stochasstochas-tic methods, mainly referring to various Markov Chanin Monte Carlo (MCMC) method, rely on a large number of samples drawn indecently from the posterior distributionp(w, α|y). In most cases, this is computationally very intensive and it is hard to ensure the independence between samples. Thus, in this paper, we concentrate on deterministic variational approximation based on the mean field theory.
2.4 Variational inference
The goal of variational inference (Blei et al., 2016) is to approxi-mate a (posterior) distribution. The key idea is to solve this prob-lem with optimization. A family of distributions over the latent variables, parameterized by free variational parameters, is select-ed. The optimization finds the member of this family, i.e., the setting of the parameters, that is closest in the Kullback-Leibler divergence to the conditional distribution of interest. The fitted variational distribution then serves as a proxy for the exact condi-tional distribution. All inferences involved in prediction are com-puted using the variational distribution instead of the posterior distribution. One widely used family of distributions is the fac-torized distributions, which leads to the well-known mean field inference. Thus we assume that the posterior distribution can be approximated asq(w, α) =q(w)×q(α).
The variational distribution are found by maximizing the varia-tional lower bound However, the data log likelihood does not have a conjugate prior in the exponential family and will be approximated by the use of a lower bound of the logistic sigmoid function (Jaakkola and Jordan, 2000), which is
with one additional parameterξfor each observation. Thus, by replacing the sigmoid function in the likelihood in (3) with this lower bound, we can obtain a lower bound in (9) of the data log-likelihood.
Substituting the new lower bound as the data log-likelihood in (9), one can obtain a new lower bound of the variational lower bound in (7). This lower bound is going to be maximized to seek for the varia-tional distributionsq(w, α). Nevertheless it contains the parame-tersξ. Here we adopt an alternating optimization by maximizing w.r.t eitherξorq(w, α)while fixing the other. While fixingξ, the variational distributions can be computed by standard varia-tional methods for factorized distributions (Bishop, 2006). The
variational distribution forwis given by
lnq(w) = lnh(w,ξ) +Eα[lnp(w|α)] +const Similarly the variational distribution forαis
lnq(α) = lnp(α) +Ew[lnp(w|α)] +const
Thus, the involved expectations are
Eα(α) = a
b, Ew(w T
w) =µTwµw+T r(Σw). (15) While fixing the variational distributionsq(α)andq(w), the pa-rametersξcan be obtained by setting the derivative of (10) w.r.t
ξto zero (Bishop, 2006), giving
(ξi)2=xTi(Σw+µwµ T
w)xi. (16)
After obtaining the variational distributionq(w), it can be used as a proxy for computing the predictive distribution. Then, the predictive distribution in (6) can be approximated as
p(y= 1|x∗,y) =
It is worth noting that the integrand is quadratic inw. Thus by complete the square in exponential function, the integral can be written as
(a) (b) (c)
(a) (b) (c)
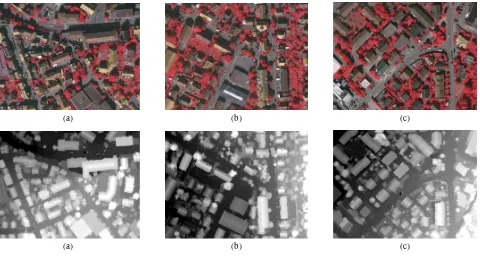
Figure 3. Example images and the corresponding DSMs used for performance evaluation.
that are wrongly labeled. Thus, a smoothness constraint should be considered when labeling the pixels based on the probability map. Usually a random filed models is applied. In this paper a fully connected CRF model (Kr¨ahenb¨uhl and Koltun, 2011) is employed. Basic CRF models are composed of unary potentials on individual pixels or image patches and pairwise potentials on neighboring pixels or patches. The fully connected CRF uses a different model structure that establishes pairwise potentials on all pairs of pixels in the image, enabling greatly refined segmen-tation and labeling.
Formally, we consider a random fieldX defined over a set of variables{X1,X2, ... ,XN}, where each variable takes value from{-1, 1}. In the fully connected pairwise CRF model, the energy function is defined as
E(x) =X i
φµ(xi) + X
i<j
φp(xi, xj). (20)
wherexis a particular labeling ofXandi, jrange from 1 toN. The unary potentialφµ(xi)is computed independently for each pixel by the previous variational inference of logistic regression, which is actually a probabilistic distribution over the label as-signment. The pairwise potentials in the model is defined as the following line combination of a set of Gaussian similarity func-tions
φp(xi, xj) =µ(xi, xj) h
w1exp−|pi−pj|2 2θ2
α
−|Ii−Ij|2 2θ2
β
]
+w2exp−|pi−pj| 2
2θ2 γ
i
(21)
wherepi, pjare the color vectors andIi, Ijare the position vec-tors for pixeliandjandw1, w2are the weights. There are five parametersw1, w2, θα, θβ, θγthat should be set or learned. The maximum a posteriori (MAP) labeling of the random fieldXis given byx∗
= argminE(x). An effective inference method
based on the mean field theory using high-dimensional filtering was proposed in (Kr¨ahenb¨uhl and Koltun, 2011), which is used in this paper for labelling the building pixels.
3. EXPERIMENTS AND EVALUATION 3.1 Data set and setup
The data that we used for performance evaluation is a benchmark data set consisting of aerial images and digital surfaced model (DSM) released by ISPRS for 2D semantic labeling2. It has 16 arial images and corresponding DSM in addition to the ground truth of buldings. Example images and DSM in this data are shown in Figure 3.
The BoW features that we used are computed as described in section 2.2. The local features are the vectorized pixel values in a3×3neighborhood (Cui et al., 2015). The codebook used for feature encoding is a random dictionary, in which the entries are uniform randomly selected from the entire local feature space. The size of the codebook is empirically set to 500. 50,000 BoW features are randomly selected from each image for learning the logistic regression model by variational inference. The parame-ters in hyperprior are set to small values, i.e., 1e-4. The weights in (21) are set to 1.0 and the standard deviations are set to 30. All these parameters are set by try-and-error. The accuracy mea-sures used for performance comparison are precision, recall and F1 score.
3.2 Results and discussion
The results for the 16 images are shown in table 1. The detec-tion results using the images shown in Figure 3 are shown in the first row in Figure 4. Compared with the ground truth shown in the second row in Figure 4, the detection results are quite good. Visually there is no isolated noisy building pixels, which is the
(a) (b) (c)
(d) (e) (f)
Figure 4. Example results of building detection: (a)(b)(c) detection results on the images shown in Figure 3; (d)(e)(f) ground truths.
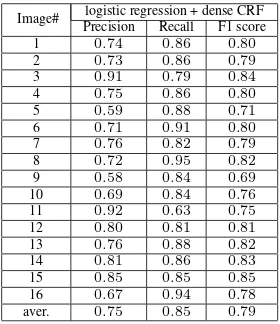
Table 1. Performance evaluation in terms of precision and recall.
Image# Precisionlogistic regression + dense CRFRecall F1 score
1 0
.74 0.86 0.80
2 0
.73 0.86 0.79
3 0
.91 0.79 0.84
4 0
.75 0.86 0.80
5 0
.59 0.88 0.71
6 0
.71 0.91 0.80
7 0
.76 0.82 0.79
8 0
.72 0.95 0.82
9 0.58 0.84 0.69
10 0
.69 0.84 0.76
11 0
.92 0.63 0.75
12 0
.80 0.81 0.81
13 0
.76 0.88 0.82
14 0
.81 0.86 0.83
15 0
.85 0.85 0.85
16 0
.67 0.94 0.78
aver. 0
.75 0.85 0.79
desired effect by applying the fully connected CRF model. From the quantitative results shown in table 1, the average precision, recall and F1 score are respectively75%,85%,and79%.
4. CONCLUSION
In this paper a method for building detection based Bayesian lo-gistic regress and a fully connected CRF model is proposed and demonstrated. It consists of three step: Bag-of-Words (BoW) fea-ture extraction, Bayesian learning via variational inference, and pixel labeling via a fully connected CRF model. Due to the p-resence of hyper prior in the probabilistic model of logistic re-gression, a variational inference method based on the mean field theory is applied for learning the model. A benchmark data set released by ISPRS for 2D semantic labeling is used for perfor-mance evaluation. The results demonstrate the effectiveness of the proposed method.
ACKNOWLEDGEMENTS
Acknowledgements of the data provision by the ISPRS WG II/4.
REFERENCES
Ahmadi, S., Zoej, M. V., Ebadi, H., Moghaddam, H. A. and Mo-hammadzadeh, A., 2010. Automatic urban building boundary extraction from high resolution aerial images using an innovative model of active contours.International Journal of Applied Earth Observation and Geoinformation12(3), pp. 150 – 157.
Benediktsson, J. A., Pesaresi, M. and Amason, K., 2003. Classi-fication and feature extraction for remote sensing images from ur-ban areas based on morphological transformations. IEEE Trans-actions on Geoscience and Remote Sensing 41(9), pp. 1940– 1949.
Bishop, C. M., 2006.Pattern Recognition and Machine Learning (Information Science and Statistics). Springer-Verlag New York, Inc., Secaucus, NJ, USA.
Blei, D. M., Kucukelbir, A. and McAuliffe, J. D., 2016. Varia-tional Inference: A Review for Statisticians. arXiv preprint arX-iv:1601.00670.
Cao, G. and Yang, X., 2007. Man-made object detection in aerial images using multi-stage level set evolution. International Jour-nal of Remote Sensing28(8), pp. 17471757.
Cui, S., Schwarz, G. and Datcu, M., 2015. Remote sensing im-age classification: No features, no clustering. IEEE Journal of Selected Topics in Applied Earth Observations and Remote Sens-ing8(11), pp. 5158–5170.
Cui, S., Yan, Q. and Reinartz, P., 2012. Complex building de-scription and extraction based on hough transformation and cycle detection.Remote Sensing Letters3(2), pp. 151–159.
Drugowitsch, J., 2014. Variational Bayesian inference for linear and logistic regression.arXiv preprint arXiv:1310.5438.
Huertas, A. and Nevatia, R., 1988. Detecting buildings in aeri-al images. Computer Vision, Graphics, and Image Processing
41(2), pp. 131 – 152.
Inglada, J., 2007. Automatic recognition of man-made objects in high resolution optical remote sensing images by svm classifica-tion of geometric image features. ISPRS Journal of Photogram-metry and Remote Sensing62(3), pp. 236 – 248.
Irvin, R. B. and McKeown, D. M., 1989. Methods for exploit-ing the relationship between buildexploit-ings and their shadows in aerial imagery. IEEE Transactions on Systems, Man, and Cybernetics
19(6), pp. 1564–1575.
Izadi, M. and Saeedi, P., 2012. Three-dimensional polyg-onal building model estimation from single satellite images.
IEEE Transactions on Geoscience and Remote Sensing50(6), p-p. 2254–2272.
Jaakkola, T. S. and Jordan, M. I., 2000. Bayesian parameter esti-mation via variational methods. Statistics and Computing10(1), pp. 25–37.
Karantzalos, K. and Paragios, N., 2009. Recognition-driven two-dimensional competing priors toward automatic and accu-rate building detection. IEEE Transactions on Geoscience and Remote Sensing47(1), pp. 133–144.
Katartzis, A. and Sahli, H., 2008. A stochastic framework for the identification of building rooftops using a single remote sensing image. IEEE Transactions on Geoscience and Remote Sensing
46(1), pp. 259–271.
Kim, T. and Muller, J.-P., 1999. Development of a graph-based approach for building detection. Image and Vision Computing
17(1), pp. 3 – 14.
Kr¨ahenb¨uhl, P. and Koltun, V., 2011. Efficient inference in ful-ly connected crfs with gaussian edge potentials. In: J. Shawe-Taylor, R. S. Zemel, P. L. Bartlett, F. Pereira and K. Q. Weinberg-er (eds),Advances in Neural Information Processing Systems 24, Curran Associates, Inc., pp. 109–117.
Krishnamachari, S. and Chellappa, R., 1996. Delineating build-ings by grouping lines with mrfs. IEEE Transactions on Image Processing5(1), pp. 164–168.
McGlone, J. C. and Shufelt, J. A., 1994. Projective and object space geometry for monocular building extraction. In:1994 Pro-ceedings of IEEE Conference on Computer Vision and Pattern Recognition.
Mohan, R. and Nevatia, R., 1989. Using perceptual organization to extract 3d structures. IEEE Transactions on Pattern Analysis and Machine Intelligence11(11), pp. 1121–1139.
Ok, A. O., 2013. Automated detection of buildings from sin-gle vhr multispectral images using shadow information and graph cuts.ISPRS Journal of Photogrammetry and Remote Sensing86, pp. 21 – 40.
Peng, J. and Liu, Y. C., 2005. Model and context-driven building extraction in dense urban aerial images.International Journal of Remote Sensing26(7), pp. 1289–1307.
Pesaresi, M. and Benediktsson, J. A., 2001. A new approach for the morphological segmentation of high-resolution satellite imagery.IEEE Transactions on Geoscience and Remote Sensing
39(2), pp. 309–320.
Senaras, C., Ozay, M. and Vural, F. T. Y., 2013. Building de-tection with decision fusion. IEEE Journal of Selected Topics in Applied Earth Observations and Remote Sensing6(3), pp. 1295– 1304.
Shackelford, A. K. and Davis, C. H., 2003. A combined fuzzy pixel-based and object-based approach for classification of high-resolution multispectral data over urban areas.IEEE Transactions on Geoscience and Remote Sensing41(10), pp. 2354–2363.
Shufelt, J. A., 1999. Performance evaluation and analysis of monocular building extraction from aerial imagery.IEEE Trans-actions on Pattern Analysis and Machine Intelligence21(4), p-p. 311–326.
Sirmacek, B. and Unsalan, C., 2009. Urban-area and building de-tection using sift keypoints and graph theory.IEEE Transactions on Geoscience and Remote Sensing47(4), pp. 1156–1167.
Sumer, E. and Turker, M., 2013. An adaptive fuzzy-genetic algo-rithm approach for building detection using high-resolution satel-lite images. Computers, Environment and Urban Systems39, p-p. 48 – 62.
¨
Unsalan, C. and Boye, K. L., 2005. A system to detect houses and residential street networks in multispectral satellite images.
Computer Vision and Image Understanding98(3), pp. 423 – 461.
Zhang, Y., 1999. Optimisation of building detection in satellite images by combining multispectral classification and texture fil-tering. ISPRS Journal of Photogrammetry and Remote Sensing