OCEAN WAVE ENERGY ESTIMATION USING ACTIVE SATELLITE IMAGERY
AS A SOLUTION OF ENERGY SCARCE IN INDONESIA
Z.A. Nadzira, L.A. Karondiaa, L. M. Jaelania,*, A. Sulaimane, A. Pamungkasb, E.S. Koenhardonoc, A. Sulisetyonod aDept. of Geomatics Engineering, Faculty of Civil Engineering and Planning, bDept. of Urban and Regional Planning, Faculty of Civil Engineering and Planning, cDept. of Marine Engineering, Faculty of Marine Technology, dDept. of Naval Architecture and Shipbuilding Engineering, Faculty of Marine Technology, Institut Teknologi Sepuluh Nopember, Surabaya, 60111, Indonesia.
E-mail: [email protected]; [email protected]; [email protected]; [email protected]; [email protected]; [email protected]
ePusat Teknologi dan Inventarisasi Sumber Daya Alam (PTISDA), Badan Pengkajian dan Penerapan Teknologi (BPPT), 8th MH Thamrin Street, Jakarta, 10340 Indonesia [email protected]
KEY WORDS: ALOS PALSAR, Matlab, Ocean Wave Energy, Poteran Island, FFT
ABSTRACT:
Ocean wave energy is one of the ORE (Ocean Renewable Energies) sources, which
potential, in which this energy has several advantages over fossil energy and being one of the most researched energy in developed countries nowadays. One of the efforts for mapping ORE potential is by computing energy potential generated from ocean wave, symbolized by Watt per area unit using various methods of observation. SAR (Synthetic Aperture Radar) is one of the hyped and most developed Remote Sensing method used to monitor and map the ocean wave energy potential effectively and fast. SAR imagery processing can be accomplished not only in remote sensing data applications, but using Matrices processing application as well such as MATLAB that utilizing Fast Fourier Transform and Band-Pass Filtering methods undergoing Pre-Processing stage. In this research, the processing and energy estimation from ALOS-PALSAR satellite imagery acquired on the 5/12/2009 was accomplished using 2 methods (i.e Magnitude and Wavelength). This resulted in 9 potential locations of ocean wave energy between 0-228 W/m2, and 7 potential locations with ranged value between 182-1317 W/m2. After getting through buffering process with value of 2 km (to facilitate the construction of power plant installation), 9 sites of location were estimated to be the most potential location of ocean wave energy generation in the ocean with average depth of 8.058 m and annual wind speed of 6.553 knot
INTRODUCTION
Indonesia is an archipelago country consisted of 17,480 islands and 5.8 million km2 oceans. These features make Indonesia have vast potential in maritime sector, e.g. fisheries and renewable energy source. As the one of
Energy) has a bright future to be a solution of energy scarce in Indonesia, although this energy is still in conceptual and research development phase. There are several types of ORE, e.g. ocean wave energy, tidal energy, internal current energy and OTEC (Ocean Thermal Energy Conversion). ORE has become one of research focus in developed countries e.g. UK, Japan, EU. Energy source which equally distributed all over the world with high energy density and its high and easy predictability using modelling and hindcasting made ORE has high potential to make positive impact for civilization in the future (Lewis, 2011). Ocean Wave Energy is Indonesia itself, ocean wave energy has 5 times potential over current electricity supply, reaches 141,472 MWh/ year (Mukhtasor, 2014).
(Mukhtasor, 2014) preliminary assessment of wave energy potential research result which shown in Fig.1, a strait between Bali and Lombok island,
named Selat Lombok as one of the most potential site of wave energy generation. Another site which needed to be
side of Madura island, East Java. There are several method of mapping wave energy potential, SAR (Synthetic Aperture Radar) is one of the newest and least developed method among other else. Several preliminary research has been done to estimate the waveheight using various SAR satellites and method (Thomas, 1982) (Sugimoto, Shiroto, & Ouchi, 2011), which the former used SEASAT-SAR imagery, while the latter using ALOS-PALSAR resulted in 0-7 meters waveheight. This paper will discuss an estimation process of ocean wave energy potential in -PALSAR imagery according to (Sugimoto, Shiroto, & Ouchi, 2011), improvised with estimation using period, wavelength and frequency as parameters.
* Corresponding author
The International Archives of the Photogrammetry, Remote Sensing and Spatial Information Sciences, Volume XL-2/W4, 2015 Joint International Geoinformation Conference 2015, 28–30 October 2015, Kuala Lumpur, Malaysia
This contribution has been peer-reviewed.
METHODOLOGY AND RESULTS
aters, stretched from 113.937485o-114.064171o east longitude and 7.066742o-7.102686o south latitude. Because of this configuration of coordinates, this island located in 2 UTM zones, 49S and 50S. Poteran Island is administratively belongs to Sumenep Regency, and located in the southwest
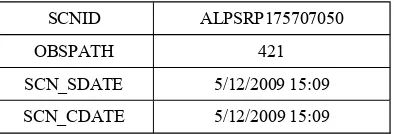
mainly used ALOS-PALSAR and its electromagnetic wave characteristic. By utilizing several signal processing techniques e.g. Fast Fourier Transform and Band-Pass Filter, the wavelength can be extracted from these SAR images, thus another wave parameters can be estimated. ALOS-PALSAR imagery used in this research was 1 scene with scene id ALPSRP175707050 which shown in Fig.3, acquired at 5/12/2009 and its parameters is explained in Table 1. This research used 3 kind of SAR data, e.g. HH-polarization amplitude, VV-HH-polarization amplitude and sigma naught. The differences between all of them is their digital number which depends on reflected waves received by sensor, for sigma naught is declared in decibel (dB) and for amplitude is declared in magnitude.
Figure 2. Poteran Island Location
Table 1. ALOS-PALSAR scene parameters Intensity images consisted of 100x100 pixel were used to divide the imagery to be
ocean-waters-only, as the image containing not only ocean but also land features. 6 grid was selected which divided into 2 main identification, near-shore wave and mid-ocean wave, shown in Table 2. The polarization ratio, which indicates the real incidence angle of every pixel in the imagery rather than using initial incidence angle explained in Fig. 4, was computed using Eq. 1 (Sugimoto, Shiroto, & Ouchi, 2011) where is the polarization ratio from HH and VV polarization amplitude image. Local slopes were derived by subtracting the incidence angles on the flat surface from the local incidence angles. These slope values contain fluctuations due to noise and local variation of actual wave slopes
Using FFT analysis of the grids, we was able to compute dominant wavelengths by deriving the pixel coordinates of wave spectra, using Eq.2. The results was 559.1070 meter for 1st matrix and 883.8835 meter for 2nd matrix.
Wave period 30-300 seconds which represent swell (infra-gravity waves) then selected from the images using band-pass filter to make the image containing swell-ocean wave-only. From the new selected image, we were converting the amplitude by its resolution (1,250 meters) to find the actual wave amplitude, which are 0.9 meters for 1st matrix and 0.8 meters for 2nd matrix. The significant waveheight computed by using Eq 3.
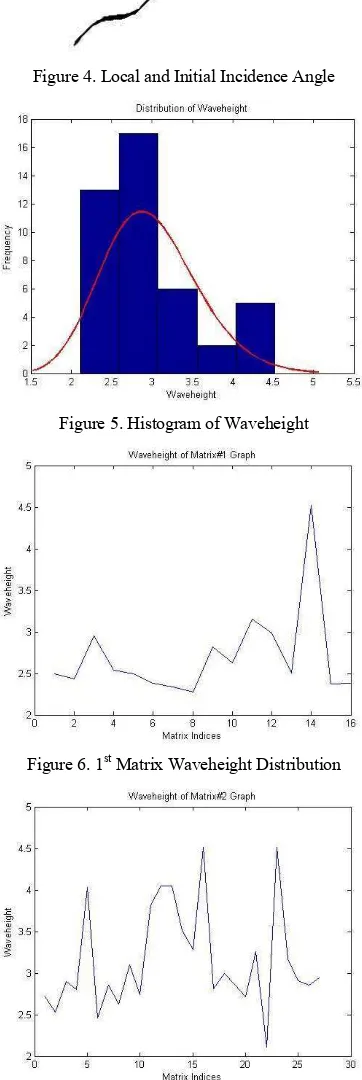
From 42 matrices indices, we obtained 3.713052 meters significant waveheight and 2.986318 mean waveheight. The Fig. 5 shown graph of these waveheight, while Fig.6 and Fig.7 showing distribution of the waveheight The International Archives of the Photogrammetry, Remote Sensing and Spatial Information Sciences, Volume XL-2/W4, 2015
Joint International Geoinformation Conference 2015, 28–30 October 2015, Kuala Lumpur, Malaysia
This contribution has been peer-reviewed.
Figure 4. Local and Initial Incidence Angle
Figure 5. Histogram of Waveheight
Figure 6. 1st Matrix Waveheight Distribution
Figure 7. 2nd Matrix Waveheight Distribution
These estimated waveheight and amplitude then being computed by wavelength and amplitude method in Eq. 4 and Eq.5, resulted in wave power. Wave power is an intensity of energy, declared in Watt/m2.
From the Eq.4, 7 location with high ocean wave energy potential was identified, as shown in Table 3, while from Eq.5 9 location was identified, as shown in Table 4. Graphs from Eq.4 and Eq.5 computations is also shown in Fig.8 and Fig.9. These graphs identified with red curve, which is a histogram fitting using gamma (random) distribution. These 7 and 9 location value ranged between 100-1000 Watt/m2 and have a high degree of randomness which is 99.7% and 99.72% respectively and shown in Table 5. Eq.5 result is visualized in Fig. 10, surrounding Poteran Island
coast. In the present analysis, we were showing and computing the value of potential at the time of data acquisition (5/12//2009) and not daily, monthly or annually; which need to be noted.
No Easting (m) Northing (m) UTM Zone
0 830,317.13 9,219,750.22 49 1 174,466.37 9,218,648.68 50 2 177,908.87 9,216,256.21 50 3 830,195.28 9,209,068.12 49 4 830,723.29 9,206,184.36 49 5 827,677.07 9,210,814.63 49 6 822,478.18 9,212,723.59 49 Table 3. Coordinates of Wave Potential from Eq.4
No Easting (m) Northing (m) UTM Zone
0 169,746.65 9,219,278.39 50 1 173,813.48 9,218,883.96 50 2 174,631.95 9,218,407.12 50 3 174,035.38 9,217,424.64 50 4 174,440.94 9,217,470.49 50 5 174,398.01 9,211,377.56 50 6 175,698.54 9,211,313.24 50 7 176,181.61 9,211,644.44 50 8 830,277.00 9,211,750.00 49 Table 4. Coordinates of Wave Potential from Eq.5
(4)
(5) The International Archives of the Photogrammetry, Remote Sensing and Spatial Information Sciences, Volume XL-2/W4, 2015
Joint International Geoinformation Conference 2015, 28–30 October 2015, Kuala Lumpur, Malaysia
This contribution has been peer-reviewed.
Figure 8. Eq.4 Wave Power Distribution
Matrix Confidence Interval (W/m2) Count Percentage (%)
PowAmp1 14,5007842801608 14,7159566409825 527 0,329375
PowAmp2 7,62784282640324 7,73071330459882 758 0,280740740740741 Table 5. Statistical Validation
Figure 9. Eq.5 Wave Power Distribution
Figure 10. Nine Potential Location
CONCLUSIONS
From this research about ocean wave energy estimation -PALSAR imagery with scene id ALPSRP175707050 and 5/12/2009 acquisition time we can see that at the time of acquisition, there were several location of ocean wave energy potential, the first one is 7 locations which ranged between 182-1317 W/m2 and the second one is 9 locations which ranged between 0-258 W/m2. High degree of randomness is achieved from statistical testing proofed by usage of gamma distribution instead of Gaussian distribution, means that the placement of energy generator in these area should be really careful, since the value was almost totally random. For the future research, we should utilize field campaign in order to achieve high degree of validity and to acquire oceanographic parameters, supplemented by usage of multi-temporal spatial imagery to make the model more reliable and valid.
ACKNOWLEDGEMENTS
This research is a part of Sustainable Island Development Initiatives (SIDI) Program, a collaborative research in small island development between Indonesia and Germany. REFERENCES
Lewis, A. S.-M. (2011). Ocean Energy. In R. P.-M. O. Edenhofer, IPCC Special Report on Renewable Energy Sources and Climate Change Mitigation (pp. 497-534). Cambridge: Cambridge University Press.
Mukhtasor. (2014). Recent Notes on Economic Scales Ocean-Based Power Plants. Jakarta, DKI Jakarta, Indonesia.
Sugimoto, M., Shiroto, N., & Ouchi, K. (2011). Estimation of Ocean Wave Height using Polarization Ratio of Synthetic Aperture Radar Data. Geoscience and Remote Sensing Symposium (IGARSS), 2011 IEEE International (pp. 2821-2824). Vancouver: IEEE.
Thomas, M. (1982). The estimation of wave height from digitally processed SAR Imagery. International Journal of Remote Sensing, 3(1), 63-68.
The International Archives of the Photogrammetry, Remote Sensing and Spatial Information Sciences, Volume XL-2/W4, 2015 Joint International Geoinformation Conference 2015, 28–30 October 2015, Kuala Lumpur, Malaysia
This contribution has been peer-reviewed.