THE AUTOMATION OF THE PROCESS OF LAND AREA CHANGE DETECTION IN
PERMANENT MONITORING SYSTEMS
L.V. Areshkina a, L.A. Belazerskii a, N. Oreshkin b a
United Institute of Informatics Problems United Institute of NAS, 220012 Minsk, Belarus – [email protected] b
Artec Group, 2 rue Jean Engling L-1466 , Luxembourg – [email protected]
Commission III, WG III/3
KEY WORDS: Land area, Difference image, Space imagery, Change detection
ABSTRACT:
A new automation process for change detection of land area is proposed. The method is based on the use of multitemporal satellite images and their histograms. The proposed discrete representation of land area in small image fragments makes it possible to detect changes automatically within each fragment. This method provides improvements of change detection accuracy and simplifies the software realization by unifying recursively performed processing. In this article the method of difference images and its adaptation for automatic applications is also analysed. In particular, a complementary pair of images is proposed as the main presentation of a difference image which allows automatic separation of the changes of ground objects without loss or distortion. The use of the histograms obtained by variations of image brightness (increasing and decreasing) provides opportunities for the assessment and experimental verification of existing approaches in the selection of automatic detection thresholds. The assessment of the implementations of the algorithms of Kittler, Kapur, Otsu, and the method of mean risk minimum demonstrate the instability of their solutions, wide variance in of results, as well as inconsistencies with the visual approaches to the selection of the binarization thresholds. A new algorithm for the automatic detection and analysis of the brightness changes of land areas is proposed. As a result, the automation of detection of each brightness change of a given land area is achieved in all available spectral channels of satellite imagery.
1. INTRODUCTION
Multi-temporal images of space shooting on a given territory are the initial data for task of change detection of land area interests.
Detailed consideration of multi-temporal images of space shooting for the area, which contained interesting changes it was found the following.
The size of the processed image area affects the process of change detection and it is the cause of loss of identity of certain changes. As a result, the idea of forming land area of interest is appeared.
Overview of scientific publications showed the decision of thematic treatment problems does not consider questions of size selection images of the treated area (Caprioli, 2003), (Gonzalez, 2008), (İlsever, 2012), (Labutina, 2011), (Richard, 2005) etc.
Most often, the entire territory of image is considered. At the same time in most cases the interest is shown to its parts but not to the entire obtained image.
The task of forming the land area of interest as part of image or the object of land area using data from satellites shootings has no well-established approaches to the automated solution and it is implemented today mainly interactive way.
For example, the operator of software ERDAS Imagine for selecting areas of interest of the image uses one of the available set of interactive methods.
2. LAND AREA OF INTERST
2.1 Time interval of multitemporal space imagery
Permanent monitoring system differing thematic direction is characterized by different interval time of multitemporal of space shooting. For example, to detect changes in order to correct topographic maps could be assumed the time between two sequential space imagery (
t
10, t
20)
for some certain of landarea of interests may be different for a year or more (Collins, 1996).
At the same time, frequency of such control to evaluate the status of the vegetation process of agricultural crops or influence on it exceptional meteorological and biological factors are required a few days.
Therefore, the first element of automating the process of changes detecting in the permanent monitoring system should be control of allowable time
Δ
t
abl between the multitemporalsatellite imagery for a given land area of interests.
In response to this exceeding the specified time, i.e. on
fulfilment of the inequality
t
10- t
20>
Δ
t
abl can be bothautomatic refusal to detect changes and the adoption of obtained another of image for the reference image from any the following space imagery.
As the first space imagery from the resulting image
t
10 andspace imagery corresponding to the next time
t
11 exceedingt
10,under certain conditions, can become the reference images that
reflect the staffing state of the land area of interests. If the time obtaining of images of the last space imagery does not exceed a predetermined value
t
10 ort
11, the current images characterizethe current state of the land area of interests.
2.2 Land area of interest and its space imagery
In the general case the shape of the studied earth's surface can be any complexity. In the process of real space imagery its imaging is possible in parts in a number of satellite overpasses.
Limited capture bandwidth targeted apparatus is the reason that a large area districts may not be reflected in a single space image. Large part of the survey area in each of these images is not of interest for researchers and developers of permanent monitoring systems.
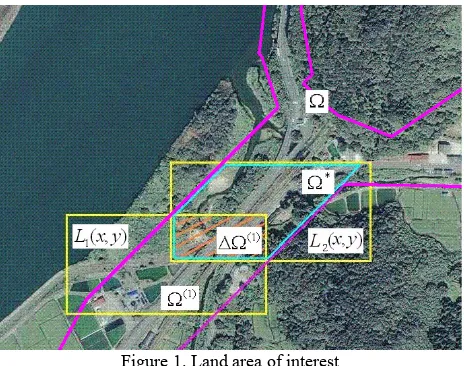
Figure 1 schematically shows an example of the selected red line a land area of interest Ω in the form of a curved narrow band. This region extends from the south-western edge to the north-eastern edge of the image.
Figure 1. Land area of interest
Image of initial satellite acquisition
L
1(x, y
) covers the part ofthe territory
Ω
(1) from the field of land area of interestΩ
, whereL
1(x, y), x, y
∈
Ω
(1)
Next image of satellite acquisition
L
2(x, y)
covers another partof the territory
Ω
*, wherewith the previous image of satellite acquisition
Ω
(1).Upon receipt of all necessary images, the formation of the entire land area of interest, consisting of a number of formed parts
∪
is finished. This process requires the expenditurethe labour of operator for determining the area boundaries of interest and connecting of obtained land parts.
For reducing of operator involvement in the formation of land areas of interest, a method of land area definition on the basis of discrete representation of its image in the form of fragments is proposed.
A discrete representation a plurality of image patches of equal size, the same orientation to the cardinal points and acquiring individual topographic binding in the composition of area land of interests are used.
In this case, the smaller the fragment, the more accurate description control might be. Therefore, any part of the land interests can always be constructed from closely spaced small size of image fragments, which call them fragments of detailed analysis.
As a result, each fragment acquires its own geographical binding. In addition, each input the next of space image of area interest by parts is often accompanied the displaying of all arranged fragments before caught in the zone of his space imagery.
3. THE DIFFERENCE IMAGES TO EVALUATE THE
CHANGES simultaneously two components of changes land area for a time period.
The first are components of image which increases the brightness of changes, the second - to reduce them. The absence of changes could be detected by the presence of the background on one of the pairs of difference images represented by pixels with zero, or near to it brightness. Using (1), consider the example of a discrete analysis of land area.
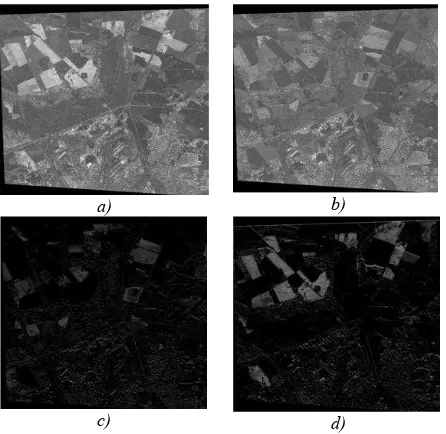
Figure 2 shows the multitemporal satellite images QuickBird (May, July) of Satellite Imaging Corporation of the same part of the earth's surface in the vicinity of Brest size of 9,8 x 9,3 km and the corresponding complementary pair, representing the difference image.
Figure 2, c visually detects the change of increasing brightness of some components in all “zero” background and Figure 2, d - decreasing brightness.
Thus it is possible to pay attention to the following features: - Actually having multiple changes at one and another of complementary images;
- The simultaneous presence of large and small brightness changes;
- Proximity to the background brightness of some changes;
- Mutual brightness differences between the individual components of a change of brightness each sign.
а) complementary pair of differential image (c - increasing brightness, d - decreasing)
Detection a plurality of changes makes it necessary to display separately each change of its composition, determining the area, range of brightness and coordinates. For the above-mentioned features of randomly-brightness character the task of automation change detection cannot be solved by simple means.
In order to determine approach to its solution it is appropriate to pay attention to the fact that the land area of interest practically cannot coincide with the whole picture of satellite imagery, as was customary in the above comparison.
As the land area of interests as shown in Figure 2, a, b can be chosen, for example, only river basin “Lesnaj”, shown in the picture in the direction of flow from the southwest to the northeast with turning almost to the north in the center of the displayed area (seen most clearly in Figure 2, a). This could be a forest.
At the same time in any of these cases, the changes are detected in other parts of the space image, were not of interest to the observer.
However before solving problems of automatic extracting of any changes detectable visually in the composition of difference image (Figure 2), should be performed discretization of area and its detailed analysis.
3.2 Image histograms of complementary differential pairs in the detection of brightness changes
To construct the algorithm of detect changes turn from the space-brightness descriptions of changes by the complementary pair of images to brightness by using histograms. Each of multitemporal satellite images represents a mapping of brightness of aggregate areas of natural and anthropogenic component
S
k, where the total area is equal to the territorialcoverage of the earth's surface in the process of space imagery:
∑
registration brightness of the reflected solar radiation in the form of pixels that are must have the size, called spatial resolutionδ
, the whole area of each k-th component of the image can be viewed as a discrete sampling of pixel brightnessk
components underlying surface because of reflection of solar radiation.
Thus, the sampling of pixels of one component or samples of all components which have been subjected to changes and displayed on the images of complementary pair, correspond to individual brightness histograms of these changes.
They form jointly the general histogram of each image of pair. The shape of histogram depends on an amount of changes, on dimensions or area of the sample and differences in their brightness.
The existing diversity of space imagery objects, quantitative composition and the physical characteristics of the components before and after the change can be regarded as accidental factors. Their influence determines the random nature of histograms of complementary pairs of difference images, which have to deal when solving the problem of detecting changes.
Proceeding from representations about histograms of complementary pair is advisable to return to the issue of a
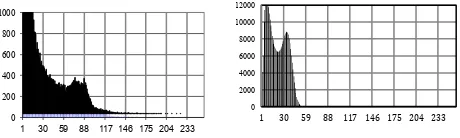
Figure 3 - Histograms of complementary pairs of difference images (Figure 2, c, d):
a - histogram changes caused by increasing brightness; b - histogram changes caused by decreasing one
0
The main detectable feature here refers to the character of image histogram of increasing brightness changes (Figure 3, a). It is clearly does not reflect a set of components, which characterizes the visual analysis of corresponding image (Figure 2, c).
The reason for the omission of such changes can be considered:
- Weak difference many changes from the background;
- Uniform brightness filling a variety of brightness changes of the full scale interval adjoining to the "pure" background
)
composition one part describing changes and separated from the background the small saddle.
At the same time, this component on visual estimates in Figure 2, c combines multiple components which have undergone changes of sufficiently high brightness differences, i.e. slight brightness differences can be masked here by the background.
Hence it follows that a large area monitoring in via a bar graph representation of the difference image is the cause of loss of identity of some changes.
4. DETECTION OF BRIGHTNESS CHANGES
To solve the problem of change detecting of land area it is important to choose a threshold for binarization difference image (Sezgin, 2004).
4.1 Methods threshold processing
Application of the methods of threshold processing because of its simplicity and matching of visually outcomes is the most appropriate. In the case of one component changes
И
Ω
, as, for example, reflects the histogram of real image in Figure 3, b the determining the brightness of detected changes can be explained as follows:would be allocated from the composition of corresponding image with its threshold
Δ
L
Пg and would have been similarto (2).
Corresponding to this situation is typical for only of observed changes as a part of the change histogram in addition to Figure 3, b is shown in Figure 4.
Such cases, according to correspond to the so-called global threshold separating the brightness (uniform for the general image), which can be found as the boundary between the
brightness of groups of background pixels and changes as a result of one of the following methods (Sezgin, 2004):
Figure 4 - Histogram of the difference image, which reflects only the brightness change
- Visual assessment as a result of the analysis of the difference histogram;
- Statistical evaluation of the minimum average risk for the normal approximation of the background component and changes;
- Successive approximations;
- Maximizing the interclass variance (Otsu, 1976); - The minimum error (Kittler, 1986);
- Maximum Entropy (Kapur, 1985) and others.
Experimental verification of these methods applying for implementation of automatic change detection of land area of interests as a result of processing a series of fragments of detailed analysis of difference images and histograms showed that whichever of them is adopted, it will always have to deal with errors.
At the same time resulting error can be of two types: the deviation values obtained from visually estimated threshold closing to the maximum likelihood, and failures in the evaluation of the threshold on the range of brightness histogram (for example, by Kittler). They are not subject to definition. In addition, all of the methods often give differing in threshold values, so give preference to one of them is not possible.
Taking into account the considered circumstances seems the most appropriate method for determining global thresholds is the threshold value estimates of brightness in the minimums of histogram threshold of maximum likelihood.
Experience experimental treatment of difference images fragments of real space survey showed that satisfactory results in all occurred situations resulted – it is the three times performed 11-point moving smoothing (mean) histograms.
4.2 Segmentation of changes and analysis characteristics
In general, the definition of a global threshold for detecting changes in any way is not an end in itself. During the fact-finding appearance changes must follow their analysis.
This concept includes the evaluation of topographic location changes, an area and brightness characteristics. Initial operation for this analysis is the segmentation of the changes.
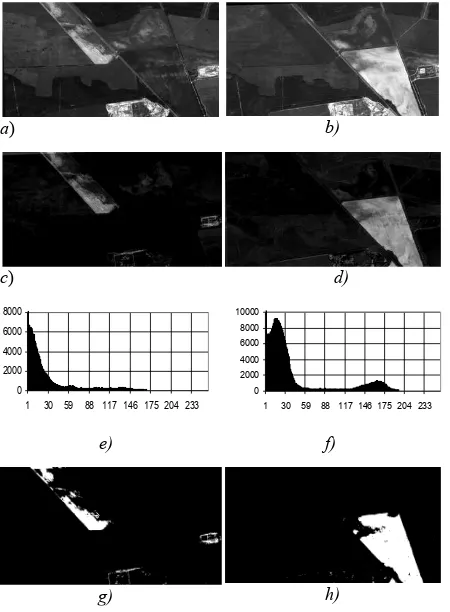
The purpose of performed operation is to drastic reduction of the amount of information contained in the image. In particular, visualization of segmented changes is shown in Figure 5 for complementary pairs of images of real space imagery.
0
In particular, for separation from the image k-th component of changes, the segmentation of last may be represented as the following expression of binarization:
Each performed first segmentation selected a component change with an increasing brightness for the fragments of detailed analysis, the second - reducing them.
At the same topographic binding fragment can automatically determine the location and boundaries of each change and usual summation of binarization changes in pixels - their area:
2
where
δ
- the spatial resolution of the space image.multitemporal images, c), d) complementary pair of image changes, e), f) their histograms, g), h) segmentation of changes
with thresholds
90
=
ΔLПg and ΔLПd=120
Finally, the element-wise multiplication of obtained binarization and image fragment of the current survey is determined the brightness of the elements of the corresponding sample changes:
)
where
!
- sign of element-wise multiplication;)
L
- value of the pixel image of the current space image.This implies the possibility of any estimates of statistical
characteristics of the obtained sample
n
Σ brightness.Thus, for the segmented images, shown in Figure 5, the area of the component changes to increase or decrease brightness as
statistical evaluation of such characteristics of brightness changes are characterized by the following values:
9
considered fragments and spatial resolution can be defined andsegmented boundary changes
x
min,
x
max,
y
min,
y
max.4.3 An algorithm for automatic detection and analysis of brightness changes on the basis of method difference images
The basis of algorithm for automatic detection and analysis of brightness changes of land area of interest is a discrete representation of specified area of land interests.
As a result of experimental treatment of fragments of detailed analysis, developed algorithm consists of two parts: an external and functional.
The external part of algorithm includes actions of a preparatory nature. Without these actions, as shown, the automatic implementation of the method of difference images is inefficient (omissions changes), and they should include:
- Fragmentation of fragments of detailed analysis;
- Formation and preservation of reference fragments of detailed analysis in all spectral channels out satellite imagery.
The functional part of the algorithm in accordance with the stated view consists of repetitive actions automatically in a sequence which includes:
- Detection of appointed fragment of detailed analysis as a part the image of the current satellite imagery (coordinates).
- Separating and exporting the image of detected fragment for further processing.
- Verification of existence and extract from the system database stored reference image fragment corresponding to the detected fragment of the current survey for using the method of difference images.
- Calculating the brightness of fragment of difference image as the joint processing of the current and founding reference fragments of multitemporal satellite images.
- Formation of a pair of complementary difference images of fragment and calculation of histograms.
- Calculation of a triple moving average of histograms on the
- Calculation of the first divided differences of smoothed histograms.
- Search and evaluation of brightness minima corresponding to the detection threshold with using smoothed histograms and their divided differences.
- Registration of any changes of the earth's surface area corresponding to the fragment, if at least one of a pair of histograms is set brightness thresholds for change.
- Segmentation changes of fragments on all intervals using by the brightness threshold.
- Determine of the characteristics of brightness changes at each interval defined thresholds: the nature of the changes (increase, decrease brightness), position in space fragment and the statistical characteristics of each brightness changes of area.
Considered the functional sequence of the algorithm is repeated for all spectral channels of regular space imagery of the Earth's surface, including land area of interest, for each detectable fragment of detailed analysis.
5. CONCLUSION
The proposed method for forming the land area of interest on the basis of discrete representation of its image in the form of fragment, represents a one-time process supported by accessible software, and simplifies the assignment of image fragments to a topographically tied photoplan, and replacing a map.
The method provides enhancement of change detection accuracy and simplifies the software realization of the monitoring system by unification of recursively performed processing.
The article substantiates the choice of complementary pair of images for change detection and subsequent analysis. It allows to separate the changes of ground objects of space imagery on changes with increase and decrease of the brightness automatically without loss and distortion.
Analysis and experimental verification of evaluation of global binarization thresholds in conditions of a priori uncertainties of changes presence and their number are made. This provided a selection of approach based on smoothing the histogram of difference images of brightness changes.
An algorithm of automatic detection and analysis of changes in brightness variations of ground-based objects in satellite images is developed. It is based on difference images and characterized by a specific way to determine binarization thresholds. It applies preprocessing directed at image fragments resolution increasing to select and evaluate characteristics of brightness changes.
Automatic segmentation of brightness intervals of change, corresponding to the defined thresholds, provides the same automatic evaluation of spatial position and brightness characteristics of each change within any fragment of land area of interest.
REFERENCES
CAPRIOLI, M., TARANTINO, E., 2003. Urban features recognition from VHR satellite data with an object-oriented approach. Proc. of Commission IV Joint Workshop (CD-ROM), Challenges in Geospatial Analysis, Integration and Visualization II, Sep. 8-9, 2003, Stuttgart, Germany.
COLLINS, J.B. 1996. An assessment of several linear change detection techniques for mapping forest mortality using multitemporal Landsat TM data. Remote Sensing of Environment. Boston, MA, USA. Vol. 56, pp. 66–77.
DEER, P., 1999. Digital Change Detection Techniques in Remote Sensing. Technical Report, DSTO-TR-0169. Department of Defence, Australia, 52 p.
GONZALEZ, R. C., WOODS, R.E., 2008. Digital Image Processing, 3rd ed., Prentice Hall, Upper Saddle River, NJ.
İLSEVER, M., ÜNSALAN, C., 2012. Two-Dimensional Change Detection Methods. Remote Sensing Applications, Yeditepe University, Istanbul, Turkey, Springer, 77 p.
KAPUR, J.N., SAHOO, P.K., WONG, A.K.C., 1985. A New Method for Gray-Level Picture Thresholding Using the Entropy of the Histogram, Computer Vision, Graphics, and Image Processing, Vol. 29, pp. 273–285.
KITTLER, J., ILLINGWORTH, J., 1986. Minimum Error Thresholding, Pattern Recognition, Vol. 19, pp. 41–47.
LABUTINA, I.A., BALDINA, E.A., 2011. The use of remote sensing for ecosystem monitoring of protected areas. Moscow, Russia, 88 p.
LU, D. [et al.], 2004. Change detection techniques. International Journal of Remote Sensing Vol. 25(12), pp. 2365–2407.
OTSU, N., 1976. A Threshold Selection Method from Gray-Level Histogram, IEEE Transactions on Systems, Man, and Cybernetics, Vol. 9, pp. 62–66.
RICHARD, J., RADKE, R., SRINIVAS, A., OMAR, A.K. and BADRINATH, R., 2005. Image Change Detection Algorithms: A Systematic Survey, IEEE Transactions on Image Processing, Vol. 14(3), pp. 294–307.
SEZGIN, M., 2004. Survey over image thresholding techniques. Journal of Electronic Imaging, Vol. 13(1), pp. 146–165.