Regional WebGIS User Access Patterns based on a Weighted Bipartite Network
R. Li ab, Y. Shen a, W. Huang c, H. Wu ab a
State Key Laboratory of Information Engineering in Surveying, Mapping and Remote Sensing, Wuhan University, Wuhan, Hubei, P.R.China- (ruili, yuki_shenyuqi,wuhuayi)@whu.edu.cn
b
Collaborative Innovation Center for Geospatial Technology, Wuhan University, Wuhan, Hubei, P.R.China c
National Geomatics Center of China, Beijing, P.R.China
- [email protected]Commission IV, IC WG IV/II
KEY WORDS: Weighted Bipartite Network, User Access Permeability, User Usage Rate, User Access Viscosity, Web Geographic
Information Systems
ABSTRACT:
With the rapid development of geographic information services, Web Geographic Information Systems (WebGIS) have become an indispensable part of everyday life; correspondingly, map search engines have become extremely popular with users and WebGIS sites receive a massive volume of requests for access. These WebGIS users and the content accessed have regional characteristics; to understand regional patterns, we mined regional WebGIS user access patterns based on a weighted bipartite network. We first established a weighted bipartite network model for regional user access to a WebGIS. Then, based on the massive user WebGIS access logs, we clustered geographic information accessed and thereby identified hot access areas. Finally we quantitatively analyzed the access interests of regional users and the visitation volume characteristics of regional user access to these hot access areas in terms of user access permeability, user usage rate, and user access viscosity. Our research results show that regional user access to WebGIS is spatially aggregated, and the hot access areas that regional users accessed are associated with specific periods of time. Most regional user contact with hot accessed areas is variable and intermittent but for some users, their access to certain areas is continuous as it is associated with ongoing or recurrent objectives. The weighted bipartite network model for regional user WebGIS access provides a valid analysis method for studying user behaviour in WebGIS and the proposed access pattern exhibits access interest of regional user is spatiotemporal aggregated and presents a heavy-tailed distribution. Understanding user access patterns is good for WebGIS providers and supports better operational decision-making, and helpful for developers when optimizing WebGIS system architecture and deployment, so as to improve the user experience and to expand the popularity of WebGIS.
Corresponding author: wuhuayi @whu.edu.cn
1. INTRODUCTION
With the rapid development of Internet technology, Web Geographic Information Systems (WebGIS) are becoming more and more important in people's daily life.The main reason users access WebGIS is to query geographical location, traffic routes, and information about surrounding areas of a location at a specified distance (Zhang, 2004; Wu, 2004). Groups of WebGIS users display certain access patterns, implying that the regularities found in user behaviours as documented in user access records can make online behaviour empirically understandable and predictable. By analyzing users’ WebGIS access logs, we can measure user access interests and access patterns for WebGIS, to support WebGIS provider decision-making for better operations, and help developers to optimize WebGIS system architecture and deployment, thus improving the user experience and expanding the popularity of WebGIS. Therefore, the discovery of access regularities in WebGIS user access logs is significant and important for the empirical understanding of regional users.
In recent years, user access regularities in WebGIS have become an extremely active research area. Scholars have executed studies deploying basic statistical measures to online map applications (Lin, 2009); Zheng (2009) carried out a research program based on mined location-based information, such as tracked user activities using GPS trajectories, and user
geographic diaries, to help clients understand user personal lifestyle characteristics. These works can also provide recommending services based on the similarity of tracks for different users (Zeng, 2008). Xia (2014) indicated that the user access to spatial data was intermittently active during the day and relatively calm during the night; and the accessed content is spatiotemporal related. Li (2012) indicated that access to tiled spatial data (tiles) was aggregative and outburst. The researches above all focused on the individual access behaviour or group users’ access behaviour in WebGIS. However, they have not associated regional characteristics in user access behaviour with and the accessed content.
In our work, we established a weighted bipartite network model to explore regularities in regional users’ access behaviour. First, the accessed geographic information (tiles) was clustered to form hot access areas according to regional characteristics, then we analyzed the accessed interests and the regional characteristics of users when accessing hot access areas. Our results show that regional users WebGIS access patterns exhibit spatiotemporal regularity in both interests and visiting volume.
2. A WEIGHTED BIPARTITE NETWORK MODEL
FOR REGIONAL USER ACCESS TO A WEBGIS
A bipartite network is one means to represent and analyse complex networks, and is consists of two types of nodes as well
as the edges that connect nodes (Latapy, 2008). Many scholars use the bipartite network model to describe mutual relationships in the real world, such as a network for movies and actors (Watts, 1998), the network for authors and literature (Newman, 2001) and the network for audience and songs (Lambiotto, 2005). In this paper, we propose a weighted bipartite network model for regional user WebGIS access as a means to quantify the relationship between regional users and the content accessed.
The bipartite network model for regional user WebGIS access is represented as a weighted bipartite graph G
V,E , where thew in the matrix represents the weight of edge (i, j), and is the
access frequency of an individual regional user access to an individual hot access area.
Node degree is defined as the number of edges which connect the node with other nodes. In this paper,
k
ruandk
harepresent the degree of regional user nodes and the degree of hot access area nodes, respectively, as seen in Equations (1) and (2):1, 2,
, ,
1, 2,
,
edges connected to the node, in this paper,s
ruands
ha represent the strength of a regional user node and the strength of a hot access area node, respectively, as in Equations (3) and (4) :1
Figure 1 illustrates an example of a weighted bipartite network for regional users and a hot access area; it consists of eight regional user nodes and seven hot access area nodes (Ma, 2008) (Zhao, 2012). The edge weight represents the access frequency for a regional user’s access to a hot access area. As Figure 1 shows, the regional user
ru
1accessed two hot access areasha
1and
ha
2 thus the regional user’ node degree is 2 while the edge weights of the two hot access areas are 150 and 200, respectively. Thus, the strength of the regional user node is 350.Figure 1. Weighted bipartite network example for regional user and hot access area
3. CLUSTERING FOR HOT ACCESS AREA
3.1 Data sample
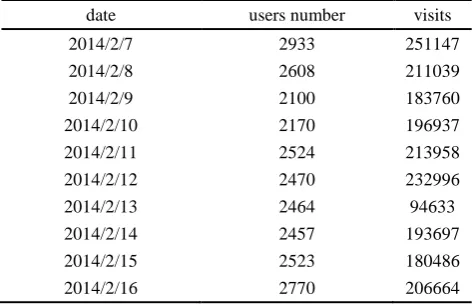
The data sample used in this paper is the access logs of user from Beijing in a public geospatial information service
“TIANDITU”. The logs are from February 7th to February 16th, 2014. The date the number of individual users visiting the site, and frequency of visits from these access logs are shown in individually, so we used a k-means algorithm (Yu, 2010) (Qiu, 2010) to cluster the accessed tiles by regional users in Beijing according to the geographic attributes of the tiles. After a number of experiments, the accessed tiles for each day are clustered into seven classes, the square sum of distance between clustered groups is 94.7% for all clustered groups; indicating whose longitude range is [114˚E, 117˚E] and the latitude range is [39˚N, 41˚N]. It also indicates that these areas are queried for location-based services more often than other areas.
Figure 2. Ratio of each individual access area and all access to WebGIS hot access areas
4. ANALYSIS OF REGIONAL USER ACCESS
PATTERNS
In this section, the weighted bipartite network for “regional user and hot access area” is used to analyze the access pattern of regional users in Beijing. Based on the user access logs from February 7th to February 16th, 2014, we established ten weighted bipartite networks for regional users and hot access areas as
G
i i1, 2,
,10
.4.1 Access interest of regional user
4.1.1 Access interest scope: In the weighted bipartite
network model, the degree of regional user node
k
ru represents the number of hot access areas that the regional user accessed.ru
k
can reflect the geographical scope of the access interests of a regional user. The regional user node degree distribution of the ten weighted bipartite networksG
i i1, 2,
,10
isshown as in Figure 3. The distribution function
P k
describesthe distribution of the node degrees that represent the probability of a randomly selected node whose degree is k (Hu, 2009).
Figure 3. Regional user node degree distribution of the ten weighted bipartite networks
The results show that the maximum degree value of the regional user nodes is seven in the ten weighted bipartite networks,
indicating that less than 0.0005% of regional users visited all hot access areas. However, there are different regional characteristics in user access to tiles: most regional users access only a few concentrated hot access areas; while at the same time a few regional users access multiple dispersed hot access areas. . The results also show that more than 85% of regional users access to only one hot access area, and that 90% of regional users access no more than two hot access areas. These results indicate that there is a spatial aggregation pattern in regional user access to tiles.
4.1.2 Interest strength in regional user access pattern: In
the weighted bipartite network model, the edge weight represents the access frequency of regional user
ru
i to hotaccess area haj . The strength of regional user node
s
rurepresents the number of total accesses, and reflects the interest strength in regional user access to tiles. The strength of the regional user node distribution of the ten weighted bipartite networks
G
i i1, 2,
,10
is shown as in Figure 4.Distribution function
P s
describes the distribution of thenode strength of a regional user, representing the probability of a randomly selected node whose strength is s (Wu, 2011).
Figure 4. Regional user node strength distribution of the ten weighted bipartite networks
Figure 4 indicates that more than 80% of regional users did less than or equal to 100 access to the WebGIS, while less than 20% of regional users did 100 to 1000 access to the WebGIS. However, interest strength distribution of regional users presents a heavy-tailed distribution.
4.2 Characteristics of regional user access to hot access areas
Based on the weighted bipartite network model for regional user and hot access area, we analyzed the hot access areas and the access regional user preferences in terms of user permeability, usage rate, and the viscosity of a hot access area.
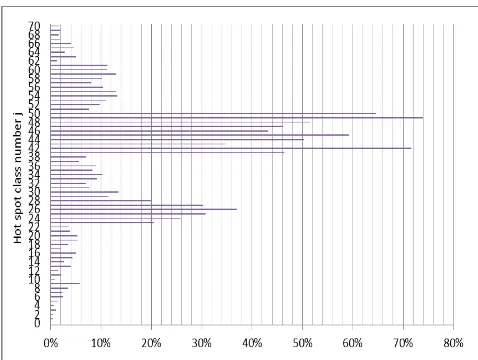
4.2.1 User permeability of a hot access area: User
permeability of a hot access area refers to the proportion of regional users who accessed the hot access area to all regional users. It indicates the popularity of a hot access area to regional users. In the weighted bipartite network model, the user permeability of hot access area hajcan be expressed as
j total number of regional users who accessed the hot access area.
/ 1, 2, , Class50 (longitude range is [114˚E, 117˚E] and latitude range is
[39˚N, 41˚N]) are high, but the user permeability of Class1 (longitude is 20˚E and latitude is 26˚N) and Class70 (longitude is 129˚E and latitude is 41˚N) are low. This shows that most regional user access is concentrated in specific hot access areas identified with hot news happenings, or in residential areas where the users are located, while a few regional users have a special goals and areas in mind when accessing WebGIS.
Figure 5. User permeability of hot access areas
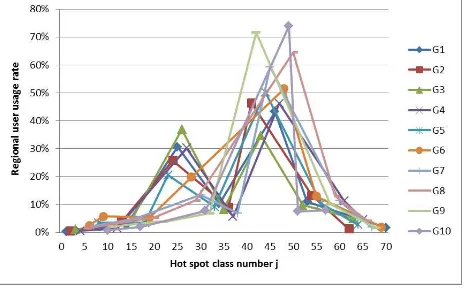
4.2.2 User usage rate of a hot access area: The user usage
rate of a hot access area refers to the ratio of access frequency of a hot access area to all access from all users in the region. In the weighted bipartite network model, the user usage rate of hot
As in Figure 6, x-axis represents the class number of hot access area, from Class1 to Class70, and y-axis represents the user
to Class50 (longitude range is [114˚E, 117˚E] and latitude range is [39˚N, 41˚N]) are high, but user usage rate of hot access area near Class1 (longitude is 20˚E and latitude is 26˚N) and Class70 (longitude is 129˚E and is latitude 41˚N) are low.
Figure 6. Usage rate of hot access areas
For different hot access areas, their regional user permeability and user usage rate are positively correlated, for example Class41 to Class50 with high regional user permeability also have high user usage rates. That indicates popular hot access areas have high usage rates. Hot access areas appear continuously across a continuous time period as seen in Figure5 and 6; the content accessed by users in a region is temporally associated.
4.2.3 Access viscosity of regional user: Access viscosity of
a regional user is defined as the average access frequency of a hot access area. We find that the higher the access viscosity, the greater the popularity of a hot access area. In the weighted bipartite network model, the access viscosity of a regional user to a hot access area haj is (longitude 129˚E and latitude 41˚N) are high, while the regional user access viscosities of Class22 to Class36 (longitude range is
[107˚E, 118˚E] and latitude range is [16˚N, 23˚N]) and Class41 to Class50 (longitude range is [114˚E, 117˚E] and latitude range is [39˚N, 41˚N]) are low.
Figure 7. Regional user viscosity rate for hot spots
These results indicate that there are huge numbers of users that access some hot access areas, but with a low average access frequency and lower access viscosity; however there are a few users who access some access areas with high access viscosity and a higher average access frequency. This indicates that access from most users to hot access areas is not consecutive, while at the same time, access from some users, with a clear purpose or goal, to specific areas is consecutive.
5. CONCLUSION
In this paper, the weighted bipartite network for regional user and hot accessed areas was used to describe the relationship between regional user access and hot access areas. Based on WebGIS access logs from regional users in Beijing from February 7th to February 16th in 2014, we analyzed the access interests of regional user and characteristics of regional users when visiting hot access areas. The proposed weighted bipartite network can be used in studying user behaviour in WebGIS, to quantitatively analyse user access characteristics. The proposed access patterns present a spatiotemporal aggregated of access interests, as interest strength of regional users presents a heavy-tailed feature; popular hot access areas have high usage rates and the content accessed by users in a region is temporally associated; access from most users to hot access areas is not consecutive, while access from some users with a special purpose to specific areas is consecutive. The research results provide an empirical reference a support for WebGIS decision making and planning. In future work, we will study the model of regional user access patterns, to mine more of user access feature patterns in different regions, especially focusing on the spatiotemporal characteristics in user access patterns.
ACKNOWLEDGEMENTS
Authors thank National Geomatics Center of China and
“TIANDITU” for supporting this work. And this work was supported by the National Natural Science Foundation of China (Grant No. 41371370).
REFERENCES
Zhang, A., Zhong, S., 2004. The current situation and development trends of Web maps. Yantai Normal University Journal (Natural Science Edition), 20(2), pp. 137-139.
Wu, X., Ren, F., 2004. The Status Quo and Developing Trend of Electronic Maps under the Condition of New Technology. Geomatics & Spatial Information Technology, 27(6), pp. 75-78.
Lin, S., Gao, Z., Xu, K., 2009. Web 2.0 traffic measurement: analysis on online map applications. In: Proceedings of the 18th international workshop on Network and operating systems support for digital audio and video. ACM, pp. 7-12.
Xie, X., Zheng, Y., 2009. Understanding User Behavior Geospatially. Contextual and Social Media Understanding and Usage.
Ye, Y., Zheng, Y., Chen, Y., et al, 2009. Mining individual life pattern based on location history. In: Mobile Data Management: Systems, Services and Middlewar. pp. 1-10.
Li, Q., Zheng, Y., Xie, X., et al, 2008. Mining user similarity based on location history. In: Proceedings of the 16th ACM SIGSPATIAL international conference on Advances in geographic information systems. ACM, pp. 34.
Xia, J., Yang, C., Gui, Z., Liu, K., Li, Z., 2014. Optimizing an index with spatiotemporal patterns to support GEOSS Clearinghouse, International Journal of Geographical Information Science, 28 (7), pp. 1459-1481.
Li, R., et al, 2012. A prefetching model based on access popularity for geospatial data in a cluster-based caching system. International Journal of Geographical Information Science, 26 (10), pp. 1831–1844.
Latapy, M., Magnien, C., Vecchio, N., 2008. Basic notions for the analysis of large two-mode networks. Social Networks, 30, pp. 31—48.
Watts, D., Strogatz, S., 1998. Collective dynamics of small world networks. Nature, 393, pp. 440-442.
Newman, M., 2001. Scientific collaboration networks network construction and fundamental results. Physical Review E, 64, pp. 016131.
Newman, M., 2001. Scientific collaboration networks. II. shortest paths, weighted networks, and centrality. Physical Review E, 64, pp. 016132.
Lambiotte, R., Ausloos, M., 2005. Uncovering collective listening habits and music genres in bipartite networks. Physical Review E, 72, pp. 066107.
Ma, W., Li, Y., Ma, J., 2008. Empirical Study of Region User Behaviors for Web Pages. Chinese Journal of Computers, 31(6), pp. 960-967.
Zhao, G., Lai, W., Xu, C., Tang, H., 2012. Analysis of User Behavior in Mobile Internet Using Bipartite. In: The 8th International Conference on Mobile Ad-hoc and Sensor Networks, Chengdu, China, pp. 40-46.
Yu, Z., Wong, H., 2010. Quantization-based clustering algorithm. Pattern Recognition, 43(8), pp. 2698-2711.
Qiu, D., 2010. A comparative study of the k-means algorithm and the normal mixture model for clustering: bivariate homoscedastic case. Journal of Statistical Planning and Inference, 140(7), pp. 1701-1711.
Hu, Y., Zhu D., 2009. Empirical analysis of the worldwide maritime transportation network. Physica A, 388(10), pp. 2061-2071.
Wu, X., Yu, K., Wang X., 2011. On the growth of Internet application flows: A complex network perspective. In: Proceedings of the INFOCOM, Shanghai, China, pp. 2096-2104.