Model Policy Design for the Beef CattleDevelopment
in South Sulawesi
MachmudAchmad
PhD Student School of Management and Business,
Bogor Agricultural University, Indonesia
[email protected]
Sri Hartoyo
School of Management and Business.
Bogor Agricultural University, Indonesia
BustanulArifin
Professor at Lampung University (UniLa), Indonesia
[email protected]
Muhammad Said Didu
Researcher at the Institution for Research and Technology Implementation,
Jakarta, Indonesia
[email protected]
Abstract
The main objective of this study is to examine the existing condition of the ranchers, namely economic and social characteristics related to the development of beef cattle. It examines factors influencing policies on developing cattle beef and designing integrated planning systems in South Sulawesi. The method for this study includes qualitative and quantitative approaches using survey method to obtain primary data. Data were analysed and presented in the form of descriptive tables graphs with analytical tools policy.
Results were obtained from choices of recommendations, elaborated in the form of strategy and policy implications based on expert opinions (expert judgment), Internal and External Matrices with the SWOT analysis and the QSPM. Results shows that current position for beef cattle in South Sulawesi is in grow and build. By analysing all the factors from SWOT further, four strategies were developed to determine the beef cattle policy strategy. Using the QSPM, results further suggests that the best strategy is to develop.
An integrating system between the beef cattle rancher and crop (rice and corn), the strategy also implies that in order to achieve this goal, technology improvement and innovation play important keys, especially technology for the feed processing system.
Keywords: Beef Cattle, IFE EFE matrix, SWOT and QSPM, South Sulawesi
INTRODUCTION
The South Sulawesi Provincial Office of Livestock Services will launch a program entitled A Movement for the Targeted 1 Million Cattle Population to 2013 in support the national program for self-sufficiency in beef for 2014. This is consistent with the South Sulawesi Provincial Office of Livestock Services, as the vision jurisdiction of for the main supplier of beef cattle and cows. The vision implies that livestock sector can increase population and genetic quality of cattle. Furthermore, cows are expected to have similar quality as local resources.
The Bali cattle, which have been developed in South Sulawesi, have been proven to be well adapted to the local agro-climatic conditions. Furthermore, the Brahman and Limousine cattle were also raised to support the increase in number of beef cattle and cow population.
Beef cattle farming in Indonesia serve a very strategic function especially in providing employment opportunities for rural communities, as a producer of meat for human wellbeing and to meet customer needs, all of which intended to improve the people’s quality of life and of intellectual (Santosa 2006).Therefore, empowering rural communities through community-based beef cattle breeding is a necessary, particularly in the province of South Sulawesi. The achievement of Accelerated Beef Sufficiency Program (P2SDS) 2014 requires more support to establish steps in order to implement the program. This is the reason for the author to conduct the study.
Beef cattle ventures in Indonesia generally took the form of traditional ranches and serves only as a side activity which thus carried out on less optimal basis. This contributes relatively small income to farming households. Such non-optimal beef cattle farming also relate, to the lack of labour employed, green fodder, capital, and marketing. Thus placing farmers in a non-bargaining position and explains the less optimal revenue from marketing.
The government has long enforced the policy of beef cattle development. A study by Nasution (1983) indicated that for cattle development efforts two policies have been implemented;intensification. The former put emphasize on the increase in number of cattle supported by the procurement of improved quality cows, disease prevention, business counselling and coaching, credit assistance, procurement and improvement of feed quality, marketing and partnership building with the stakeholders. The latter was implemented by increasing the economically viable production, supported by a particular combination through the use of superior cows and feed, as well as good management.
The study aimed to examine the existing characteristics of the farmers, i.e. their social and economic characteristics in relation to the development of beef cattle farming, to determine factors influencing the policy of beef cattle farming, and to design the policy of beef cattle farming development in South Sulawesi. The study is intendeds to contribute the development of science, particularly in management discipline and beef cattle business; to contribute data and information and ideas in relation to sustainable farm resource management planning; to provide inputs for policy makers, both at the central and local governments, and to develop the management plan for beef cattle development in order to fulfil the national food security needs.
Literature Review
Development of beef cattle carried out jointly by the government, communities (small scale farmers), and the private sectors. The government sets the rules, facilitates and oversees the supply and availability of products, quantity and quality, to meet the requirements of halal, safe, nutritious, and health concern. Private and public play their role in bringing about the adequacy of livestock products through the production, importation, processing, marketing, and distribution of beef cattle (Bamualim et al. 2008).
In order to increase the income and to protect the people’s breeding farm, there are some policies measures take that should place. They include tariff, subsidies, capital, institutional, and maintenance system.Agribusiness policy analysis is a process, which synthesizes information recommendations to design agricultural policy options. Policy analysis is processes to synthesize mixed information, derived from the research, mass media or laws, which then formulate further a policies to encourage the advancement of agriculture and plantation. Therefore, it requires a comprehensive formulation to make it one of the driving forces of economic growth in Indonesia based on the economic results of the agricultural sector (Nugrohadi, 2009).
storage and processing, and distribution and marketing of farm products, supported by the supporting institutions (Rahardi and Hartono, 2003).According to Saragih (2000), livestock-based agribusiness is a system that includes four subsystems; up stream, on-farm, down-stream agribusiness and supporting institutions.
Framework
Beef cattle are among the renewable natural resources, which are potential to economic improvement. Therefore further, policies are needed for animal husbandry development through intensification (procurement and improving the quality of cows, feed, disease control, credit and marketing as well as intensification (increasing economic production, use of quality cattle, feed and management). Government policies such as development programs for Beef Cattle Livestock Enterprises through an Integrated System of Livestock-Paddy (SIPT), Integrated System of Beef Cattle-Palm Plantation (SISKA), Movement for Beef Cattle Optimization (GOS), Integrated Agribusiness Group (KUAT), Farming and Livestock Development in Eastern Indonesia (PUTKATI), Acceleration Program for Beef Self-Sufficiency (P2SDS), Movement for Beef Cattle Population Achievement (PGP2S), and partnership schemes, are all expected to contribute significantly to the welfare of the farmers.
RESEARCH METHOD
This study uses two types of data, which are primary and secondary data. Primary data were obtained using questionnaires, interviews and focus group discussions. Conducting literature review to support, complement, and enhance primary data collected secondary data.Descriptive analysis is used to obtain in-depth overview of the study object. To help explain the results of this analysis, the information will be presented in the form of tables, pictures, or matrix. The descriptive analysis in this study is used to describe the results of interviews and questionnaires on beef cattle development policies. Analysis of the above data is processed using SPSS software.
External Factor Evaluation (EFE) Matrix
External Factor Evaluation (EFE) Matrix is used to evaluate the external factors that determine the success of a company in competition. The relevant external data are collected for analysis. These factors are related to economic, social, cultural, demography, environment, politic, government, legal, technology, and competition in industrial markets where the company is located, and other relevant external data. This is important because external factors have direct or indirect influence on the company.
Internal Factor Evaluation (IFE)
Internal Factor Evaluation (IFE) Matrix is used to determine the internal factors that affect the competitiveness of a company, which deals with the strengths and weaknesses deemed important. Data and information on the internal aspects of the company can be obtained from company’s functions, such as aspects of management, finance, human resources (HR), marketing, information systems, production and operation.
IE Matrix
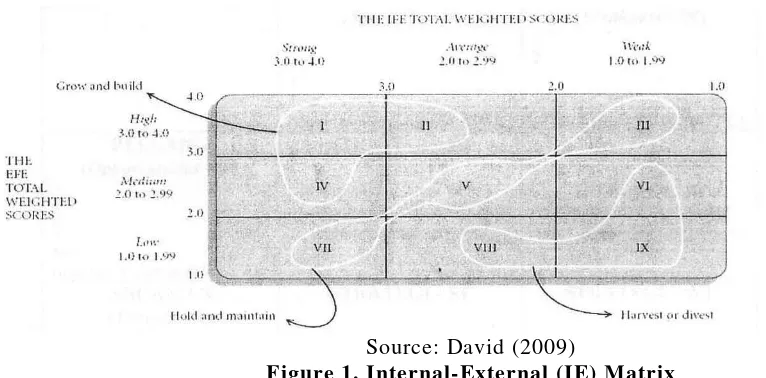
Internal-External (IE) matrix is used to evaluate external factors (opportunities and challenges) and internal factors (strengths and weaknesses) that results in a matrix form consisting of 9 cells that in principle can be grouped into 3 main strategies, namely:
1. Growth strategy is the company's growth (cells 1, 2 and 3) or diversification (cells 7 and 8).
2. Stability strategy is a strategy adopted without changing the direction of the predetermined strategy.
The Internal-External (IE) Matrix is illustrated in Figure 1 below:
Source: David (2009)
Figure 1. Internal-External (IE) Matrix
IE matrix is based on two key dimensions: EFI total weighted score is on the horizontal axis and the EFE total weighted score is on the vertical axis. Of the total weighted score, each division IE Matrix at the corporate level can be composed, on the horizontal axis of IE Matrix, the EFI total weighted score from 1.0 to 1.99 indicates a weak internal position; score from 2.0 to 2, 99 is considered moderate, and score of 3.0 to 4.0 considered as strong. This hold true for vertical axis, where the EFE total weighted score of 1.0 to 1.99 considered as low; 2.0 to 2.99 as moderate, and 3.0 to 4.0 as high.
SWOT Analysis
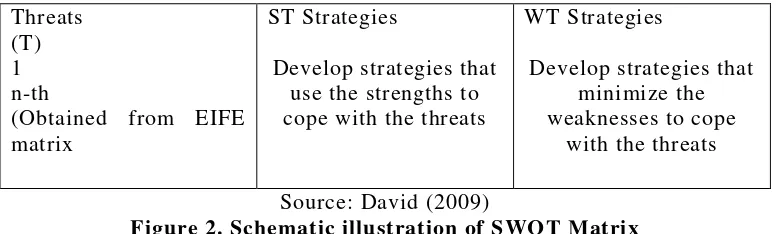
Analysis instrument used in this phase is the matrix of SWOT (Strengths-Weaknesses-Opportunities Threats). Matrix combines the opportunities and threats that are being faced can be further tailored according to the existing strengths and weaknesses to produce SO, WO, WT, or ST strategy.
SWOT Analysis is a powerful analytical instrument if used accordingly. "SWOT" stands for Strengths, Weaknesses, Opportunities, and Threats. The strength and weaknesses can be found in an organizational body, including the particular business unit, while opportunities and threats are environmental factors that confront organizations, companies or business units in question (Siagian, 2004).
SWOT matrix scheme consists of nine cells; where there are four cells of main factors (external and internal), four cells of strategy, and one cell that is always left empty (Figure 2).
Strengths (S) 1 n-th
(Obtained from IFE Matrix
Weaknesses (W)
1 n-th
(Obtained from IFE matrix)
Opportunities (O)
1 n-th
(Obtained from EIFE matrix
S-O Strategies
Develop strategies that use the strengths to capture opportunities
WO Strategies
Develop strategies that minimize the weaknesses to take
Threats
Figure 2. Schematic illustration of SWOT Matrix
SWOT matrix preparation steps are described as follow:
1. Each of these external factors (opportunities and threats) and internal factors (strengths and weaknesses) of the EFE and IFE matrix are included in the SWOT matrix.
2. Using in-depth discussions with experts, adjustments are then carried out between external and internal factors to produce and to formulate several alternative drafts of policy of on farms beef cattle development in South Sulawesi.
a. To match internal strengths with external opportunities (SO strategies) b. To match internal weaknesses with external opportunities (WO strategy) c. To match internal strengths with external threats (ST strategy)
d. To match internal weaknesses with external threats (WT strategy)
QSPM (Qualitative Strategic Planning Matrix) Analysis
QSPM (Qualitative Strategic Planning Matrix) analysis indicates objectively best alternative strategies that begins by determining the key success factors of the external environment with External Factor Evaluation (EFE) Matrix and finding the key success internal factors to companies with Matrix Internal Factor Evaluation (IFE) as the input of stage I.
The next step is adjustment or phase II, which is analyse strengths, weaknesses, opportunities and threats using the SWOT matrix, analysis of internal and external with Internal-External (IE) Matrix and positions the company under investigation in one of the existing quadrants. QSPM uses input from the analysis of stage I and the results of phase I and phase II analysis adjustment, to determine objectively among alternative strategies existed or referred to as phase III.
Furthermore, David (2009) noted that QSPM is an instrument that allows strategists to evaluate alternative strategies objectively, based on the internal and external key success factors that have been identified. Like other instruments of strategy formulations, strategy formulation using QSPM method requires good intuitive judgment.
The decision stage is a stage to determine which strategy is feasible and the best alternative strategies, using Quantitative Strategic Planning Matrix (QSPM) or Quantitative Strategic Planning Matrix. QSPM uses the analysis results of the input and matching phases. QSPM main components are: a) the key factors, b) alternative strategies, c) weights, attractiveness Score (AS), e) total attractiveness score (TAS), and f) sum total of Attractiveness Score.
Attractiveness score is obtained by determining the numeric score indicating the relative attractiveness of each strategy in particular alternative set. Attractiveness scores were assigned to each strategy to determine the relative attractiveness of one strategy over the other. On the contrary, the total attractiveness score is the score indicating a relative attractiveness of each alternative strategy that considers the impact of external and internal factors in that line. The higher the total score of attractiveness, the more attractive the alternative strategies will be.
RESULT AND DISCUSSION
Analysis on Internal and External Factors
1. External Factor Evaluation (EFE Matrix)
Sulawesi. The total weight score, which is 3.487, is higher than average score of effective strategy of 2.5, implies that the strategies used are already effective by using existing opportunity while minimizing threat. This is consistent with Nugroho (2006) findings, which states that the development of animal husbandry as a part of agricultural development will be associated with the reorientation of agricultural development policy. Animal husbandry development has new paradigms, namely alignment to people in general, responsibility delegation, structural change, and people empowerment. Therefore, it is necessary to formulate strategies and policies that are comprehensive, systematic, integrated—both vertically and horizontally—competitive, sustainable and decentralized.
Table 1 EFE Matrix (External Factor Evaluations)
External Strategies Factor Weight Rating Score
Opportunities
Improved knowledge of ranchers and technology
development 0.072 3.88 0.280
Government support to develop beef cattle 0.082 4.00 0.328
Develop opportunities to work 0.061 3.88 0.236
Availability of sufficient transportation system 0.058 3.13 0.182 High potential feed availability 0.077 3.98 0.335 Crop intensification with hay being used 0.074 3.93 0.304 Increasing trend for beef consumption and demand 0.067 3.50 0.234
Mutual benefit for partnership 0.065 3.50 0.228
High number of population 0.055 3.75 0.207
Total Opportunities 2.335
Threats
Availability of imported product with higher beef
quality 0.063 3.00 0.188
High transportation cost 0.060 2.75 0.179
Global marketing toward free marketing 0.065 3.25 0.178 Low bargaining position of beef cattle rancher
which reduces economic scale 0.064 2.75 0.207
Tendency of people with higher education to find
work else where 0.061 2.63 0.168
Low level of cattle safeties 0.077 2.63 0.203
Total Threats 1.123
Total 1.000 3.457
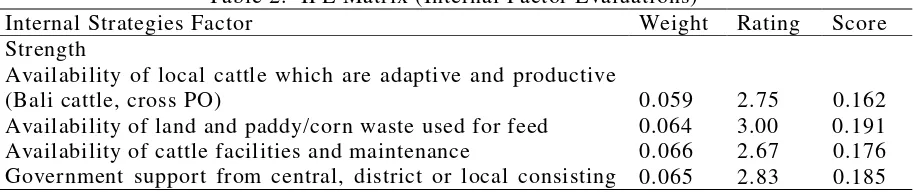
2. Internal Factor Evaluation (IFE matrix)
Internal Factor Evaluations (IFE) matrix is being used to determine the weight value for strength and weakness for internal factors affecting the development of beef cattle in South Sulawesi. From Table 2, it can be seen that the highest weight score is 0.666, which implies that factors that are effective are innovation, technology, maintenance and facilities. These factors are important internal factors, which are effective to develop the beef cattle in South Sulawesi to support the food estate program. The result also shows that the sum of total weight score is 2.603. Therefore, it can be concluded that the strategy of developing beef cattle in South Sulawesi has been effective in using the strength and minimizing weakness factors which had contributed to negative impact.
Table 2. IFE Matrix (Internal Factor Evaluations)
Internal Strategies Factor Weight Rating Score
Strength
Availability of local cattle which are adaptive and productive
(Bali cattle, cross PO) 0.059 2.75 0.162
developing programs (such as GOS, SIPT, PPBP, PUTKATI)
High interest for cattle beef development from society 0.056 2.50 0.140 Availability of cattle beef institutions as a leader 0.052 2.58 0.135 Availability of flexibility technology innovations 0.066 2.75 0.182
Availability of cattle beef groups 0.054 2.75 0.148
Total Strength 1.582
Weakness
Financial limitation for cattle beef ranchers 0.064 1.92 0.123
Limitation of local cattle breed 0.060 2.08 0.125
No coordination between institutionsevolved 0.050 1.67 0.084 Low knowledge and limitations for human resources 0.063 1.58 0.100 Unavailability support from financial institutions 0.058 1.67 0.096 Limitations of supporting institutions related to cattle beef 0.055 1.92 0.105 Not optimized and inconsistency of programs related 0.067 1.58 0.106
Uncoordinated marketing system 0.053 1.50 0.080
Rancher’s mind-set where cattle are as if saving product 0.048 1.67 0.081
Total Weakness 1.021
Total 1.000 2.603
Suryana (2009) in his study also stated that in order to enhance the role of beef cattle as meat suppliers and livestock income sources, it is advisable to apply an intensive maintenance system with an improved feed management and improved quality of cattle with disease control. IB and early weaning of calves to shorten the calving interval conducted improvement of reproduction. As for the improvement of genetic quality of the female calves, it is suggested to keep them in the breeding area for subsequent use as grading up cattle. Increased interest and motivation of cattle ranchers to expand their business can be facilitated through incentives in production.
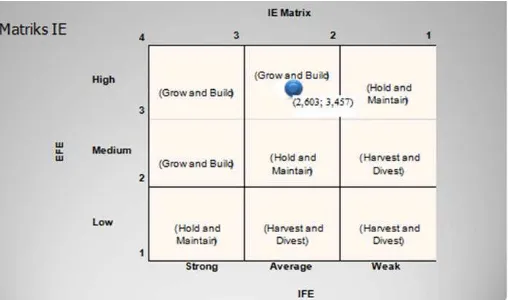
Mapping of Internal External Matrix (IE matrix)
The EFE matrix andIFE matrix, which have been completed, using the weighting scoring system, are then being integrated into the external and internal matrices. These matrix shows that the mapping or position for beef cattle development in South Sulawesi, considering the strength and weaknesses factors involved. Figure 4 shows that based on weighted score and the evaluation of internal and external factors, the position for cattle beef development in South Sulawesi lies at the position havegrown and build.
The position of 2.603 and 3.457 is the area were based on external and internal factors, the government policy should be aimed at intensive programs, such as market penetration, market development and developing products. The other government policy should also be aimed at integration programs such as backward integration, forward integration and product integration (David, 2009). In addition policy aimed at beef cattle development in South Sulawesi for food security program is highly required.
An alternative incentive government policy that can be implemented for product development in South Sulawesi, is product diversification, which are programs involving processing meat, such as beef bacon, beef jerky, shreddedbeef, sausages or other tradition processed meat products. These types of programs could help improved local ranchers wellbeing and income. Integrative government policies could also develop an increase beef cattle program in South Sulawesi.An example would be a policy that integrates beef cattle with crops. The program involves using corn and rice waste, which are potential for cattle feed, using improved technology. Other government policies should focus in order to increase the development of beef cattle, with other stakeholders such as government, companies, ranchers or other local rancher groups.
Formulating Alternative Strategies
In order to formulate alternative strategies based on external and internal factors, these alternative strategies are being formulated using the SWOT method. Expert opinions are being used to formulate these strategies, which were then being analysed based on factors of strength, weakness, opportunity and threat in the South Sulawesi faced by beef cattle development. The results can be seen as follows:
SWOT Matrix strategy development formulations for cattle beef in South Sulawesi Strength
1. Availability of local cattle which are adaptive and productive (Bali cattle, cross PO) 2. Availability of land and paddy/corn waste used for feed
3. Availability of cattle facilities and maintenance
4. Government support from central, district or local consisting developing programs (such as GOS, SIPT, PPBP, PUTKATI)
5. High interest for cattle beef development from society 6. Availability of cattle beef institutions as a leader 7. Availability of flexibility technology innovations 8. Availability of cattle beef groups
Weakness
1. Financial limitation for cattle beef ranchers 2. Limitation of local cattle breed
3. No coordination between institutions evolved
4. Low knowledge and limitations for human resources 5. Unavailability support from financial institutions
6. Limitations of supporting institutions related to cattle beef 7. Not optimized and inconsistency of programs related 8. Uncoordinated marketing system
9. Rancher’s mind-set where cattle are as if saving product
Opportunity
1. Improved knowledge of ranchers and technology development 2. Government support to develop beef cattle
3. Develop opportunities to work
4. Availability of sufficient transportation system 5. High potential feed availability
6. Crop intensification with hay being used
7. Increasing trend for beef consumption and demand 8. Mutual benefit for partnership
9. High number of population
Strength and Opportunity Strategies
SO1. (S1, S2, S3, S4, O1, O2)
Weak and Opportunity Strategies
WO 1. (W3, W4, W5, O1, O2, O6)
Optimizing government role by supporting programs, which increase agribusiness potential with an integration system, increasing knowledge and ability of ranchers by training programs and assistance.
Threat
1. Availability of imported product with higher beef quality 2. High transportation cost
3. Global marketing toward free marketing
4. Low bargaining position of beef cattle rancher which reduces economic scale 5. Tendency of people with higher education to find work else where
6. Low level of cattle safeties
Strength and Threat Strategies
ST 1. (S1, S2, S3, S7, T1, T4, T6)
Increasing product and cattle quality and meat through several technology innovations, product diversification in order to increase market target and increasing the role of safe guards to guarantee the cattle safeties.
Weak and Threat Strategies
WT 1. (W1, W2, W3, W5, T1, T5, T6)
Restrict imports of livestock or products, while enhancing partnerships with financial institutions to improve the financing of farmers.
Results using SWOT Matrix show four alternatives developing policy for cattle beef in South Sulawesi. These 4 quadrants analysis are considered to be a powerful tool to identify potential policies to be developed by ranchers in South Sulawesi, are as follow:
1. Developing an integration strategy involving ranchers and crops (rice and corn). This can be achieved using potential raw materials for feed with government support (central government, province or local) by using new developed technology or innovation specially for feed processing.
2. Increasing product and cattle quality and meat through several technology innovations, product diversification in order to increase market target and increasing the role of safe guards to guarantee the safeties of cattle.
3. Optimizing government role by supporting programs, which increase agribusiness potential with an integration system, increasing knowledge and ability of ranchers by training programs and assistance.
4. Limiting cattle import or products while increasing the partnership with financial institutions to increase rancher’s finance.
Choosing Priority Strategy
QSPM (Quantitative Strategic Planning Matrix) is made in order to choose and determine which strategy is the best to recommend to cattle beef development in South Sulawesi. Based on SWOT Matrix analyses, these strategies chosen to be implement to the real condition of beef cattle.
The formulation of these strategies is based on interviews of experts. Values given by experts are then calculated to find the whole score of all criteria’s. The highest score will be the priority strategy. From all four strategies, based on QSPM matrix results (in Table 1 and Table 2) shows that the first strategy or priority will be Strategy 1. The value from QSPM, based on Total Alternative Strategy (TAS) is 6,901. This priority strategy includes, increasing and developing a model between cattle beef and crop (paddy and corn), based on the potential availability of feed. This model should support by government (central, district, local) using advanced technology, which aimed at feed processing innovations. Table 3 shows these results.
Table 3. QSPM Results for Choosing Priorityt Strategy
Strategies Factor
Strategies
These findings are consistent with results from Ananto et. all (2011) which suggested that strategies should be integrated in order to succeed. Furthermore in his research, he concluded that the prerequisites for the fulfilment of an integrated plan for self-sufficiency in beef production include: (1) trading system which is conducive to the creation of value-added livestock industry, (2) defined policy of sectorial farm program, and (3) the availability of budget for cow-calf operation, breeding and the development of the breeding areas. As for the implementation phase, the institutions that play most significant roles are Coordinating Ministry for Economic
AS TAS AS TAS AS TAS AS TAS
Strength
Availability of local cattle which are adaptive
and productive (Bali cattle, cross PO) 0.059 4 0.236 3 0.177 4 0.236 4 0.236
Availability of land and paddy/corn waste
used for feed 0.064 4 0.254 4 0.254 4 0.254 4 0.254
Availability of cattle fasilities and
maintenance 0.066 4 0.264 3 0.198 3 0.198 3 0.198
Goverment support from central, district or local consisting developing programs (such as
GOS, SIPT, PPBP, PUTKATI, etc) 0.065 4 0.261 4 0.261 4 0.261 4 0.261
High interest for cattle beef development from
society 0.056 4 0.225 3 0.168 3 0.168 3 0.168
Availability of cattle beef intitutions as a
leader 0.052 4 0.208 4 0.208 3 0.156 3 0.156
Availability of flexibility technology
innovations 0.066 4 0.264 4 0.264 4 0.264 4 0.264
Availability of cattle beef groups 0.054 3 0.162 4 0.216 3 0.162 3 0.162
Weakness
Financial limitation for cattle beef ranchers 0.064 4 0.256 3 0.192 3 0.192 3 0.192
Limitation of local cattle breed 0.06 4 0.240 4 0.240 4 0.240 4 0.240
Uncoordination between intitutions envolved 0.05 4 0.202 4 0.202 3 0.151 3 0.151
Low knowledge and limitations for human
resources 0.063 4 0.253 3 0.189 3 0.189 3 0.189
Unavailability support from financial
intitutions 0.058 3 0.173 4 0.230 3 0.173 3 0.173
Limitations of supporting institutions related
to cattle beef 0.055 3 0.164 4 0.219 3 0.164 3 0.164
Unoptimazed and inconsistency of programs related
Uncoordinated marketing system 0.067 4 0.267 4 0.267 4 0.267 4 0.267
Rancher’s mindset where cattle are as if
saving product 0.053 3 0.160 3 0.160 4 0.213 4 0.213
Weakness
0.048 3 0.145 3 0.145 3 0.145 3 0.145
Opportunities
Improved knowledge of ranchers and
technology development 0.072 4 0.290 4 0.290 4 0.290 4 0.290
Goverment support to develop beef cattle 0.082 4 0.328 4 0.328 4 0.328 4 0.328 Develop opportunities to work 0.061 4 0.244 2 0.122 2 0.122 2 0.122
Availability of sufficient transportation system 0.058 3 0.174 3 0.174 3 0.174 3 0.174
High potential feed availability 0.077 4 0.307 4 0.307 4 0.307 4 0.307
Crop intensification with hay being used 0.074 4 0.295 4 0.295 4 0.295 4 0.295
Increasing trend for beef consumtion and
demand 0.067 3 0.201 3 0.201 3 0.201 3 0.201
Mutual benefit for partnership 0.065 3 0.195 4 0.260 3 0.195 4 0.260
High number of population 0.055 2 0.110 2 0.110 3 0.166 2 0.110
Threats
Availability of imported product with higher
beef quality 0.063 3 0.188 3 0.188 4 0.250 3 0.188
High transportation cost 0.060 3 0.179 3 0.179 3 0.179 3 0.179
Global marketing toward free marketing 0.065 2 0.130 3 0.194 3 0.194 3 0.194
Low bargaining position of beef cattle rancher
which reduces economic scale 0.064 3 0.191 3 0.191 3 0.191 3 0.191
Tendency of people with higher education to
find work else where 0.061 3 0.183 3 0.183 2 0.122 3 0.183
Low level of cattle safetyness 0.077 2 0.155 3 0.232 4 0.310 3 0.232
Affairs, together with the Ministry of Agriculture and Ministry of Commerce (Ananto et. all, 2011)
CONCLUTION
The study shows that the condition of cattle beef development in South Sulawesi is promising. The SWOT analysis concludes that based on weighted score and the evaluation of internal and external factors, the position for cattle beef development in South Sulawesi lies at the position of grow and build. Therefore, government policies should focus on increasing and developing cattle beef programs, incentives and supporting policies.
Furthermore, based on interviews with experts on strength, weakness, opportunity and threat factors, four strategies were then being formulated in order to develop the cattle beef in South Sulawesi. From these four strategies, QSPM matrix results shows that the first strategy or priority strategy will be Strategy 1. This strategy has the highest value compared to the other strategies, based on Total Alternative Strategy (TAS). This priority strategy includes, increasing and developing a model between cattle beef and crop (paddy and corn), based on the potential availability of feed. This model should support by government (central, district, local) using advanced technology, which aimed at feed processing innovations.
This study recommends that the government should play more active role, especially institutions that are involved directly with the cattle beef programs. There should be an integrated, coordinated and consistency within the program. The institutions related to cattle beef rancher should be more aggressive in recruiting and maintaining ranchers. However, the study also recommends that the government should continue with existing programs that had been applied.
REFERENCES
[1] Ananto N, Eriyatno, Marimin, Arief D., (2011), Model Integration Policy Development Planning Livestock - Beef Case Study of Self-Sufficiency. Journal of Development Planning, 17 (3)
[2] Bamualim AM, Trisnamurti B, C Talib.,(2008), Beef Cattle Development Direction in Indonesia Journal of Agricultural Research 12 (2): 22-28.
[3] David, FR, (2009), Strategic Management: Strategic Management: Concepts 12th edition Translation by DonoSunardi . Jakarta: SalembaEmpat .
[4] Diwyanto K, A. Priyanti and IsmethInounu., (2005), Prospects and direction of development of livestock commodities: Poultry, cattle and goat - sheep. Wartazoa pp.11-25. [5] Nasution, A., (1983), Commodity Systems Animal Protein, Agro Economic Forum, Vol. 2,
No. 2: 29-42 .Agro Economic Research Centre AARD. Bogor.
[6] Nugrohadi IAW.,(2009), Agribusiness Policy Analysis. Lecture Materials Doctoral Programme in Business Management IPB [Not published]
[7] Nugroho BA, (2006), Agribusiness development patterns support productive economic activities (Studies in North Sulawesi), Journal of Agricultural Research (16):62 - 72 .
[8] Rahardi FR, Hartono., (2003), Agribusiness Livestock, Jakarta: PenebarSwadayapp33. [9] Santosa U, (2006), Development of Bali cattle in the Livestock Management, Journal of
Agricultural Research 22 (2 ) : 34-40 .