Methane Emission Factors for Enteric Fermentation in Beef Cattle using
IPCC Tier-2 Method in Indonesia
Widiawati Y1, Rofiq MN2, Tiesnamurti B3
1Indonesian Research Institue of Animal Production, PO Box 221, Bogor 16002
2Center for Agricultural Production Technology-Agency for the Assessment and Application Technology
Building 610, Puspiptek Region-Serpong 15314
3Indonesian Center for Animal Research and Development
E-mail: [email protected]
(received 04-04-2016; revised 13-06-2016; accepted 24-06-2016)
ABSTRAK
Widiawati Y, Rofiq MN, Tiesnamurti B. 2016. Pengaruh emisi gas metana untuk fermentasi enterik pada sapi potong menggunakan metode Tier-2 IPCC di Indonesia. JITV 21(2): 101-111. DOI: http://dx.doi.org/10.14334/jitv.v21i2.1358
Gas metana dari enterik fermentasi termasuk ke dalam sub-kategori yang menjadi perhatian di sektor pertanian oleh UNFCCC. Oleh karena itu, Indonesia perlu mengembangkan faktor emisi (FE) untuk gas metana enterik dengan menggunakan metode Tier-2 sebagai FE spesifik negara. Populasi sapi potong merupakan populasi terbesar diantara ternak ruminansia besar lainnya. Sehingga memberikan kontribusi gas metana enterik yang cukup signifikan diantara ternak lainnya. Tujuan dari kegiatan adalah untuk menentukan nilai FE metana enterik dari sapi potong dengan menggunakan metode Tier-2.Nilai FE ini selanjutnya digunakan untuk menghitung emisi metana enterik dari sapi potong di Indonesia. Data populasi sapi diambil dari BPS, data kandungan energi pakan, konsumi dan kecernaan pakan dikompilasi dari hasil analisa laboratorium dan data yang sudah dipublikasi. Sapi lokal mempunyai nilai FE yang berbeda diantara sub-kategori lainnya dan berkisar dari 18,18 sampai 55,89 Kg CH4/ekor/tahun, dengan rata-rata 36,75 Kg/ekor/tahun. Nilai FE untuk sapi impor (25,49 kg CH4/ekor/tahun) lebih rendah daripada rata-rata sapi lokal. Secara keseluruhan, nilai FE nasional untuk sapi potong yang dihitung dengan metode Tier-2 adalah 33,14 kg CH4/ekor/tahun lebih rendah dari default FE yang terdapat dalam buku IPCC Tier-2006 untuk wilayah Asia (47 kg CH4/ekor/tahun). Kesimpulannya adalah bahwa nilai FE yang dihitung menggunakan metoda Tier-2 dengan menggunakan data lokal Indonesia lebih mendekati kondisi peternakan yang sebenarnya di Indonesia. Penelitian kedepan masih diperlukan terkait penentuan nilai FE untuk setiap bangsa sapi potong dan setiap system pemeliharaan yang sangat bervariasi diantara provinsi di Indonesia.
Kata Kunci: Faktor Emisi Metana, Fermentasi Enterik, Sapi Potong, Tier-2 IPCC
ABSTRACT
Widiawati Y, Rofiq MN, Tiesnamurti B. 2016.Methane emission factors for enteric fermentation in beef cattle using IPCC Tier-2 method in Indonesia. JITV Tier-21(Tier-2): 101-111. DOI: http://dx.doi.org/10.14334/jitv.vTier-21iTier-2.1358
INTRODUCTION
Methane (CH4) is one of greenhouse gasses (GHG) produced from anthropogenic activities, including from livestock activity. Other GHG are dinitrooxide (N2O), carbon dioxide (CO2) and chlorofluorocarbon (CFC) (Gerber et al. 2013). Among other gasses, CH4`is the second to CO2 in term of its contribution to climate change (Lassey 2007). In year 2012, the total GHG emission from Indonesia becomes 1,453,957 Gg CO2-e or increased by 45% from the GHG emission in year 2000. Agricultural sector is contribute for only 7.8%, after contribution of energy (34.9%) for national GHG. Contribution of GHG from livestock to agriculture sector is accounted for about 27,465 Gg CO2-e or 24.4 %, including CH4, CO2 and N2O from enteric fermentation and manure management by Ministry of Environment. Among the livestocks, ruminant contributes for about 94% and non ruminant contributes for about 6% of CH4 emitted to the atmosfer. In ruminant group, beef cattle is the larger contributor (69.41%) due to the large population and body size.
Methane is a trace gasses that formed during rumen fermentation process of feed (Rong-Zhen et al. 2016). Conversion of feed materials into CH4 in the rumen involves the integration of several species of microorganisms ended metanogenesis bacterial activity. The main microorganisms in the rumen perform hydrolysis of proteins, carbohydrates, and polymer plant cell walls into acidic amino acids and simple sugars. The products are fermented into Volatile Fatty Acid (VFA), and hydrogen (H2) as the secondary products of rumen microorganisms in the digestive system. The main components of VFA are acetic, propionic and butyric acid. These acids are absorbed and used by ruminants as sources of energy for their productivity. Other secondary products (H2) are then converted to CH4 in the present of CO2. The amount of CH4 formed during rumen fermentation depend on feed quality (energy dan fibre content) and the level of intake. Increasing in dietary intake followed by nutrient intake will affect rumen environment as well as enteric fermentation significantly depend on the accuracy of country-specific national GHG inventories that can be used as bench mark for the initial value of CH4 emission. However, the previous review of national GHG inventory in Indonesia was calculated by using Tier-1 method of IPCC. In this method, GHG emission was calculated by multiplied livestock
population with emission factor (EF). The EF values used in the calculation were the default EF suggested by IPCC for Asia countries. The GHG emission estimated by using Tier-1 method shows high uncertainties largely caused by gaps in activity data and the use of IPCC default EFs that did not reflect a real condition of Indonesia’s livestock (Widiawati 2013).
Estimation of CH4 emission from livestock has been directed by a guideline published by The Intergovernmental Panel for Climate Change (IPCC) since 1996 and renewed in year 2006 (IPCC 2006). There are three Tiers methods are provided in IPCC guidelines book, which can be used to estimate methane emitted from livestock. They are Tier-1, Tier-2 and Tier-3 methods. Tier-1 is the basic method, Tier-2 is an intermediate method and Tier-3 is the most demanding in terms of complexity and data requirements. Tiers-2 and Tier-3 methods are referred to higher Tier method and generally considered to be more accurate. The three methods require some factors, such as value of EF, livestock sub-categories based on their level productions, and annual livestocks population. When higher levels of methods (Tier-2 and Tier-3) are used, data on feed intake and feed quality are required. These methods suggested by IPCC, represent as Tier method,
have a level of methodological complexity. Selection of
Tier method used to estimate CH4 emission is depend of GHG inventory. Moreover, beef cattle in Indonesia is a species that contribute the highest amount of CH4 among other ruminant species (Widiawati 2013), thus it becomes a key-category. Therefore estimation of methane emitted from beef cattle must use Tier-2 or Tier-3 methods.
is required to identify contribution of livestock to nasional GHG emission.
MATERIALS AND METHODS
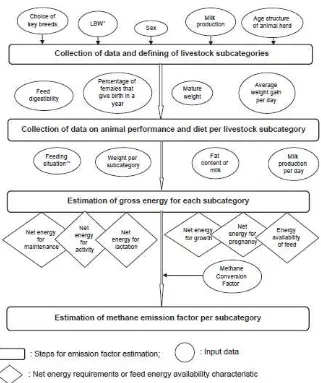
To develope country specifis EF values required in Tier-2 method, some factors are required. They are livestock population based on the level production (sub-categories), live weight, feed intake, and energy content of the feed. Beef cattle population in Indonesia is divided into five sub-categories based on the level production of the animals. Data collection and analysis to develope EF values were undertaken by follows some steps as outlined in IPCC Tier-2 method (Figure 1).
Characterization of beef cattle population and performance data subcategories
Data on beef cattle population was collected from Statistics Indonesia (CSA 2015) as the Central agency on statistic in Indonesia. Beef cattle sub-categories based on production levels were collected from Directorate General of Livestock and Animal Health (DGLAH 2015), Ministry of Agriculture. Data from CSA is published census data that have associated uncertainty estimates with variety within ±20%. Population of beef cattle included in the calculation was data from 2006 to 2014.
*LBW: Live body weight
**Feeding situation: Description of the extent to which cattle are stall fed, grazed or pastured over large geographical areas (IPCC 2006). This information is required to estimate the net energy expended by the animal during the acquisition of feed
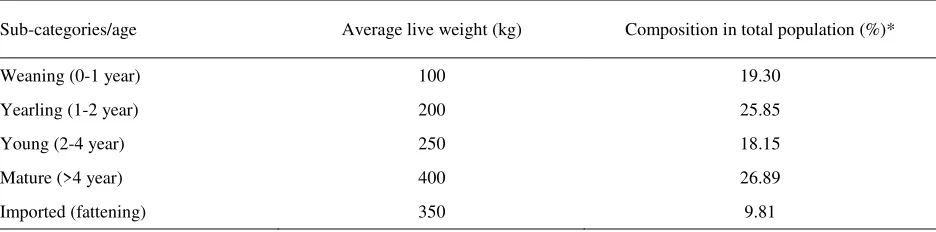
Compiled data were summarized by the two origin of local beef cattle and imported beef cattle. Local origin beef cattle production, which has more variation of live weight, was categorized by four sub-categories, namely weaning (0-1 year), yearling (1-2 years), young (2-4 years) and mature (more than 4 years). Imported beef cattle has short time living in Indonesia because of industrial meat production (aprroximately 120 days). Therefore, imported beef cattle was separated from local beef cattle as one of sub-category. Due to differences in the live weight for each sub-category, therefore each sub-category of beef cattle requires different value of EF. The sub-categories of beef cattle in Indonesia and composition of each sub-cetagory in total population are presented in Table 1.
Feeding situation and farming system for beef cattle in Indonesia
Data related to description of feed ingredients, consumption/intake, and gross energy value of feed ingredients was compiled from national scientific report, laboratory analysis and published papers. Animal’s feeding situation is required to estimate the net energy expended by the animal during the acquisition of feed (IPCC 2006). Indonesia has many variations of feeding systems, which are depend on geographical areas and climate. Indonesia is archipelago country with 5 big islands from western to eastern part of Indonesia. Each part is determined by some agroecosystem zones.
The feeding situations of beef cattle are defined by analyzing farming system and feeding practices. In Indonesia, the farming systems for beef cattle are defined to intensive, semi intensive and extensive farming system, which are corresponded to feeding input and production. Most of small holder farmers apply intensive and semi intensive traditional farming
systems, which are implement grass, native grass and agricultural by-product or crop-residues as sources of feed for beef cattle. While in intensive farming system as adopted by industrial farming, total mixed ration and concentrated feed are used to fed the imported beef cattle. Therefore, in the present study, the intensive feeding system is selected as the most representative for the major farming system in Indonesia.
Feed ingredients for local beef cattle are divided into three part, namely protein, energy and fibre source feeds. Fibre source feed includes cultivation grass, native grass, agricultural by-product such as rice straw, corn straw, oil palm leaves, sugar cane top. While energy source feed inlcludes rice brand, ground nut shell, palm kernel meal, pineaple processing waste, cassava industrial. Meanwhile for protein source feed includes legume leaves, cassava leaves. Industrial farming of beef cattle (feedlot) mostly uses total mixed ration to fed the animals (concentrate+fiber source feeds).
Feed and gross energy intake
Daily feed intake for each livestock sub-category was calculated based on dry matter intake (kg/day) and gross energy intake (MJ/day). Dry matter intake and digestibility of feed for each livestock sub-category, live weight of animals for each sub-category were collected from result of researchs and from published paper (Nurhayu et al. 2010; Nurhayu et al. 2011; Mathius 2010; Ratna et al. 2013; Soeharsono et al. 2010; Widyaningrum et al. 2013; Koddang 2008; Nugroho et al. 2015). Due to the large variations of feed available and offered to the animals in all provinces of Indonesia, the feeds were grouped into 5 types of feed for beef cattle sub-categories. The gross energy content of each type of feed was calculated from the average of laboratory analysis (Table 2).
Table 1. Sub-categories of beef cattle in Indonesia based on production level, live weight and each composition in the population
Sub-categories/age Average live weight (kg) Composition in total population (%)*
Weaning (0-1 year) 100 19.30
Yearling (1-2 year) 200 25.85
Young (2-4 year) 250 18.15
Mature (>4 year) 400 26.89
Imported (fattening) 350 9.81
Table 2. Type of feed and gross energy content used in the calculation
Type of feeds Gross energy (MJ/kg DM)
Grass 17.4±0.540
Agricultural/plantation by-product 15.5±0.804
Leguminouse leaves 19.7±0.786
Grain/concentrate 20.2±0.754
Complete feed/commercial feed 18.9±0.886
Sources: Laboratory analyses Developing enteric CH4 EFs
Emision factor (EF) for enteric CH4 fermentation was developed for each livestock sub-category based on gross energy intake. According to the guideline book of IPCC (2006), the equations to determine EFs for each sub-category spesific for Indonesia are:
Local beef cattle:
EF = (GEI x (Ym/100) x 365)/55.65
Imported beef cattle:
EF = (GEI x (Ym/100) x 120)/55.65
In this equation, EF is the emission factor (kg CH4 head-1 yr-1), GEI is gross energy intake (MJ head-1 day-1), Ym is CH4 conversion factor (%) of GEI in feed that is converted to CH4, factor 55.65 (MJ/kg CH4) is the energy content of methane (IPCC 2006). It is assumed that the EF was calculated for 365 days for local beef cattle for all sub-category, and only 120 days for imported beed cattle that going to feedlot system.
The CH4 conversion factor (Ym) specific for Indonesia is still not available for all type of feeds. Therefore the Ym used is from default factor of IPCC (2006). A Ym of 3.0%±1.0% was used for imported beef cattle because concentrated feed are offered more than 90%. While, a Ym of 6.5%±1.0% was used for local beef cattle in Indonesia because the feed types primarily fed to the animals are low quality crop residues and by-products (rice brand, palm kernel meal,
corn straw, rice straw, and others). The EF developed for local beef cattle was over a year (365 days), while for imported cattle was one periode of fedlot (120 days). Gross energy intake is filled in by real data for each livestock sub-category. The factor of 55.65 (MJ/kg CH4) is the constanta indicates the energy content of the methane (IPCC 2006).
CH4 emission from beef cattle
Once the EF values specific for Indonesia for all sub-categories of beef cattle were developed, they were used to estimate CH4 emitted from beef cattle. Calculation of emission CH4 from enteric fermentation from beef cattle in Indonesia is based on the beef cattle population or each sub-category and the value of EF specific for Indonesia, by using equation:
CH4 emission = EF (T) x (N (T) /106) x 21/1000
In this equation, CH4 emission is CH4 emitted from enteric fermentation (Gg CO2-e/year), EF(T) is the
emission factor for each sub-category of beef cattle (kg
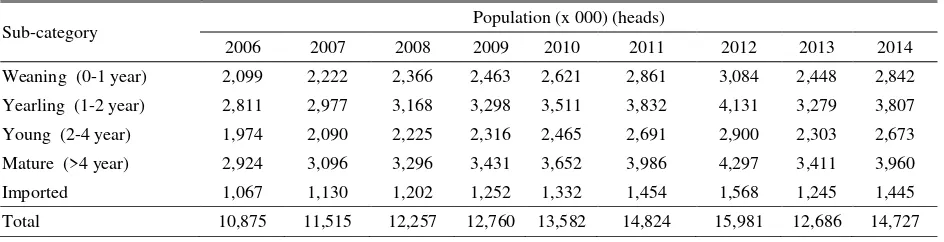
CH4/head/year). The values of EF used are resulted from the calculation reported in this paper, N(T) is the population of beef cattle for each sub-category T in Indonesia (head), T is sub-category of beef cattle in Indonesia, 21/1000 is the convertion factor from CH4 to CO2-e (IPCC 2006). Population of beef cattle in each sub-category since year 2006 to 2014 is presented in Table 3.
Table 3. Population of beef cattle based on sub-category since 2016 to 2014
Sub-category Population (x 000) (heads)
RESULT AND DISCUSSION
The values of EF for beef cattle in Indonesia
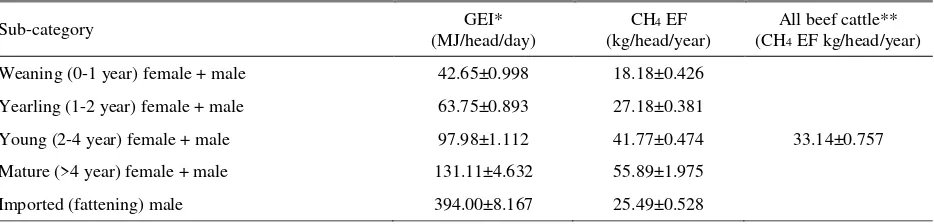
Methane EFs for all sub-categories of beef cattle calculated based on local data of gross energy intake are presented in Table 4.
Overall, enteric CH4 EF for beef cattle in Indonesia is 33.14 kg/head/year. The value is averaging from the EF value of all sub-categories and their composition in the population. Imported cattle has CH4 EF (25.49 kg/head/year) lower than local beef cattle due to short periode living in a year. The imported cattle also fed by high quality feed with more than 85% of concentrate in their ration in the form of complete feed. Live weight of cattle becomes a consideration on the amount of concentrate offered to the animals. In the first month of fattening period, the cattle were fed with lower level of concentrate (70-80% of total daily ration) than the cattle in the last period of fattening. The amount of concentrate offered was increased up to 90% as the body weight of cattle increased during the last month of fattening period. The fiber contained in the complete feed was lower than in convensional mixed feed (grass + legume + concentrate) fed to most of local beef cattle. In ruminant metabolism, dietary fiber is responsible for producing free H gas in the rumen. The free H is then used for CH4 gas formation in the rumen.
The average enteric CH4 EF for local beef cattle was 36.75 kg/head/year, due to the variation of feeds consumed (grass, agricultural waste and small amount concentrated feed) by the cattle. Because of the limmitation on the data available in the country for the methane conversion factor (Ym), therefore, calculation of EF values for the beef cattle in Indonesia used the
Ym value as stated in the IPCC (2006). The Ym values available in the guideline are 3.0%±1%, for ration which is consisted of >90% concentrate, and 6.5%±1% for the ration that is consisted of high fibre diet. Local beef cattle in Indonesia mostly maintains in traditional
farming system, where the feed offered consisted of 64.34% of forage and 35.66% of concentrate. With those such feed type, the Ym value used for the ration offered to local beef cattle is assumed to be closed to 6.5%±1%, according to the IPCC guideline. Imported beef cattle in fedlot system were fed by complete feed, which contains materials as sources of fibre and concentrate. With the variation of concentrate levels in the complete feed offered to the cattle at different time of fattening, the Ym value used in the calculation was 3%±1%, with the assumption that the value is fit with the type of feed offered to the imported cattle in fedlot system.
Local beef cattle in Indonesia was sub-categorized by age of animal, which determines their level of production. The proportion of mature local beef cattle (>2 years) is the highest (>50%) among other sub-categories, while the proportion of imported beef cattle is only 9.81%. With this such proportion, therefore, the EF value of all beef cattle in Indonesia would be more affected by local beef cattle than imported beef cattle.
Comparison of enteric CH4 EF among some countries and default factor from IPCC (2006) are presented in Table 5.
There is a different value of enteric CH4 EF between the default factor from IPCC (2006) and local Indonesia EF calculated by using Tier-2 method. On the whole, the enteric EF for all sub-categories of beef cattle in Indonesia (weaning, yearling, young, mature and imported) generated from this study (Table 4) are lower than the EF value from IPCC (2006). The Enteric CH4 EF for beef cattle in Indonesia calculated using Tier-2 method is 36.75% lower than IPCC default factor for Tier-1 for Asia countries (IPCC 2006). In general, the differences indicated between enteric CH4 EF generated by the present study and default enteric CH4 EF from IPCC might be attributed to demographic profile and animal’s growth performance data, in particular live weight and feeding system including the type of feed (IPCC 2006, annex 10A.1, Table 10A.2).
Table 4. Calculated gross energy intake (MJ/head/day) and enteric CH4 EF (kg/head/year) for each sub-category of beef cattle in Indonesia Weaning (0-1 year) female + male 42.65±0.998 18.18±0.426
Yearling (1-2 year) female + male 63.75±0.893 27.18±0.381
Young (2-4 year) female + male 97.98±1.112 41.77±0.474 33.14±0.757 Mature (>4 year) female + male 131.11±4.632 55.89±1.975
Imported (fattening) male 394.00±8.167 25.49±0.528 * Calculated from daily feed intake and gross energy contents of the feeds
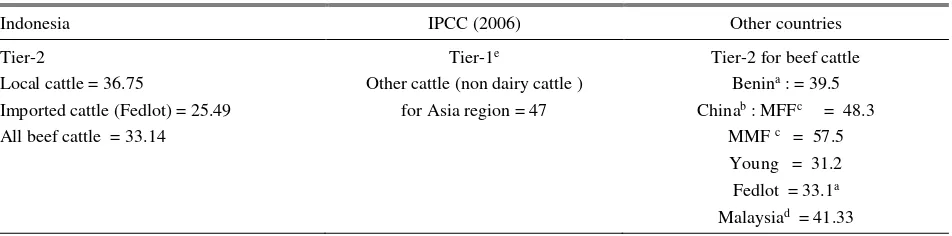
Table 5. Comparison between enteric CH4 EF for Indonesia, default factor IPCC and other countries
Indonesia IPCC (2006) Other countries
Tier-2
Local cattle = 36.75
Imported cattle (Fedlot) = 25.49 All beef cattle = 33.14
Tier-1e
Other cattle (non dairy cattle ) for Asia region = 47
c) MFF : mature female farming; MMF: mature male farming d) Hatton et al. 2013
e) IPCC (2006)
The lower enteric CH4 EF of Indonesian beef cattle compared to IPCC default factor is suggested due to lower beef cattle live weight for each sub-category. For example, the live weight of mature beef cattle in Indonesia is averaged for about 400 kg (Widyaningrum et al. 2013), while the weight of animal for the same sub-category in IPCC guideline (2006) is 450 kg. The weight of imported beef cattle going to fedlot industry in Indonesia is averaged for about 350 kg, while in the IPCC guideline (2006), the weight of cattle in fedlot is 415 kg.
The default EF values suggested by IPCC guideline (2006) for Asia were averaged from many researchs in many Asia countries. Meanwhile, the EFs generated from this study includes a correction factor related to population sub-categorizing and different gross energy intake, which also separation between imported cattle and local cattle. The reduction value of CH4 EF is about 21.8085% when the method was changing from Tier-1 (47 kg CH4/head/year, according to IPCC 2006) to Tier-2 (36.75 kg CH4/head/year, generated from this study) for local beef cattle. The default value of EF for non dairy cattle (other cattle) in Asia region using Tier-1 as suggested by IPCC guideline (2006) is 47 kg CH4/head/year, which is explained as small commercialised dairy sector.
Estimation of methane emission from beef cattle by using Tier-2 method
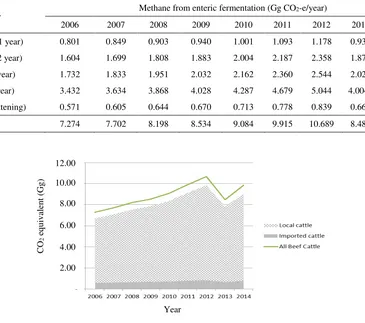
Enteric CH4 EF from beef cattle in Indonesia generated from this study is then used to estimate total emission of enteric CH4 from beef cattle. The calculation used beef cattle population as shown in Table 3 and the value of EF generated from this study as presented in Table 4. The results of those calculation are presented in Table 6.
The total enteric CH4 emission from beef cattle increases 4.41.% per year from 2006-2014 due to increasing in population of beef cattle in Indonesia. However, there is a decreasing in the enteric CH4 emission from beef cattle in 2012 to 2013. This reduction is due to a decreasing in beef cattle population as a result of government’s policy about limitation in importing the beef cattle. In the other side, the local beef cattle population also decreased at the time because there is an increasing in animal protein consumption (CSA 2015). However, the trend of CH4 emission increases year by year (Figure 2) as a result of an increasing in the population of beef cattle.
Imported cattle, which represents the fedlot industry, only contributes for about 7.85% of total enteric CH4 emission from beef cattle, due to their small population compared to the local beef cattle. Other reason is the imported beef cattle uses good quality feed (high concentrate fed) which produces low methane per unit dry matter of feed digested (Migwi et al. 2011a; Migwi et al. 2011b; Pedreira et al. 2013; Beauchemin & McGinn 2005).
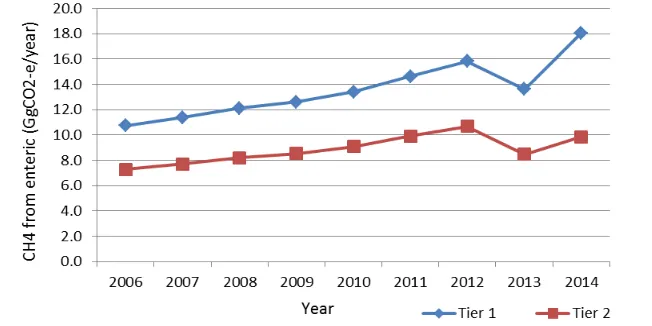
There is a different value on the national enteric CH4 emission from beef cattle when they are calculated by using local EF generated from this study (Tier-2 method) compared to those were calculated by using default EF from IPCC (Tier-1 method). The comparisson of methane emission from beef cattle calculated by using Tier-1 method (Widiawati 2013) with those calculated by using Tier-2 method generated from this study is shown in Figure 3. There is a reduction in the national CH4 emission from beef cattle by 32.2% up to 45.5% when they are calculated by using Tier-2 method, during the period of year 2006 to year 2014.
Table 6. Estimation of enteric CH4 emission from beef cattle in Indonesia from 2006 to 2014 calculated by using Tier-2 method
Sub-category
Methane from enteric fermentation (Gg CO2-e/year)
2006 2007 2008 2009 2010 2011 2012 2013 2014 Weaning (0-1 year) 0.801 0.849 0.903 0.940 1.001 1.093 1.178 0.935 1.085 Yearling (1-2 year) 1.604 1.699 1.808 1.883 2.004 2.187 2.358 1.872 2.173 Young (2-4 year) 1.732 1.833 1.951 2.032 2.162 2.360 2.544 2.020 2.345 Mature (>4 year) 3.432 3.634 3.868 4.028 4.287 4.679 5.044 4.0043 3.474 Imported (fattening) 0.571 0.605 0.644 0.670 0.713 0.778 0.839 0.666 0.773 Total 7.274 7.702 8.198 8.534 9.084 9.915 10.689 8.485 9.850
Figure 2. The trend of enteric CH4 emission from beef cattle in Indonesia since year 2006 to year 2014, calculated by using Tier-2 method.
CO
2
e
q
u
iv
alen
t
(Gg
)
12.00 10.00 8.00 6.00 4.00 2.00
Figure 3. The comparison between national enteric CH4 emission from beef cattle calculated by using Tier-1 and Tier-2 methods.
Reduction of enteric CH4 emission from beef cattle occured when the calculation was changed from Tier-1 to Tier-2 method. In Tier-2 method, simple technologies in feeding management have been addressed. Most of the feeding managements adopted by farmers are supplementation of feed, by using leguminous leaves or concentrate. These two types of feed supplement increase the quality of basal feed, which also have indirect effect on mitigate the production of CH4 during rumen fermentation (Martin et al. 2010; Cottle et al. 2011; Patra 2012; Jayanegara et al. 2009; Jayanegara et al. 2011; Holtshausen et al. 2009).
The national average EF for beef cattle generated from this study is representing the EF for all beef cattle in all provinces of Indonesia. The application of the Tier-2 method suggested in IPCC (2006) to Indonesian conditions illustrates the challenges in developing country-specific EFs stemming from lack of data within provinces in Indonesia, where the type of feeds are vary. It is also become a further challange since there is a variation of beef cattle breed among the Indonesia regions. Further research therefore should focus on the estimation of uncertainties in Tier-2 inputs. The calculation must be further developed for different breed of beef cattle as well as different feeding systems (intensive, extensive, pasture).
CONCLUSION
The value of EF for all Indonesia’s beef cattle calculated by using Tier-2 method is 33.14 kg CH4/head/year. The value is lower than the default EF suggested by IPCC for Asia country (47 kg CH4/head/year). The national methane emission from beef cattle estimated by using Indonesia’s EF for beef cattle is lower than those estimated by using EF value
suggested by IPCC (Tier-1 method). The EF value generated from this study represents the Indonesia’s specific livestock system.
ACKNOWLEDGEMENT
The authors have benefited from the support of Dr. Harry Clark (NZ-AgResearch). We have also benefited from the tim-work and collaboration within the member of national Tier-2 team, Prof. Dr. Agung Purnomoadi (Diponegoro University); Noorhuda Krisna, SPt., MSi (BCRS); Dr. Yeni N. Anggraeni (BCRS); Dr. Simon P. Ginting (GRS); Dr. Antonius (GRS), Dr. Dwi Yulistiani (IRIAP); Dr. Wisri Puastuti (IRIAP); Rantan Krisnan, SPt., MSi (IRIAP); Cecep Hidayat, SPt., MSi (IRIAP); Teguh Wahyono, SPt., MSi (NNEAI) and Ir. Ali Pramono, MSi (IRIAE).
REFERENCES
Beauchemin KA, McGinn SM. 2005. Methane emissions from feedlot cattle fed barley or corn diets. J Anim Sci. 83:653-661. doi: 10.2527/2005.833653x.
[CSA] Central Statistic Agency. 2015. Statistik Indonesia 2015. Jakarta (Indones): Central Statistic Agency. Cottle DJ, Nolan JV, Wiedemann SG. 2011. Ruminant enteric
methane mitigation: a review. Anim Prod Sci. 51:491-514. doi: 10.1071/AN10163.
Dijkstra J, Oenema O, Bannink A. 2011. Dietary strategies to reducing N excretion from cattle: implications for methane emissions. Curr Opin Environ Sustain. 3:414-422. doi: 10.1016/j.cosust.2011.07.008.
Gerber P, Hristov A, Henderson B, Makkar H, Lee JOC, Meinen R, Montes F, Ott T, Firkins J. 2013. Technical options for the mitigation of direct methane and nitrous oxide emissions from livestock: A review. Animal 7:220-234. doi: 10.1017/S1751731113000876.
Gregorini P, Beukes P, Bryant R, Romera A. 2010. A brief overview and simulation of the effects of some feeding strategies on nitrogen excretion and enteric methane emission from grazing dairy cows. In: Edwards GR, Bryant R, editors. Proceedings of the 4th Australasian Dairy Science Symposium. Lincoln (Aust): Caxton Press. p. 29-43.
Hammond KJ, Burke JL, Koolaard JP, Muetzel S, Pinares-Patino CS, Waghorn GC. 2013. The effect of feed intake on enteric methane emissions from sheep fed fresh white clover (Trifoliumrepens) and perennial ryegrass (Loliumperenne) forages. Anim Feed Sci Technol. 179:121-132. doi: 10.1016/j.anifeedsci. 2012.11.004.
Hatton V, Kinh LV, Boonyanuwat K, Shanmugavelu S, Widiawati Y. 2013. Livestock greenhouse gas emissions from four countries in South East Asia: A collaborative approach to a regional problem. Proceedings of the 5th Greenhouse Gasses and Animal Agriculture Conference. Dublin (Irel). p. 587
Holtshausen L, Chaves AV, Beauchemin KA, McGinn SM, McAllister TA, Odongo NE, Cheeke PR, Benchaar C. 2009. Feeding saponin-containing Yucca schidigera and
Quillaja saponaria to decrease enteric methane
production in dairy cows. J Dairy Sci. 92:2809-2821. [IPCC] Intergovernmental Panel on Climate Change. 2006
IPCC Guidelines for National Greenhouse Gas Inventories, Prepared by the National Greenhouse Gas Inventories Programme. Eggleston HS, Buendia L, Miwa K, Ngara T, Tanabe K, editors. Kanalawa (Jpn): Institute for Global Environmental Strategies.
Jayanegara A, Togtokhbayar N, Makkar HPS, Becker K. 2009. Tannins determined by various methods as predictors of methane production reduction potential of plants by an in vitro rumen fermentation system. Anim Feed Sci Technol. 150:230-237. doi: 10.1016/j.anifeedsci.2008.10.011.
Jayanegara A, Wina E, Soliva CR, Marquardt S, Kreuzer M, Leiber F. 2011. Dependence of forage quality and methanogenic potential of tropical plants on their phenolic fractions as determined by principal component analysis. Anim Feed Sci Technol. 163:231-243. doi: 10.1016/j.anifeedsci.2010.11.009.
Koddang MYA. 2008. Pengaruh tingkat pemberian konsentrat terhadap daya cerna bahan kering dan protein kasar ransum pada sapi Bali jantan yang mendapatkan rumput Raja. J Agrol. 15:343-348.
Kouazounde JB, Gbenou JD, Babatounde S, Srivastava N, Eggleston SH, Antwi C, Baah J, McAllister TA. 2015. Development of methane emission factors for enteric fermenation in cattle from Benin using IPCC Tier 2 methodology. Animal. 9:526-533. doi: 10.1017/S1751731114002626.
Lassey KR. 2007. Livestock methane emission: from the individual grazing animal through national inventories to the global methane cycle. Agric Forest Meteorol. 142:120-132. doi: 10.1016/j.agrformet.2006.03.028. Martin C, Doreau M, Morgavi DP. 2010. Methane mitigation
in ruminants: from rumen microbes to the animal. Animal. 4:351-365
Mathius I-W. 2010. Optimalisasi pemanfaatan bungkil inti sawit untuk sapi yang diberi pakan dasar rumput alam. In: Prasetyo LH, Natalia L, Iskandar S, Puastuti W, Herawati T, Nurhayati, Anggraeni A, Dharmayannti NLPI, Estuningsih SE, editors. Proceeding of National Seminar on Livestock Production and Veterinary Technology. Bogor (Indonesia): Indonesian Center for Animal Research and Development. p. 161–169. Migwi PK, Godwin I, Nolan JV, Khan LP. 2011a. The effect
of energy supplementation on intake and utilization efficiency of urea-treated low-quality roughage in sheep. I. Rumen digestion and feed intake. Asian-Australas J Anim Sci. 24:623-635. doi: 10.5713/ajas.2011.10282.
Migwi PK, Godwin I, Nolan JV. 2011b. The effect of energy supplementation on intake and utilization efficiency of urea-treated low-quality roughage in sheep. II. Rumen kinetics and acetate clearance rate. Asian-Australas J Anim Sci. 24:774-780. doi: 10.5713/ajas.2011. 10283. Nugroho HD, Permana IG, Despal. 2015. Utilization of
bioslurry on maize hydroponic fodder as a corn silage supplement on nutrient digestibility and milk production of dairy cows. J Anim Sci Technol. 38:70-76.
Nurhayu A, Pasambe D, Sariubang M. 2010. Kajian pemanfaataan pakan lokal dan UMB untuk penggemukan sapi potong di kab Pinrang, Sulsel. In: Prasetyo LH, Natalia L, Iskandar S, Puastuti W, Herawati T, Nurhayati, Anggraeni A, NlPI D, Estuningsih SE, editors. Proceeding of National Seminar on Livestock Production and Veterinary Technology. Bogor (Indones): Indonesian Center for Animal Research and Development. p. 194-199 Nurhayu A, Sariubang M, Nasrullah, Ella A. 2011. Respon
Pemberian Pakan Lokal terhadap produktivitas sapi Bali dara di Kab Bantaeng. In: Prasetyo LH, Damayanti R, Iskandar S, Herawati T, Priyanto D, Puastuti W, Anggraeni A, Tarigan S, Wardhana AH, Darmayanti NLPI, editors. Proceeding of National Seminar on Livestock Production and Veterinary Technology. Bogor (Indones): Indonesian Center for Animal Research and Development. p. 115-120.
Patra AK. 2012. Enteric methane mitigation technologies for ruminant livestock: a synthesis of current research and future directions. Environ Monit Assess. 184:1929-1952. doi: 10.1007/s10661-011-2090-y.
Ratna AD, Hendri Y, Bamualim A. 2013. Respon pertumbuhan sapi Simmental yang diberi pakan hasil ikutan industri sawit di Sumbar. In: Purwantari ND, Saepulloh M, Anggraeni A, Ginting S, Priyanti A, Wiedosari E, Yulistiani D, Inounu I, Bahri S, Puastuti W, editors. Proceeding of National Seminar on Livestock Production and Veterinary Technology. Bogor (Indones): Indonesian Center for Animal Research and Development. p. 162-168.
Rong-Zhen Z, Fang Y, Sun HX, Wang M, Zou DW. 2016. Rumen methane output and fermentation characteristics of gramineous forage and leguminous forage at differing harvest dates determined using an in vitro gas production technique. J Integr Agric. 15:414-423. doi: 10.1016/S2095-3119(15)61036-X.
Soeharsono, Saptati RA, Diwyanto K. 2010. Penggemukan sapi lokal hasil IB dan sapi bakalan impor dengan menggunakan bahan pakan lokal. In: Prasetyo LH, Natalia L, Iskandar S, Puastuti W, Herawati T, Nurhayati, Anggraeni A, Darmayanti NLPI, Estuningsih SE, editors. Proceeding of National Seminar on Livestock Production and Veterinary Technology.
Bogor (Indones): Indonesian Center for Animal Research and Development. p. 116-122.
[USEPA] United States of Environmental Protection Agency. 1994. International Anthropogenic Methane Emissions: Estimates for 1990. EPA-230-R-93-010. Washington DC (USA): United States of Environmental Protection Agency.
Widiawati Y. 2013. Estimation of Methane Emission from Enteric Fermentation and Manure Management of Domestic Livestock in Indonesia. Proceedings of the 5th Greenhouse Gasses and Animal Agriculture Conference (GGAA 2013). Dublin (Irel). p. 443.