AN EXPERIENCE OF DGA MONITORING ON POWER TRANSFORMERS
W. G. Ariastina1*, I N. Setiawan1, I. A. D. Giriantari1, R. P. Sari2 and I. K. Solin3 1Department of Electrical Engineering, Udayana University, Bali-80362, Indonesia 2PT PLN (Persero) Surabaya Maintenance Service Area, Sidoarjo-61257, Indonesia3PT PLN (Persero) Head Office, Jakarta-12160, Indonesia *Email: w.ariastina@unud.ac.id
Abstract: This paper presents DGA test results of three similar types of power transformers with different operation commencing dates. The first transformer is comparatively new transformer with five years servicing the network. This apparatus has a high vibration and noise. The second transformer has been operated for about ten years, while the third represents a seventeen year in service equipment. A series of DGA tests for the transformers have been carried out over five year period. Results from several DGA interpretation techniques then are compared to look possible fault existence. It has been shown that in addition to analysis of an individual gas concentration, the trends of gas concentration and gas proportion over time, have been very useful in assisting researchers and engineers in monitoring condition of the power transformers.
1 INTRODUCTION
DGA has been well known since decades and currently is the most extensively used test for transformer condition monitoring. For a DGA test, a small amount of transformer oil is taken from transformer tank. The oil sample must be completely sealed to prevent gas escaping from the sample vessel or further moisture ingress into the oil. Hydrocarbon gases dissolved in the oil are then extracted and analysed by means of a gas chromatograph.
The presence and the quantity of the gases determine the quality of the insulating liquid and the existence of failures within the transformer tank. There are several gases that can be used as indicators, which include carbon monoxide (CO), carbon dioxide (CO2), hydrogen (H2), methane (CH4), ethane (C2H6), ethylene (C2H4), and acetylene (C2H2). A corresponding oil quality test is usually carried out to identify the insulation integrity level of the oil. The later basically covers examination of physical characteristics, which include breakdown test, viscosity, flash point, water content and acidity level.
Since it was firstly developed, research into DGA interpretation has been extensively carried out. A large number of technical papers have been published accordingly. A number of well known DGA interpretation techniques have also been developed. Among the available techniques are the key gas interpretation, IEC methods, Roger’s ratio, Doernenburg’s ratio, and Duval’s triangle fault indicator [1-7].
Many other techniques have also been developed to increase the interpretation accuracy. Several approaches applied modified single method and the other applied a combined interpretation
technique. DGA interpretation techniques with artificial intelligent tools have also been introduced recently [4-6].
In addition to the absolute value and ratios of dissolved gases, it is important to consider the increase rate of a particular gas over time. Continuous tests that provide trends of the dissolved gas quantity will be very useful in providing an accurate interpretation of the DGA results. A sudden increase in distinctive gas content may specify a fault occurrence [4,7].
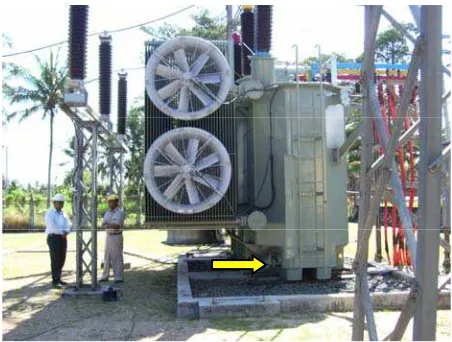
This paper presents a field experience of DGA monitoring of three 150/20kV power transformers. The first transformer is a five year in service equipment with high vibration and noise. The second has been operated for about ten years, while the third represents a seventeen years in service transformer. Results from several DGA interpretation techniques then are compared to look possible fault existence. Figure 1 illustrates one of the investigated power transformer (Transformer 1).
2 DGA MONITORING
As part of asset management strategy, the state electricity company of the Republic of Indonesia, has implemented DGA as a standard method for condition monitoring of HV transformers. The time interval of the DGA monitoring is determined based on the condition of the equipment. The DGA has been applied as a standard method, since it is efficient to determine and classify the thermal and electrical faults.
In addition to the DGA monitoring, condition monitoring of transformer using electrical, mechanical and thermal methods have also been applied. The later include Partial Discharge (PD), Frequency Response Analysis (FRA), Acoustic Emission (AE), vibration analysis and infrared thermography techniques.
DGA test results of three different transformers of similar type and capacity are discussed in this paper. The first transformer has been operated for five years with high vibration and noise. The second has operated for about ten years with thermal fault indication, while the third represents a seventeen years in service transformer.
The DGA tests have been carried out for five years in series. The time interval between measurements is approximately a year. Interpretation techniques of the DGA test results presented here are of key gas method, Doernenburg’s ratio, IEC ratio and Duval’s triangle. In addition to the diagnosis using these interpretation methods, the trends of individual concentration and composition of the hydrocarbon gases are also presented. The trend of gas quantity may provide a useful fault indication within the transformer.
The sample for DGA tests was of bottom oil of the main tank. The oil was taken from bottom drain valve of the transformer (see yellow arrow sign in Figure 1). The oil sample was obtained during normal operation of the transformers, with an approximate temperature of 60°C.
3 RESULTS AND DISCUSSION
3.1 Transformer 1 (5 years in service)
The power transformer was manufactured in 2007, and commenced to operate in early 2008. It is an ONAN/ONAF type with a capacity of 60MVA. The equipment is installed within a network substation, with an operating voltage of 150/20kV. The cooling fan is set to operate at an oil temperature of 60°C and above. Previous measurement showed that the transformer produced a vibration acceleration of 311.27m/s2, the highest among other tested power transformers in the region [8]. As a result of the high vibration, the transformer also produces a high audible noise.
The maximum transformer loading during first year of operation was slightly above 15MW. It has been 100% increased of load since the time. Figure 2 shows typical daily load pattern of the transformer. The transformer is currently operated with a low loading scheme, mostly below 50% of its maximum capacity. During day time, the load is comparatively steady of about 21MW. Beginning about 5pm, the load increases to meet night peak demand. The maximum transformer loading is about 32MW and lasts for a few hours before decreases because of less power demand later at night. The recorded maximum oil temperature is about 65°C.
0 5 10 15 20 25 30 35
8:00 9:00 10:00 11:00 12:00 13:00 14:00 15:00 16:00 17:00 18:00 19:00 20:00 21:00 22:00
Time
Lo
a
d (
M
W
)
Figure 2: Typical load pattern of Transformer 1
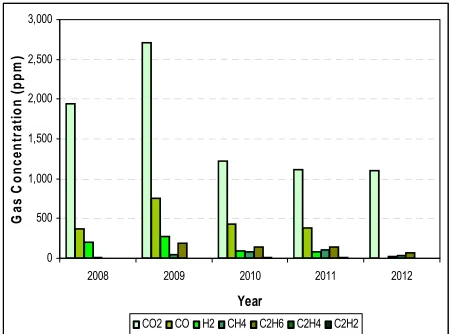
Individual gas concentration in oil for Transformer 1 over the time period is illustrated in Figure 3. There was an increase in concentration of carbon dioxide, carbon monoxide, hydrogen, methane, and ethane during first year operation of the transformer. The concentrations of these gases were comparably high, with carbon dioxide of 2714.29 ppm, carbon monoxide of 755.93 ppm, hydrogen of 281.45 ppm and the ethane of 192.48 ppm. Over the following three years however, the concentrations of the hydrocarbon gases have decreased gradually.
0 500 1,000 1,500 2,000 2,500 3,000
2008 2009 2010 2011 2012
Year
G
as C
o
n
cen
tr
a
ti
o
n
(
p
p
m
)
CO2 CO H2 CH4 C2H6 C2H4 C2H2
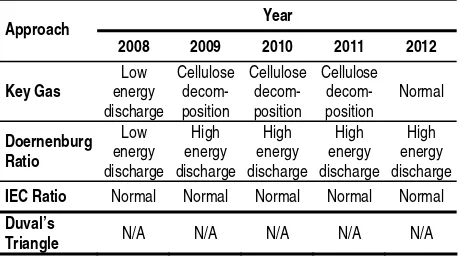
The key gas chart in Figure 4 shows that the proportion of carbon monoxide and hydrogen has decreased over time period. In contrast, the proportion of methane and ethane was constantly increased. This indicates that during early operation of the transformer, there is a possibility of occurrence of low energy discharges that produces hydrogen, and slightly methane, ethane and ethylene. This approach has also indicated an occurrence of cellulose decomposition for the following years. However; after five years in service the key gas interpretation suggested no fault and the transformer has been classified into normal operation (see Table 1).
0
CO H2 CH4 C2H6 C2H4 C2H2
G
2008 2009 2010 2011 2012
Figure 4: Trend of hydrocarbon gas composition of Transformer 1
DGA interpretation using Doernenburg’s ratio has shown different results from year to year. There was an indication of low energy discharge in 2008 and thermal fault in 2011. In contrast, no fault indication was given by IEC ratio for five years in service. Similarly, Duval’s triangle approach provided no results. This is due to a low monthly increase rate of the hydrocarbon gases. Details of the DGA interpretations are shown in Table 1.
Table 1: DGA interpretations of Transformer 1
Year
IEC Ratio Normal Normal Normal Normal Normal
Duval’s
Triangle N/A N/A N/A N/A N/A
The formation of comparably high carbon oxides and hydrogen during first year of transformer operation may relate to an early stage oxidation of the transformer oil. These gases may be generated
not only as a result of faults within the equipment but also because of rusting process or other chemical reactions involving steel, uncoated surfaces or protective paints [7]. The amount of the produced gasses is very dependent on the characteristics of the oil, cellulose materials and other metallic components within the transformer.
This condition is signified by the reduction in hydrocarbon gas concentrations for the following years, which may indicate that the chemical reaction is reaching a new equilibrium point. The increase of methane and ethane proportion between year 2011 and 2012 however, has been a concern for further investigation. The transformer is currently continued in normal service.
3.2 Transformer 2 (10 years in service)
The second transformer has a similar type of Transformer 1. This apparatus has been in service for about ten years. The maximum transformer loading is about 14 MW. No failure was previously occurred during operation of the transformer. Oil degassing process or reclamation has also never been carried out.
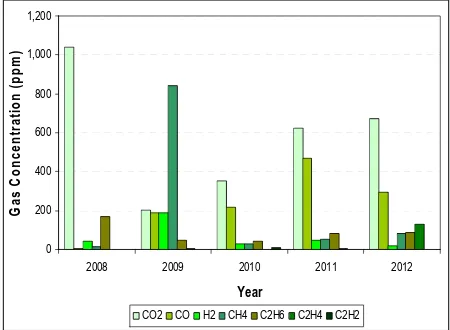
Individual gas concentration in oil for the last five years of Transformer 2 is presented in Figure 5. It can be seen that there was a consistence increase in concentration of carbon dioxide, methane, ethane and ethylene for the last four years. In 2008, a high concentration of ethane was recorded. The gas concentration suddenly decreased on the following year, before beginning to gradually increase again. In 2009, there was an abrupt increase in methane concentration and occurred only in single year.
0
2008 2009 2010 2011 2012
Year
CO2 CO H2 CH4 C2H6 C2H4 C2H2
Figure 5: Trend of individual gas concentration of Transformer 2
in acetylene proportion was noticed in 2010. For the last three years, the proportion of the key gases was dominated by carbon monoxide. Note also that in year 2012, the proportion of ethylene was increased significantly from the previous year. The summary of DGA interpretation using key gas and other techniques over the last five years is presented in Table 2.
0
CO H2 CH4 C2H6 C2H4 C2H2
G
2008 2009 2010 2011 2012
Figure 6: Trend of hydrocarbon gas composition of Transformer 2
Interpretation using Doernenburg’s ratio for the last four years indicated fault occurrence involving high energy discharge and thermal fault. Particularly in year 2012, similar diagnosis was also indicated by IEC ratio and Duval’s triangle approaches. Quite similar interpretation results were also observed in year 2009, however with a PD indication by Duval’s triangle technique. In other years of observation, results of the DGA interpretation techniques varied, thus it is difficult to provide a conclusive interpretation.
Table 2: DGA interpretations of Transformer 2
Year Approach
2008 2009 2010 2011 2012
Key Gas Normal Normal Normal
Cellulose
IEC Ratio Normal Thermal
Fault Normal Normal
Thermal been a concern for the continuity of the transformer service. DGA interpretations results indicated a possibility of fault occurrence involving high temperature. It has not been decided yet however, whether the transformer will be put into
maintenance. Currently, the transformer is still in service with a low loading scheme and further monitoring has been planned accordingly.
3.3 Transformer 3 (17 years in service)
The third transformer has a similar type to those of Transformer 1 and 2. The transformer has the longest period of service among the three. It has been in service for about seventeen years. The maximum daily transformer loading is about 40MW. No short circuit or other failure occurred during operation of the transformer. Oil degassing has not previously been carried out.
Figure 7 shows individual gas concentration in oil over the last five years for Transformer 3. Relatively high concentration of carbon dioxide is clearly observed. Although the concentration of the carbon dioxide gas decreased significantly in 2009 however, the gas concentration has been increased with a high rate during the last three years. The concentration of carbon monoxide was slightly increased during period of 2008 to 2011, before decreased significantly in year 2012. A comparatively small amount of other dissolved gasses was produced during this period.
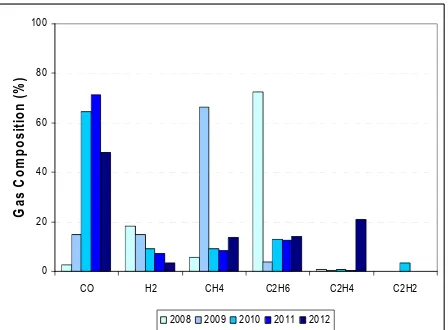
The key gas approach shows a variation of the dissolved gas proportion from year to year. The hydrocarbon gas compositions were dominated by carbon monoxide, with a proportion well above 70%. A noticeable increase in hydrogen and acetylene was observed in 2012. The trend of hydrocarbon gas composition of Transformer 3 can be seen in Figure 8.
2008 2009 2010 2011 2012
Year
CO2 CO H2 CH4 C2H6 C2H4 C2H2
Figure 7: Trend of individual gas concentration of Transformer 3
0
CO H2 CH4 C2H6 C2H4 C2H2
G
2008 2009 2010 2011 2012
Figure 8: Trend of hydrocarbon gas composition of Transformer 3
DGA interpretation using Doernenburg’s ratio technique showed a consistent indication of the occurrence of high energy discharge for the last four years, which was started by an occurrence of low energy discharge in year 2008. In contrary, normal operation was indicated by IEC ratio interpretation technique. Similarly, Duval’s triangle fault indicator has shown no particular results for the five years period.
Table 3: DGA interpretations of Transformer 3
Year Approach
2008 2009 2010 2011 2012
Key Gas
IEC Ratio Normal Normal Normal Normal Normal
Duval’s
Triangle N/A N/A N/A N/A N/A
Although the concentration and the increase rate of the hydrocarbon gasses are within their suggested limits, constant increase in carbon dioxide over the past four years has been focused for further investigation. This may be an indication of fault occurrence involving cellulose materials [7]. The equipment is currently kept servicing the network.
4 CONCLUSIONS
Investigation of DGA test results on power transformers has been carried out. Different test results from three transformers with different case and duration of service have been presented. In addition to the analysis of an individual gas concentration, the trends of dissolved gas concentration and proportion over time have been very useful in assisting researchers and engineers in monitoring condition of the power transformers.
DGA interpretation using several techniques showed variation in diagnosis results. This may lead to a difficulty in deriving comprehensive interpretation of DGA test results. Condition examination using combination of DGA with several other monitoring techniques, such as PD technique, furanic compound analysis, and FRA has been planned for future investigations.
5 ACKNOWLEDGMENTS
The authors greatly appreciate PT PLN (Persero) Transmission and Load Dispatch Centre for providing access to the investigated power transformers. The authors would also like to extend their appreciation to Udayana University for providing partial funding for the study.
6 REFERENCES
[1] S. Singh and M. N. Bandyopadhyay, “Dissolved Gas Analysis Technique for Incipient Fault Diagnosis in Power Transformers: A Bibliographic Survey”, IEEE EI Magazine, Vol. 26, No. 6, pp. 41-46, Nov/Dec 2010.
[2] S. Besner, J. Jalbert and B. Noirhomme, “Unusual Ethylene Production of In-Service Transformer Oil at Low Temperature”, IEEE Trans. DEI, Vol. 19, No. 6, pp. 1901-1907, Dec 2012.
[3] I. Höhlein-Atanasova, R. Frotscher, “Carbon Oxides in the Interpretation of Dissolved Gas Analysis in Transformers and Tap Changers”, IEEE EI Magazine, Vol. 26, No. 6, pp. 22-26, Nov/Dec 2010.
[4] M. Duval, “Calculation of DGA Limit Values and Sampling Intervals in Transformers in Service”, IEEE EI Magazine, Vol. 24, No. 5, pp. 7-13, Sep/Oct 2008.
[5] M. Arshad and S. M. Islam, “Significance of Cellulose Power Transformer Condition Assessment”, IEEE Trans. DEI, Vol. 18, No. 5, pp. 1591-1598, Oct 2011.
[6] A. Akbari, A. Setayeshmehr, H. Borsi, and E. Gockenbach, I. Fofana, “Intelligent Agent-Based System Using Dissolved Gas Analysis to Detect Incipient Faults in Power Transformers”, IEEE EI Magazine, Vol. 26, No. 6, pp. 27-40, Nov/Dec 2010.
[7] IEC Publication 60599, “Mineral Oil-Impregnated Electrical Equipment in Service – Guide to the Interpretation of Dissolved and Free Gases Analysis”, Mar 1999.