V
o
l. 28, No
. 2, 2016, pp
. 191-212
THE IMPORTANCE OF PERCEIVED
SERVICE VALUE IN RETAIL BANKING
SERVICES
VAŽNOST PERCIPIRANE VRIJEDNOSTI
USLUGA KOD BANKARSKIH USLUGA
Market-Tržište
Vol. 28, No. 2, 2016, pp. 191-212 UDK 159.937:658.89 336.71:658.64 Original scientifi c paper
Aleksandra Pisnika, Jasmina Dlačićb, Borut Milfelnerc
a) University of Maribor, Razlagova 14, 2000 Maribor, SLOVENIA, aleksandra.pisnik@um.si
b) University of Rijeka, Ivana Filipovića 4, 51000 Rijeka, CROATIA, jasmina.dlacic@ri.t-com.hr
c) University of Maribor, Razlagova 14, 2000 Maribor, SLOVENIA, borut.milfelner@um.si
Abstract
Purpose – In many industries, perceived service value is found to be a signifi cant mediator between perceived service quality and customer satisfaction and loyalty. Therefore, this paper aims to test a conceptual model of perceived service value with its antecedents, such as perceived price and perceived service quality, and con-sequences, customer satisfaction and loyalty, in the re-tail banking industry.
Design/Methodology/Approach – For the empiri-cal study, a measurement instrument was developed and tested for validity and reliability. Measures were assessed with exploratory factor analysis (EFA), confi r-matory factor analysis (CFA) and structural equation modeling (SEM). A structural model with fi ve refl ective constructs was evaluated to test direct and indirect rela-tionships among constructs.
Findings and implications – Results confi rm a medi-ating role of perceived value in relationships between perceived price, perceived service quality, customer satisfaction, and customer loyalty in the case of retail banking services.
Limitations – Because the results are directly relevant only to customers and marketing managers of retail banking services, generalizations of the fi ndings beyond the immediate population observed should be made with caution.
Sažetak
Svrha – U različitim granama djelatnosti percipirana vrijednost usluga istaknuta je kao značajan medijator između percipirane kvalitete usluga te zadovoljstva i odanosti korisnika. Stoga je svrha ovoga rada na primje-ru usluga u bankarskome sektoprimje-ru testirati konceptualni model percipirane vrijednosti usluga i njegovih utjecaj-nih faktora, kao što su percipirana cijena i percipirana kvaliteta usluga, te posljedica, zadovoljstvo i odanost korisnika.
Metodološki pristup – Za potrebe empirijskog istraži-vanja razvijen je mjerni instrument te testirana njegova valjanost i pouzdanost. Korišteni mjerni instrument pro-vjeren je kroz eksplorativnu faktorsku analizu, konfi r-matornu faktorsku analizu te strukturalno modeliranje. Strukt uralni model s pet refl ektivnih konstrukata analizi-ran je kako bi se testirale direktne i indirektne veze među konstruktima.
Rezultati i implikacije – Rezultati potvrđuju medijacij-sku ulogu percipirane vrijednosti u odnosu percipirane cijene i percipirane kvalitete te zadovoljstva i odanosti korisnika kod usluga u bankarskome sektoru.
Ograničenja – Kako su rezultati istraživanja direktno relevantni isključivo korisnicima bankarskih usluga i marketinškim menedžerima u bankama, treba se uzeti s oprezom generalizacija rezultata na druge usluge osim bankarskih.
V
o
l. 28, No
. 2, 2016, pp
. 191-212
Originality – This paper extends existing knowledge with both direct and indirect eff ects among researched concepts, and shows the importance of perceived ser-vice value in achieving satisfi ed and loyal customers in retail banking services.
Keywords – perceived service quality, perceived price, perceived value, customer satisfaction, customer loyal-ty, retail banking services
Doprinos – Ovaj rad zasniva se na postojećim spoznaja-ma te ih nadograđuje direktnim i indirektnim efektispoznaja-ma među istraživanim konceptima. On naglašava važnost percipirane vrijednosti usluga u postizanju zadovoljnih i odanih korisnika u bankarskim uslugama.
Ključne riječi– percipirana kvaliteta, percipirana cijena, percipirana vrijednost, zadovoljstvo potrošača, odanost korisnika, bankarske usluge
V o l. 28, No . 2, 2016, pp . 191-212
1. INTRODUCTION
The world economy is rapidly transforming into a service-oriented economy (Lovelock & Wirtz, 2011), above all in the emerging economies. This trend is refl ected in the vast number of market-ing research projects focused on services (Car-rillat, Jaramillo & Mulki, 2007). Nowadays, com-panies increasingly see themselves as service providers where the tangible product is an inte-gral part of the service (Caruana & Ewing, 2011). According to a vast majority of authors (e.g. Mo-lina, Martin-Consuegra & Esteban, 2007; Kaura, Durga Prasad & Sharmam, 2015; Caruana & Ew-ing, 2011) in the fi eld, the challenge for service fi rms is primary to identify the critical factors that determine customer satisfaction and loyal-ty. The perceived value, as well as its anteced-ents and consequences, have been claimed to be important in industries with higher customer involvement, such as the banking industry (An-gur, Nataraajan & Jahera, 1999).
Several research projects dealing with the re-lationship among perceived service quality, customer satisfaction and loyalty have been conducted, the majority of them in developed economies, mostly in the U.S. (Yavas, Benken-stein & Stuhldreider, 2004; Mittal & Gera, 2012). A limited number of research projects investigating the quality of retail banking services for custom-ers have been implemented in the European Union, and are restricted to Germany and Greece (Athanassopoulos, Gounaris & Stathakopoulos, 2001; Yavas et al., 2004). Lately, this trend of re-search is gathering pace in developing countries too (e.g. Mittal & Gera, 2012), with some making comparisons to Western economies (Ladhari, Ladhari & Morales, 2011). Very few studies have dealt with the perceived value of retail banking services as a central concept through more so-phisticated models of relationships, including analyzing the mediating role of perceived value and perceived service quality, although there is evidence that perceived value is a signifi cant mediator between perceived service quality and behavioral intentions (Mittal & Gera, 2012).
Fur-thermore, to our knowledge, no such research has been implemented in emerging economies of Central Europe (CEE).
Examining the perceived value of retail banking services in a CEE country makes sense for several reasons. First, previous research classifi ed banks according to diff erent criteria, which are primarily economic in nature, while neglecting marketing aspects, in particular perceived service quality (Al-Marri, Moneim, Ahmed & Zairi, 2007) or per-ceived service value. Second, several authors (e.g. Ahmed, 2002; Nyer, 2000; Sureshchandar, Rajen-dran & Anantharaman, 2002; Al-Marri et al., 2007) stress the lack of marketing services research in emerging economies to help gain an under-standing of which activities contribute to stron-ger business performance of retail banks. This is important in the time of current economic tur-moil and in the current process of bank restruc-turing. Third, banking environment has changed considerably over the past 20 years (Feldin, Košak, Prašnikar, Rašković & Žabkar, 2009). The banking sector has been dealing with changes in demand, technological changes, regulatory changes, and with the entry of new competitors, from other business (Gardener, Howcroft & Wil-liams, 1999). In such circumstances, higher levels of market orientation are required. Evidence from some CEE countries (Kolar, 2006) suggests that, in comparison to retail banks in developed EU countries, domestic retail banks achieve a lower degree of market orientation. This is probably so because such banks mostly off er core services without implementing any diff erentiated mar-keting strategies, and are therefore not special-ized or focused on individual customers’ needs. Our speculation is that, in the early days of eco-nomic transition, retail banks in CEE countries were preoccupied with a reconstruction of core business processes. So, they have started adapt-ing their marketadapt-ing activities to customer’s wants and needs only recently. The intensifi cation of competition from foreign retail banks has some-how forced domestic retail banks in emerging economies to pay closer attention to delivering value to the customer and value related
satisfac-V
o
l. 28, No
. 2, 2016, pp
. 191-212
tion and loyalty; these are among the key success factors for many fi rms that are considered an im-portant source of competitive advantage (Wang, 2010). Customer loyalty, as one of the most im-portant determinants of business success, has recently received increasing scholarly attention, especially in researching drivers that infl uence loyalty, directly and indirectly (Caruana & Ewing, 2011). Finally, some authors claim that perceived value with its antecedents and consequences plays an important role in the industries with a high degree of client involvement such as retail banking (Angur et al., 1999), and that perceived service value is of focal importance in delivering superior business performance.
The opportunity to advance the understanding of concepts of perceived service quality and perceived value in the banking sector provides the foundation for this paper. Therefore, this paper brings three main contributions to the topic. It provides a deeper insight into the rela-tionships between antecedents (perceived ser-vice quality, perceived price) and consequences (customer loyalty and customer satisfaction) in the context of an emerging CEE economy. It also shows how perceived value mediates the relationship between the researched concepts. Furthermore, contribution is also found in iden-tifying both direct and indirect eff ects of per-ceived price and perper-ceived service quality on researched consequences.
The theoretical background of this paper is presented in three sections. In the fi rst section, the perceived service value theory is explained, followed by perceived value antecedents in the second and perceived value consequenc-es in the third section. Altogether, fi ve rconsequenc-esearch constructs, namely perceived price, perceived service quality, perceived value, customer satis-faction, and loyalty are defi ned. Secondly, based on the conceptual model, hypotheses are de-veloped. The empirical study is presented in two sections, methodology and results section. Finally, results are interpreted in the discussion section, also addressing managerial implica-tions and limitaimplica-tions of the research.
2. THEORETICAL
BACKGROUND
Perceived service value
In the process of delivering value to its custom-ers, companies should consider the complexity of perceived value, as well its antecedents and consequences. The understanding of these con-structs may not only lead to greater satisfaction of customers, but also to building sustainable competitive advantage. While the relationship between perceived service quality and custom-er satisfaction have been well investigated in the past, perceived value has remained a compar-atively neglected aspect of customers’ service experiences (Caruana, Money & Berthon, 2000; Petrick, 2002; Gallarza, Saura & Moreno, 2013). In the literature, perceived value is commonly defi ned as the customer’s overall assessment of the utility of a product (or service) based on the perceptions of what is received and what is giv-en (Zeithaml, 1988). A value judgmgiv-ent is the cus-tomer’s assessment of the value that has been created for them by a supplier, given the trade-off s between all relevant benefi ts and sacrifi c-es in a specifi c-use situation (Ulaga & Chacour, 2001; Woodall, 2003).
Authors also agree that perceived customer val-ue is a multidimensional concept (Gallarza & Sau-ra, 2006; Sanchez, Callarisa, Rodriguez & Moliner, 2006; Cronin, Brady & Hult, 2000), one which can be defi ned from a rational and emotional perspective (Sanchez et al., 2006). Perceived val-ue is considered as one of the most infl val-uential antecedents of customer satisfaction (Eggert & Ulaga, 2002), loyalty, and repurchase behavior (Cronin et al., 2000). As such, perceived value is a relevant issue for banking fi rms. However, only rare studies in the banking industry (Fan-dos Roig, Sancez Garcia, Moliner & Monzonis, 2006; Chen, Chang & Chang, 2005; Bick, Brown & Abratt, 2004; Cengiz, Ayyildiz & Bünyamin, 2007; Shamdasani, Mukherjeeb & Malholtra, 2008) have recognized the importance and included the perceived value concept in bank customer satisfaction research. Results of these studies
V
o
l. 28, No
. 2, 2016, pp
. 191-212
indicate that perceived value is an important mediator in customer satisfaction and loyalty creation. It is related to bank service quality, per-ceived risk, and customers’ intentions for contin-ued interaction (Shamdasani et al., 2008).
Antecedents of perceived value
Perceived price is the factor in consumer pre-, as well as post-purchase behavior. Although many research studies have emphasized the importance of perceived value and the role of perceived price in that relationship, a limited number of empirical research has investigated the infl uence of perceived price on consum-er behavior in the sconsum-ervice industry (Ryu & Han, 2010). Perceived price is usually considered as perceived sacrifi ce that customers experience as a combination of nominal price (monetary costs) and all other customer costs (non-mon-etary costs) of service acquisition and its use (e.g. Zeithaml, 1988; Sweeney, Soutar & John-son, 1999; Ulaga & Chacour, 2001). Concerning retail bank services, monetary price includes the cost of loans and commissions. Non-monetary price consists of factors such as time, eff ort or energy, which may play just as important role as does price in money terms (Wang, Lo, Chi & Yang, 2004). Regarding non-monetary aspects of price, Zeithaml (1988) dealt with the costs of search, waiting, etc. – in short, all eff orts, risks, and insecurities connected to the acquisition and use of a product. Consumer behavior fre-quently involves risk in the sense that any ac-tion of a consumer will produce consequences which cannot be anticipated with certainty, and some of which are likely to be unpleasant (Shamdasani et al., 2008). Broadening the defi -nition of perceived price with non-monetary aspects increases the share of subjective dimen-sion in the perception of prices, which is further enhanced by a heterogeneous attitude of cus-tomers towards the utility they obtain from a product or service (Padula & Busacca, 2005). One should consider that the defi nition of per-ceived price in this study is broader than the classic (economic) defi nition of price according
to which the price of a certain product or ser-vice consists only of the number of money units that are paid by customers to obtain a unit of a product. Also, the concept of price is under-stood as a separate concept, which is related to perceived value. Authors who included per-ceived price in empirical research mostly dealt with monetary factors, although there are some rare exceptions (e.g. Petrick, 2004). Concerning the non-monetary costs in the banking indus-try, most authors (Cunningham, Gerlach & Harp-er, 2005; Shamdasani et al., 2008) stress the im-portance of safety, privacy, and perceived risks. Chen and Chang (2005) claim that, because of the nature of retail banking services, fi nancial risks are the most important.
Most scientifi c studies of perceived value in the last 20 years have included perceived service quality as a major antecedent in the quality-value models (e.g. Cronin et al., 2000; Parasuraman & Grewal, 2000; Petrick, 2002). Marketing literature defi nes perceived service quality as the customers’ overall assessment of service superiority. As such, it diff ers from objec-tive quality, which involves an objecobjec-tive aspect or feature of a thing or event when considering services (Rowley, 1998). An important develop-ment in contemporary marketing is the shift in focus from product towards services dominant logic (Caruana & Ewing, 2011; Vargo & Lusch, 2008). Companies worldwide and those CEE countries increasingly see themselves as service providers, where the tangible elements of the product are an integral part of the service deliv-ered and, therefore, an important aspect of per-ceived service quality. In that respect, Zeithaml (1988, 2000) defi nes perceived service quality as the consumers’ judgment about an entity’s (services’) overall excellence. It is created in re-lationships between customers and suppliers in which both parties are active. It embodies a relatively lower intensity of an aff ective compo-nent in the perception of a service (Oliver, 1997). The most popular defi nition of quality is very close to the defi nition of customer satisfaction and relates to meeting/exceeding expectations. That is why the concept of service quality can
V
o
l. 28, No
. 2, 2016, pp
. 191-212
be diffi cult to defi ne (Cronin & Taylor, 1992; Para-suraman, Berry & Zeithaml, 1993; Brady & Cronin, 2001) and shows that there is neither an accept-ed nor the best defi nition of quality for every sit-uation. Consequently, theoretical fi ndings in the area of service quality did not match the needs of practice until late.
On the basis of original SERVQUAL scale, Bahia and Nantel (2000) have developed a Banking Services Quality scale. Choudhury’s (2007) re-cent study concerning the perceived service quality dimensionality in the retail banking in-dustry suggests that customers distinguish four dimensions of service quality in the case of the retail banking industry in India; namely, attitude, competence, tangibles, and convenience. Other authors have empirically researched the quali-ty of retail banking services (Lee & Hwan, 2005; Çalik & Balta, 2006; Choudhury, 2007; Cengiz et al., 2007; Shamdasani et al., 2008). Perceived ser-vice quality in most of the cases is explored as a customer’s overall assessment of service superiority. Consequently, Zeithaml’s (1988, 2000) defi -nition of perceived quality as the consumers’ judgment about an entity’s (services’) overall excellence is also applied in this study.
Perceived value consequences
One of the major and most frequently included consequences of perceived value is customer satisfaction. Jones & Sasser (1995) stressed that achieving customer satisfaction is the pri-mary goal for most service companies. In the services marketing literature, customer satis-faction has traditionally been explained as a complex human process, which involves both cognitive and aff ective processes. According to many studies (Parasuraman, Zeithaml & Ber-ry, 1985; Tse & Wilton, 1988; Chu, 2002), custom-er satisfaction follows Olivcustom-er’s expectancy dis-confi rmation theory (Oliver, 1997). This theory suggests that customer satisfaction should be defi ned as how well a product or service ful-fi lls pre-purchase expectations of consumers. In some service industries, and in the banking industry as well, services are often
homoge-nous in nature, which implies the importance for managers to seek strategies to diff erentiate their services from competitors. Based on that and on the research by Giese and Cote (2000), Caruana (2002) defi nes customer satisfaction with retail banking services as a post-purchase, global aff ective summary response that may be of diff erent intensities, occurring when customers are questioned and interviewed in relation to the retail banking services off ered by competitors. Hence, customer satisfaction in this study is approached by comparing ex-pectations or expected value with the actual-ly delivered perceived value in retail banking services.
A customer’s perception of the value received from a service provider could motivate the cus-tomer to patronize the provider again (Wang, 2010); it has also been proved by numerous re-search results to be one of the consequences of perceived value.Usually, authors investigate a direct link from perceived value (e.g. Cronin, Brady, Brand, Hightower & Shemwell, 1997) or an indirect link through customer satisfaction (Cro-nin et al., 2000; Ryu, Han & Kim, 2008; Gallarza et al., 2013). There are several defi nitions of cus-tomer loyalty: (1) loyalty as an attitude some-times described as a long-lasting desire to be in a relationship with the brand or a fi rm (Guest, 1944); (2) loyalty mainly expressed in terms of revealed behavior, i.e. the pattern of past pur-chases (Thiele & Mackay, 2001); and (3) buying moderated by the individual’s characteristics, circumstances, and/or the purchase situation (Caruana, 2002). Banking loyalty in this study is defi ned as the continuing patronage of a par-ticular retail bank by a client over time, through the number and frequency of services used and through likelihood of switching or staying with a provider in the future (Lewis & Soureli, 2006). The benefi ts of customer loyalty to a provider of either services or products include lower cus-tomer price sensitivity, reduced expenditure on attracting new customers and improved profi t-ability (Rowley, 2005).
V
o
l. 28, No
. 2, 2016, pp
. 191-212
3. THE CONCEPTUAL MODEL
AND HYPOTHESES
DEVELOPMENT
Past research shows that authors have often equated the concept of perceived service qual-ity with that of perceived value, but this confl a-tion was due to inadequate understanding of the concepts (Caruana et al., 2000). Concern-ing the basic defi nition of perceived value, it is clear that the unifi cation of the two concepts is not appropriate. Perceived service value is the function of customers’ comparison of all the benefi ts derived from the purchase and use of a service, along with all the costs (sacrifi ces) as-sociated with the purchase and use of the ser-vice. Therefore, many authors conclude that the concept of perceived service quality is a similar but diff erent concept from perceived service value (Bolton & Drew, 1991; Wang et al., 2004; Sanchez-Fernandez & Iniesta-Bonillo, 2007). Be-cause of this diff erence we can conclude that quality is one and, according to Gallarza and others (2013), probably the major component of value. Also, in most cases (Sweeney et al., 1999; Teas & Agarwal, 2000; Petrick, 2004), perceived service quality leads to higher perceived service value, therefore we posit that:
H1: The higher the perceived quality of retail banking services, the higher their perceived value.
The similarities between the concepts of cus-tomer satisfaction and perceived service value are also a matter that demands a thorough-going discussion. Since customer satisfaction could be defi ned as the fulfi llment of customer expectations, the affi nity between customer satisfaction and perceived value lies in their sub-jectivity and also in their use of comparison. In the case of perceived value, customers compare benefi ts and sacrifi ces, whereas, in the case of customer satisfaction, they compare their ex-pectations or expected value with the actually delivered perceived value. These concepts are diff erent but complementary to one another (Woodruff & Fisher Gardial, 1996; Eggert &
Ula-ga, 2002). A plethora of research on perceived value includes relationships or eff ects of the perceived value on customer satisfaction or vice versa (Parasuraman, 1997; Woodruff , 1997; Oliver, 1999). Most of the authors conceptualize perceived value as an antecedent of satisfac-tion, rather than satisfaction as an antecedent of perceived value (Caruana et al., 2000; McDou-gall & Levesque, 2000), as suggested by Wood-ruff (1997). Based on the above discussion, we propose the following hypotheses:
H2: The higher the perceived value of retail banking services, the higher the customer satisfaction with these services.
The research exploring a relationship between perceived service quality and customer sat-isfaction can be divided into two groups. The fi rst group of research studies examined only the direct relationship between perceived ser-vice quality and customer satisfaction without taking into account the mediating role of per-ceived value (e.g., Drew & Bolton, 1991; Jamal & Nasser, 2002; Yavas et al., 2004); The second group considers the relationship together with the perceived value (e.g. Cronin et al., 2000). We can postulate that the increase in perceived service quality leads to higher quality percep-tions, which in turn determine higher customer satisfaction. Based on fi ndings by Wang, Lo and Yang (2004) and Cronin and others (2000) that perceived service quality impacts perceived val-ue and perceived valval-ue impacts satisfaction, we can speculate that not only a direct but also an indirect relationship exists between perceived service quality and customer satisfaction. This proposes the following two hypotheses: H3: The higher the perceived quality of retail
banking services, the higher the customer satisfaction with these services.
H4: Perceived value mediates the relationship between perceived quality and customer satisfaction with retail banking services. Irrespective of the perceived value defi nition, perceived price is of prime importance to cus-tomer perceptions of value. A higher price
V
o
l. 28, No
. 2, 2016, pp
. 191-212
would usually indicate lower perceived value and vice versa, thus price is a negative dimen-sion of perceived value. Monroe (1990) argues that customers value the reduction in sacrifi ces more than an increase in benefi ts. The empir-ical measurement of perceived value usually includes price perceptions (Ryu & Han, 2010). There is limited evidence concerning the rela-tionships between perceived value, perceived price and customer satisfaction. Based on pre-vious research (Wang, Lo & Yang, 2004; Fandos Roig et al., 2006) that perceived price infl uenc-es perceived value, and studiuenc-es indicating that perceived value infl uences forming satisfaction (Cronin et al., 2000), it can be inferred that per-ceived value is a mediator between those two constructs. Therefore, we propose the following hypothesis:
H5: The more favorable the perceived price of retail banking services, the higher the per-ceived value of retail banking services. H6: Perceived value mediates the relationship
between perceived price and customer sat-isfaction with retail banking services. The seventh hypothesis is based on the con-fi dence in a generally accepted positive rela-tionship between customer satisfaction and customer loyalty, as well as the vast amount of research results (Cronin et al., 2000; Ulaga & Chacour, 2001; Sanchez-Fernandez & Inies-ta-Bonillo, 2007), and we propose:
H7: The higher the level of customer satisfaction with retail banking services, the higher cus-tomer loyalty.
High customer’s value perception of the service experience usually motivates the customer to return to the service provider. Therefore, per-ceived value should be positively related not only to customer satisfaction, but to customer loyalty as well (Bolton & Drew, 1991; Woodruff , 1997; Yang & Peterson, 2004). Perceived value can contribute to loyalty as a positive form of behavioral intention (Chaudhuri & Holbrook, 2001; Cronin et al., 2000). According to Gallarza and others (2013), besides the indirect
relation-ships between value, satisfaction and loyalty, perceived value can also have a direct infl uence on customer loyalty. The same author also ar-gues that no study has tested this full set of link-ages simultaneously, and that this task should remain a crucial goal for future research. Hence, we defi ne two hypotheses:
H8: The higher the perceived value of retail banking services, the higher customer loy-alty.
H9: Customer satisfaction mediates the relation-ship between perceived value and custom-er loyalty in the case of retail banking scustom-er- ser-vices.
In the empirical part of exploration regarding the suggested hypotheses, we attempt to show the mediating role of the perceived value of re-tail banking services in relationships between perceived price, perceived service quality, cus-tomer satisfaction and cuscus-tomer loyalty in the case of retail banking services. By empirical ver-ifi cation of these hypotheses, a comprehensive integrative model of relationships between the perceived value antecedents, i.e. perceived ser-vice quality, and perceived price, as well as the perceived value consequences, i.e. customer satisfaction and loyalty in the case of retail bank-ing services, was developed.
4. METHODOLOGY
Measurement instrument development
The measurement instrument for the empiri-cal study was developed in three steps. First, after the literature review, some of the relevant items for the questionnaire were identifi ed. This preliminary phase also included a focus group with postgraduate students at the University of Maribor, Slovenia. In the second step, in-depth interviews with eight bank managers and four experts from the marketing fi eld were conduct-ed to generate an additional pool of items and in order to test the content validity.
Items from the original SERVPERF scale (Cronin & Taylor, 1992) were used to measure perceived
V
o
l. 28, No
. 2, 2016, pp
. 191-212
service quality, while items for the measurement of perceived value were adopted from Cronin (2000). Oliver’s (1997) scale was adopted for the measurement of customer satisfaction. In the process of customer loyalty scale development, all generally used items in customer loyalty re-search of retail banking services have been tak-en into the consideration (e.g. Beerli, Martin & Quintana, 2004; Pont & McQuilken, 2005; Lewis & Soureli, 2006; Leverin & Liljander, 2006). The development of a scale for measuring perceived price was predominantly based on the results of our qualitative research, with that used for non-monetary costs partially adopted from Pet-rick (2002). Then, the questionnaire was exam-ined by six academics in the fi eld of marketing to determine content validity and to help avoid redundancy. In the third step, a pilot survey was conducted on a sample of 234 retail banking customers. This way the internal consistency of the scales used in the fi nal study was tested and non-relevant items were dropped where exploratory factor analysis showed low loadings or cross loadings on multiple indicators. In the fi nal study, the items in the questionnaire were measured on a 5-point Likert scale (from 1 = “strongly disagree” to 5 = “strongly agree”). Eleven items were used for the measurement of perceived service quality, four items for per-ceived price, three items for perper-ceived value, three items for customer satisfaction, and three for customer loyalty. This accounted for a total of 24 items out of 68 items at the beginning. Measurement scales were validated in the pre-vious study (Pisnik, Snoj & Žabkar, 2012). Exploratory factor analysis using SPSS, and con-fi rmatory factor analysis and structural equation modeling using AMOS were applied in the data analysis.
Sampling frame and data collection
Data for the main research was collected from 700 retail banking customers in Slovenia by means of a telephone interview. The strata sam-ple framework was representative regarding basic demographic characteristics. It was also
representative as far as the structure of retail banking customers and the number of inhabi-tants in each Slovenian region is concerned. The fi nal structure of the sample corresponded to the market shares of retail banks in Slovenia at the time of the research. The response rate of 59.07 % is relatively high, according to the data collection method. The standard error of the sample at the 95 % confi dence level was +/- 3.7 percentage points.
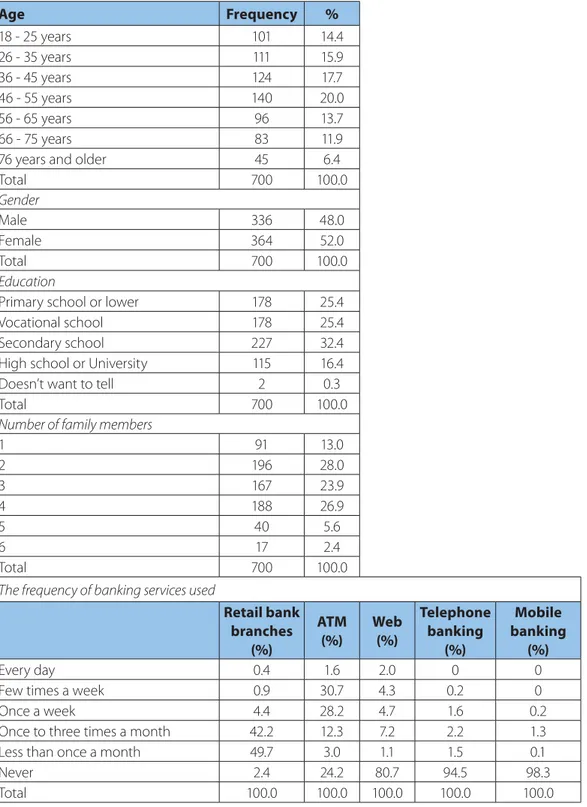
Table A1 in the Appendix shows that the dai-ly visits to retail banking branches are rare, as 42.2 % of respondents visit branches once to three times a month. Using an ATM is more common, with as many as 60.4 % of respon-dents using ATM retail banking services at least once a week. Web is characterized by a high proportion of respondents who never use e-banking; however, the proportion of e-bank-ing users use-bank-ing web services is rise-bank-ing rapidly not only worldwide (Gerrard & Cunningham, 2003) but in Slovenia as well (Žižek & Žižek, 2015). Very few respondents use retail banking services by telephone or mobile phone. We can conclude that the users of retail banking services in Slo-venia still have very traditional behaviors since retail banks in Slovenia have just recently started to develop and promote mobile banking more seriously.
Non-response bias and common method bias
Before the fi nal analysis, we tested the non-re-sponse bias using the t-test method, for inves-tigating the diff erences between the groups of early and late respondents. Insignifi cant t-test results showed no diff erences between the an-swers of early and late respondents. Since the data for the both (dependent and independent) constructs were collected by the same means, we also applied the test for common method bias. According to Podsakoff and Organ (1986), the Harman one-factor test can be used in such cases. The factor analysis showed that we can extract fi ve factors accounting for 51.46 % of the total variance.
V
o
l. 28, No
. 2, 2016, pp
. 191-212
Dimensionality, reliability and validity of the scales
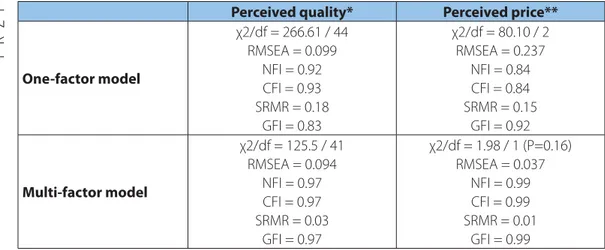
After preliminary exploratory factor analysis (EFA), confi rmatory factor analysis (CFA) was per-formed. For the constructs of perceived service quality and perceived price two measurement models were compared: (a) a one-factor model, where perceived service quality and perceived price were conceptualized as uni-dimensional and where the covariance for all the items could
be accounted for by a single factor; and (b) a multi-factor model, where perceived service quality and perceived price were conceptual-ized as multi-dimensional and where covaria-tions among the items could be accounted for by several restricted fi rst-order factors. Summa-ry statistics for both models are shown in the Appendix, Table A2. For both constructs, the multi-factor models were found to outperform the single factor models on absolute measures
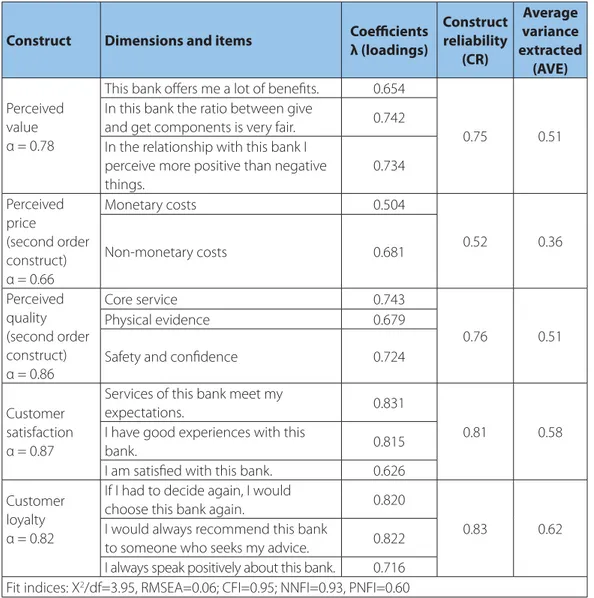
TABLE 1: Items, standardized loadings, construct reliabilities, and average variance extracted for the con-ceptual model
Construct Dimensions and items Coeffi cients λ (loadings) Construct reliability (CR) Average variance extracted (AVE) Perceived value α = 0.78
This bank off ers me a lot of benefi ts. 0.654
0.75 0.51
In this bank the ratio between give
and get components is very fair. 0.742 In the relationship with this bank I
perceive more positive than negative things. 0.734 Perceived price (second order construct) α = 0.66 Monetary costs 0.504 0.52 0.36 Non-monetary costs 0.681 Perceived quality (second order construct) α = 0.86 Core service 0.743 0.76 0.51 Physical evidence 0.679
Safety and confi dence 0.724
Customer satisfaction α = 0.87
Services of this bank meet my
expectations. 0.831
0.81 0.58
I have good experiences with this
bank. 0.815
I am satisfi ed with this bank. 0.626
Customer loyalty α = 0.82
If I had to decide again, I would
choose this bank again. 0.820
0.83 0.62
I would always recommend this bank
to someone who seeks my advice. 0.822
I always speak positively about this bank. 0.716 Fit indices: Χ2/df=3.95, RMSEA=0.06; CFI=0.95; NNFI=0.93, PNFI=0.60
V
o
l. 28, No
. 2, 2016, pp
. 191-212
FIGURE 1: Standardized direct path estimates
All paths signifi cant at p<.01
Fit indices: Χ2/d.f.=5.034, RMSEA = 0.07; CFI = 0.94; NNFI = 0.92, PNFI = 0.71 (χ2, GFI, and RMSEA), incremental fi t measure
(CFI), and parsimonious fi t measures (χ2/df). The
majority of the fi t indices were within the sug-gested interval.
Composite reliability measures were used to as-sess the reliability of the perceived service qual-ity and perceived price subscales. The construct reliability coeffi cient (CR) of the three subscales used for measuring perceived service quality ranged from 0.84 to 0.88 (Appendix, Table A3) and from 0.69 to 0.73 for perceived price (Ap-pendix, Table A4), which met the standard of 0.6 suggested by Fornell and Larcker (1981). Next, construct validity of single subscales was assessed by examining convergent and discrim-inant validity. Evidence of convergent validity in the single constructs was determined by in-specting the variance extracted (AVE) for each factor, as shown in the Appendix, Table A3 and Table A4. CFA results showed that, in all cases, the AVE reached the suggested value of 0.50 (Fornell & Larcker, 1981). Also, the correlations (Appendix, Table A5) between the suggested dimensions were statistically signifi cant.
Further, discriminant validitywas assessed for the subscales of perceived service quality and perceived price of retail banking services. Series of CFAs were performed for all pairs of con-structs. In every case, the chi-square diff erences between the fi xed and free solutions were sig-nifi cant at p<0.05.
Finally, reliability, convergent validity, and dis-criminant validity were assessed for all other constructs in the conceptual model (perceived value, satisfaction, and loyalty) and also for sec-ond-order perceived price and perceived ser-vice quality constructs. The results, presented in Table 1, indicate that all measures are within the suggested intervals.
5. RESULTS
In the fi nal stage of the research, the proposed conceptual model was tested by using struc-tural equation modeling. The overall strucstruc-tural model is shown in Figure 1.
An overall fi t assessment of the model yield-ed a signifi cant chi-square value (χ2(67)=264.9;
<3D= <3B? <3D? <3C> <3D> <3@E <3D> <3BD <3C> <3C@ <3C? <3C@ <3BA <3BD <3A< #%)#% #%))( #%)$(', = > @ 6= 6> 6? = > < (&'" %",', = > @ (&'" %&'&'"!
V
o
l. 28, No
. 2, 2016, pp
. 191-212
p < 0.05), which indicates a non-perfect fi t. How-ever, according to Bollen (1989) other fi t indices should be used, since χ2 may be an
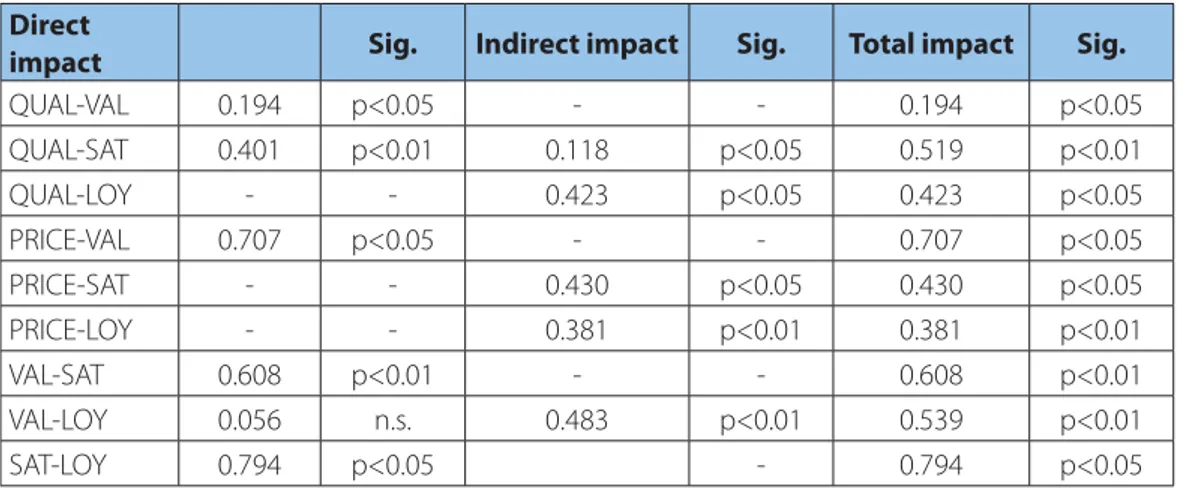
inappropri-ate standard when dealing with the complex model and with the large sample size. Other fi t indices remained in the proposed range (Hoop-er, Coughlan & Mullen, 2008). Also, signifi cance levels for both indirect and total impacts were calculated using bootstrapping method. Table 2 provides an overview of the estimated eff ects within the causal model regarding the selected hypotheses.
As predicted by H1, perceived retail banking service quality is positively related to perceived value (β1 = 0.194; p<0.05). The relationship be-tween perceived service quality and custom-er satisfaction with retail banking scustom-ervices is stronger than the quality-value relationship (β2 = 0.401; p<0.01). Therefore, it can be assumed that the relationship between perceived service quality and customer satisfaction is direct, but also indirect through perceived value. As ex-pected, positive and signifi cant coeffi cient were also present for the path from perceived value to customer satisfaction (β3 = 0.608; p<0.01).
Ac-cording to these fi ndings, we can confi rm hy-potheses H1, H2 and H3.
The indirect eff ect of perceived service quali-ty on customer satisfaction through perceived value was also positive and signifi cant, with a re-gression coeffi cient of 0.118 (p<0.05). The results showed that the total eff ect of perceived service quality on customer satisfaction, which is defi ned as a sum of direct eff ect (β2 = 0.401; p<0.01) and indirect eff ect (β11 = 0.118; p<0.05), was greater (β11 +β2 =0.519; p<0.01) than just a direct rela-tionship between perceived service quality to customer satisfaction (β2 = 0.401; p<0.01). Con-sidering the results, perceived value mediates the relationship between perceived quality and customer satisfaction of retail banking services; therefore, we can confi rm hypothesis H4.
Considering the eff ect of perceived price on perceived value, the analysis showed that the relationship between perceived price and per-ceived value is quite strong and signifi cant, with a regression coeffi cient γ2 = 0.707 (p<0.05). Thus, hypothesisH5 was also confi rmed. Furthermore, the indirect eff ect of perceived price on cus-tomer satisfaction through perceived value was
TABLE 2: Direct, indirect, and total impacts with global fi t indices of the model
Direct
impact Sig. Indirect impact Sig. Total impact Sig.
QUAL-VAL 0.194 p<0.05 - - 0.194 p<0.05 QUAL-SAT 0.401 p<0.01 0.118 p<0.05 0.519 p<0.01 QUAL-LOY - - 0.423 p<0.05 0.423 p<0.05 PRICE-VAL 0.707 p<0.05 - - 0.707 p<0.05 PRICE-SAT - - 0.430 p<0.05 0.430 p<0.05 PRICE-LOY - - 0.381 p<0.01 0.381 p<0.01 VAL-SAT 0.608 p<0.01 - - 0.608 p<0.01 VAL-LOY 0.056 n.s. 0.483 p<0.01 0.539 p<0.01 SAT-LOY 0.794 p<0.05 - 0.794 p<0.05
Fit indices: Χ2/df=5.034, RMSEA=0.07; CFI=0.94; NNFI=0.92, PNFI=0.71
Notes: QUAL – perceived quality; VAL – perceived value; SAT – customer satisfaction; LOY – customer loyalty, PRICE – per-ceived price
V
o
l. 28, No
. 2, 2016, pp
. 191-212
also quite strong, positive, and signifi cant, with a regression coeffi cient of 0.430 (p<0.05). Results show that perceived value mediates the rela-tionship between perceived price and custom-er satisfaction of retail banking scustom-ervices; hence, we can also confi rm hypothesis H6.
As expected, our results show very strong, positive and signifi cant eff ect of customer sat-isfaction on customer loyalty of retail banking services. The regression coeffi cient for this re-lationship is β4 = 0.794 (p<0.01), confi rming hypothesis H7. Finally, perceived value has a non-signifi cant eff ect on customer loyalty, but the indirect eff ect is strong (0.483) and signifi -cant at p<0.01. We can clearly conclude that customer satisfaction plays a signifi cant role of a mediator between perceived value and cus-tomer loyalty. On that basis, we can confi rm H8 and H9 as well.
6. DISCUSSION AND
IMPLICATIONS
Our research highlights the role of perceived service value as the core element of contem-porary marketing eff orts with its antecedents and consequences. Nowadays, off ering as many benefi ts that are important to customers as possible and minimizing their monetary and non-monetary costs is crucial for business suc-cess. This paper has attempted to extend the existing knowledge with both direct and indi-rect eff ects among researched concepts, and to research a mediating role of perceived value in retail banking services.
The results demonstrate that the concept of perceived value is valid and reliable for compa-nies operating in the banking industry in a CEE economy. It can be applied to understanding customers’ overall assessments of the utility of retail bank services. In the empirical study of retail banking services, we linked: (1) perceived price to perceived value, (2) perceived service quality directly and indirectly to customer sat-isfaction and directly to perceived value, (3) perceived value to customer satisfaction and
customer loyalty, and (4) customer satisfaction to customer loyalty.
The fi rst important fi nding of our study is that perceived service quality includes a set of sub-jective components, which means that custom-ers do not perceive only rational components of off erings, but are also growing increasingly sensitive to the emotional aspects of services. Perceived price, which is composed of mon-etary and non-monmon-etary components, has a very strong direct infl uence on perceived value; indeed, this relationship is the strongest in the whole model. That is somehow expected as the price might be one of the greatest competitive advantages in fi nancial services. Furthermore, price is one of the tangible elements of the off er, while perceived service quality is fi rst of all a multi-dimensional concept, which is very intangible and can also vary heavily among diff erent banking services providers. Howev-er, increased competition and liberalization of markets have infl uence on the equalization of prices. Therefore, authors believe that, in the fu-ture, non-monetary elements will become even more important for enhancing perceived ser-vice value in the eyes of customers and will form a strong basis for competitive diff erentiation. In addition to direct eff ects, indirect eff ects of perceived price are also important and signifi -cant. The results show quite strong, positive, and signifi cant indirect relationships between perceived price, customer satisfaction, and cus-tomer loyalty. Therefore, we can clearly see the importance of perceived value which mediates these relationships. This result has an import-ant implication for business practice. Indeed, in search for providing higher levels of customer satisfaction and loyalty, retail bank managers should consider both sides of perceived value respectively; benefi ts, as well as monetary and non-monetary elements of the price.
According to the results, we can conclude that higher perceived service quality of retail bank-ing services can contribute to perceived value and to more satisfi ed clients. It is interesting
V
o
l. 28, No
. 2, 2016, pp
. 191-212
that the impact of perceived service quality on satisfaction is signifi cantly stronger than the impact on perceived value. The explanation of the results may be that (high) quality of retail banking services today is largely expected and, therefore, does not present additional bene-fi ts to customers. On the other hand, it is very important for their perception of satisfaction. As soon as customers perceived a lack of ex-pected high quality, they might be dissatisfi ed. Also, perceived service quality by itself does not necessary directly produce greater levels of sat-isfaction, since it does not include the concept of sacrifi ce, which is a prominent dimension of perceived value. Further, it is necessary to em-phasize that this study did not specifi cally evalu-ate disconfi rmation between the expected val-ue and the actual perceived valval-ue, which could give us even more insight into the problem and probably defi nitive answer on commented rela-tionship. Ensuring the quality of retail banking services is highly important because, besides the direct, perceived service quality also has an indirect positive impact on satisfaction.
In addition, medium strong indirect impact of perceived service quality on customer loyalty was identifi ed. Perceived service quality in our model aff ects customer loyalty only through customer satisfaction. The relationship be-tween perceived value and customer satisfac-tion is insignifi cant, meaning that we cannot confi rm any mediation impacts. The high qual-ity of retail banking services is therefore not only important in order to create customer sat-isfaction, but also in order to achieve custom-er’s loyalty. An indirect impact of satisfaction on perceived service quality is even stronger than its direct impact.
The results of this research are in accordance with previous results of authors who suggested that higher levels of perceived value of organiza-tion’s off erings lead to greater levels of customer satisfaction and loyalty (e.g. Ulaga, 2001; Cronin et al., 2000; Wang et al., 2004; Lin, Sher & Shih, 2005; Gallarza & Saura 2006). However, previous studies did not highlight or empirically test the
importance of perceived value as a mediator in price-satisfaction and price-satisfaction-loyalty relationships. The results of our study confi rm that these indirect impacts are strong and pos-itive. Therefore, it is obvious that managers in retail banks should evaluate and enhance cus-tomers’ perceptions of value associated with their retail banking services.
For companies, it is of prime importance to focus their activities on the benefi t side of per-ceived value. More precisely, companies should refi ne their off erings by increasing the benefi ts instead of lowering their prices. This is especially the case for companies operating in service in-dustries, such as retail banking, where the core off ering is usually intangible. In this context, managers’ decisions regarding their activities with customers should be holistic and system-atic, taking into account both direct and indirect eff ects among them.
However, in assessing the implications of this study, the research approach has a few inher-ent limitations. Because its results are directly relevant only to customers of retail banking services and may be of interest to marketing managers in the retail banking service sector, generalizations of the fi ndings beyond the im-mediate population observed should be made with caution. Also, the model of perceived val-ue could be further expanded to account for more indicators of perceived value (e.g. cul-ture, market orientation), as well as more con-sequences of perceived value (e.g. consumers’ trust), since consumers in emerging economies are expected to have less experience with re-tail banks than consumers from in developed economies.
As we found out, it can be assumed that the price paid for a service by a customer in retail banking is more important than the quality of service delivery itself. This prediction calls for further investigation in the future. Also, any fu-ture models should include the measurement of customers’ disconfi rmation in order to obtain more complete information regarding the val-ue-quality-satisfaction interrelationships.
V o l. 28, No . 2, 2016, pp . 191-212
References
1. Ahmed, A. M. (2002). Virtual integrated performance measurement. International Journal of Qual-ity & ReliabilQual-ity Management, 19(4), 414-441.
2. Al-Marri, K., Moneim, A., Ahmed, M. B., & Zairi, M. (2007). Excellence in service: an empirical study of the UAE banking sector. International Journal of Quality & Reliability Management, 24(2), 164-176. 3. Angur, M. G., Nataraajan, R., & Jahera, J. S. (1999). Service quality in the banking industry: an
as-sessment in a developing economy. International Journal of Bank marketing, 17(3), 116-123. 4. Athanassopoulos, A. D., Gounaris, S., & Stathakopoulos, V. (2001). Behavioral responses to
cus-tomer satisfaction: an empirical study. European Journal of Marketing, 35(5/6), 687-707.
5. Bahia, K., & Nantel, J. (2000). A reliable and valid measurement scale for the perceived service quality of banks. International Journal of Bank Marketing, 18(2), 84-91.
6. Beerli, A., Martin, J. D., & Quintana, M. (2004). A model of customer loyalty in the retail banking market. European Journal of Marketing, 38(1/2), 253-275.
7. Bick, G., Brown, A. B., & Abratt, R. (2004). Customer perceptions of the value delivered by retail banks in South Africa. International Journal of Bank Marketing, 22(5), 300-318.
8. Bollen, K. A. (1989). Structural Equations with Latent Variables. New York, NY: John Wiley & Sons. 9. Bolton, R. N., & Drew, J. H. (1991). A multistage model of customers’ assessments of service
qual-ity and value. Journal of Consumer Research, 17(4), 375-384.
10. Brady, K. M., & Cronin Jr., J. J. (2001). Some new thoughts on conceptualizing perceived service quality: A hierarchical approach. Journal of Marketing, 65(3), 34-49.
11. Çalik, N., & Balta, N. F. (2006). Consumer satisfaction and loyalty derived from the perceived qual-ity of individual banking services. A fi eld study in Eşkisehir in Turkey. Journal of Financial Services Marketing, 10(4), 135-149.
12. Carrillat, F. A., Jaramillo, F., & Mulki, J. P. (2007). The validity of the SERVQUAL and SERVPERF scales: A meta-analytic view of 17 years of research across fi ve countries. International Journal of Service Industry Management, 18(5), 472-490.
13. Caruana, A. (2002). Service loyalty – The eff ects of service quality and the mediating role of cus-tomer satisfaction. European Journal of Marketing, 36(7/8), 811-828.
14. Caruana, A., & Ewing, M. T. (2011). How corporate reputation, quality, and value infl uence online loyalty. Journal of Business Research, 63(9/19), 1103-1110.
15. Caruana, A., Money, A. H., & Berthon, P. R. (2000). Service Quality and Satisfaction – the moderat-ing role of value. European Journal of Marketing, 34(11/12), 1338-1352.
16. Cengiz, E., Ayyildiz, H., & Bünyamin, E. (2007). Eff ects of image and advertising effi ciency on cus-tomer loyalty and antecedents of loyalty: Turkish banks sample. Banks and Bank Systems, 2(1), 56-80. 17. Chaudhuri, A., & Holbrook, M. B. (2001). The chain of eff ects from brand trust and brand aff ect to
brand performance: the role of brand loyalty. Journal of Marketing, 65(2), 81-93.
18. Chen, T. Y., & Chang, H. S. (2005). Reducing consumers’ perceived risk through banking service quality cues in Taiwan. Journal of Business and Psychology, 19(4), 521-539.
19. Chen, T. Y., Chang, P. L., & Chang, H. S. (2005). Price, brand cues, and banking customer value.
International Journal of Bank Marketing, 23(2), 273-291.
20. Choudhury, K. (2007). Service Quality Dimensionality: A Study of the Indian Banking Sector. Jour-nal of Asia – Pacifi c Business, 8(4), 21-38.
21. Chu, R. (2002). Stated-importance versus derived-importance customer satisfaction measure-ment. Journal of Services Marketing, 16(2), 285-301.
22. Cronin, J. J., & Taylor, S. A. (1992). Measuring service quality: a re-examination and extension.
V
o
l. 28, No
. 2, 2016, pp
. 191-212
23. Cronin, J. J., Brady, M. K., & Hult, G. T. (2000). Assessing the eff ects of quality, value, and customer satisfaction on consumer behavioural intentions in service environments. Journal of Retailing, 76(2), 193-218.
24. Cronin, J. J., Brady, M. K., Brand, R. R., Hightower Jr., R., & Shemwell, D. J. (1997). A cross-sectional test of the eff ect and conceptualization of service value. Journal of Services Marketing, 11(6), 375-392. 25. Cunningham, L. F., Gerlach, J., & Harper, M. D. (2005). Perceived risk and e-banking services: An
anal-ysis from the perspective of the consumer. Journal of Financial Services Marketing, 10(2), 165-178. 26. Drew, J. H., & Bolton, R. N. (1991). The structure of consumer satisfaction: eff ects of survey
mea-surement. Journal of Consumer Satisfaction, Dissatisfaction and Complaining Behaviour, 4, 101-108. 27. Eggert, A., & Ulaga, W. (2002). Customer perceived value: a substitute for satisfaction in business
markets?. Journal of Business & Industrial Marketing, 17(2/3), 107-118.
28. Fandos Roig, J. C., Sanchez Garcia, J., Moliner, M. A., & Monzonis, J. L. (2006). Customer perceived value in banking services. International Journal of Bank Marketing, 24(5), 266-283.
29. Feldin, A., Košak, M., Prašnikar, J., Rašković, M., & Žabkar, V. (2009). Strategic Considerations in Banking Ownership: The Case of Slovenian Banking Market. Transformations in Business & Eco-nomics, 8(3), 36-56.
30. Fornell, C., & Larcker, D. F. (1981). Evaluating structural equation models with unobservable vari-ables and measurement errors. Journal of Marketing Research, 18(1), 39-50.
31. Gallarza, M. G., & Saura, I. G. (2006). Value dimensions, perceived value, satisfaction and loyalty: an investigation of university students’ travel behaviour. Tourism Management, 27(3), 437-452. 32. Gallarza, M. G., Saura, I. G., & Moreno, F. A. (2013). The quality-value-satisfaction-loyalty chain:
relationships and impacts. Tourism Review, 68(1), 3-20.
33. Gardener, E., Howcroft, B., & Williams, J. (1999). The new retail banking revolution. The Service Industries Journal, 19(2), 83-101.
34. Gerrard, P., & Cunningham, J. B. (2003). The diff usion of Internet banking among Singapore con-sumers. The International Journal of Bank Marketing, 21(1), 16-28.
35. Giese, J. L., & Cote, J. A. (2000). Defi ning customer satisfaction. Academy of Marketing Science Review, 1, 1-24.
36. Guest, L. (1944). A study of brand loyalty. Journal of Applied Psychology, 28(1), 16-27.
37. Hooper, D., Coughlan, J., & Mullen, M. (2008). Structural Equation Modelling: Guidelines for De-termining Model Fit. Electronic Journal of Business Research Methods,6(1), 53-60.
38. Jamal, A., & Naser, K. (2002). Customer satisfaction and retail banking: an assessment of some of the key antecedents of customer satisfaction in retail banking. International Journal of Bank Marketing,20(4), 146-160.
39. Jones, T. O., & Sasser, W. E. (1995). Why satisfi ed customers defect. Harvard Business Review, 73(6), 88-91.
40. Kaura, V., Durga Prasad, C. S., & Sharma, S. (2015). Service quality, service convenience, price and fairness, customer loyalty, and the mediating role of customer satisfaction. International Journal of Bank Marketing, 33(4), 404-422.
41. Kolar, T. (2006). Benchmarking market orientation of banks in transitional markets: Exploring a modifi ed approach. International Journal of Bank Marketing, 24(2), 76-97.
42. Ladhari, R., Ladhari, I., & Morales, M. (2011). Bank service quality: comparing Canadian and Tuni-sian customer perceptions. International Journal of Bank Marketing, 29(3), 224-246.
43. Lee, M. C., & Hwan, I. S. (2005). Relationships among Service Quality, Customer Satisfaction and Profi tability in the Taiwanese Banking Industry. International Journal of Management, 22(4), 635-648. 44. Leverin, A., & Liljander, V. (2006). Does relationship marketing improve customer relationship
V
o
l. 28, No
. 2, 2016, pp
. 191-212
45. Lewis, B. R., & Soureli, M. (2006). The antecedents of consumer loyalty in retail banking. Journal of Consumer Behaviour, 5(1), 15-31.
46. Lin, C. H., Sher, P. J., & Shih, H. Y. (2005). Past progress and future directions in conceptualizing customer perceived value. International Journal of Service Industry Management, 16(3/4), 318-337. 47. Lovelock, C. H., & Wirtz, J. (2011). Marketing services. New Jersey, NJ: Prentice Hall.
48. McDougall, G. H. G., & Levesque, T. (2000). Customer satisfaction with services: putting perceived value into the equation. Journal of Services Marketing, 14(4), 392-410.
49. Mittal, S., & Gera, R. (2012). Relationship between service quality dimensions and behavioural intentions: an SEM study of public sector retail banking customers in India. Journal of Services Research, 12(2), 147-171.
50. Molina, A., Martin-Consuegra, D., & Esteban, A. (2007). Relational benefi ts and customer satisfac-tion in retail banking. International Journal of Bank Marketing, 25(4), 253-271.
51. Monroe, K. B. (1990). Pricing: making profi table decisions. New York, NY: McGraw-Hill.
52. Nyer, P. U. (2000). An investigation into whether complaining can cause increased consumer satisfaction. Journal of Consumer Marketing, 17(1), 9-19.
53. Oliver, R. L. (1997). Satisfaction: A Behavioral Perspective on the Consumer. New York, NY: Mc-Graw-Hill.
54. Oliver, R. L. (1999). Whence customer loyalty. Journal of Marketing, 63, 33-44.
55. Padula, G., & Busacca, B. (2005). The asymmetric impact of price-attribute performance on over-all price evaluation. International Journal of Service Industry Management, 16(1), 28-54.
56. Parasuraman, A. (1997). Refl ection on Gaining Competitive Advantage through Customer Value.
Journal of the Academy of Marketing Science, 25(2), 154-161.
57. Parasuraman, A., & Grewal, D. (2000). The impact of technology on the quality-value-loyalty chain: A research agenda. Journal of Academy of Marketing Science, 28(1), 168-174.
58. Parasuraman, A., Berry, L. L., & Zeithaml, L. L. (1993). More on Improving Service Quality Measure-ment. Journal of Retailing, 69(1), 140-148.
59. Parasuraman, A., Zeithaml, V. A., & Berry, L. L. (1985). A conceptual model of service quality and its implications for future research. Journal of Marketing, 49(4), 41-50.
60. Petrick, J. F. (2002). Development of a Multi-Dimensional Scale for Measuring the Perceived Value of a Service. Journal of Leisure Research, 34(2), 119-134.
61. Petrick, J. F. (2004). The roles of quality, value, and satisfaction in predicting cruise passengers’ behavioral intentions. Journal of Travel Research, 42(4), 397-407.
62. Pisnik, A., Snoj, B., & Žabkar, V. (2012). Antecedents and outcomes of perceived service value: evidence from Slovenia. E+M Ekonomie a Management [E+M Economics & Management], 15(1), 105-115. 63. Podsakoff , P. M., & Organ, D. W. (1986). Self-reports in organizational research: Problems and
pros-pects. Journal of Management, 12(2), 531-544.
64. Pont, M., & McQuilken, L. (2005). An empirical investigation of customer satisfaction and loyalty across two divergent bank segments. Journal of Services Marketing, 9(4), 344-359.
65. Rowley, J. (1998). Quality measurement in the public sector: some perspectives from the service quality literature. Total Quality Management, 9(2/3), 321-335.
66. Rowley, J. (2005). The four Cs of customer loyalty. Marketing Intelligence & Planning, 23(6), 574-581. 67. Ryu, K., & Han, H. (2010). Infl uence of the quality of food, service, and physical environment on
customer satisfaction and behavioural intention in quick-casual restaurants: moderating role of perceived price. Journal of Hospitality & Tourism Research, 34(3), 310-329.
68. Ryu, K., Han, H., & Kim, T. H. (2008). The relationship among overall quick-casual restaurant image, perceived value, customer satisfaction and behavioural intentions. International Journal of Hospi-tality Management, 27(3), 459-469.
V
o
l. 28, No
. 2, 2016, pp
. 191-212
69. Sanchez, J., Callarisa, L., Rodriguez, M. R., & Moliner, A. M. (2006). Perceived value of the purchase of a tourism product. Tourism Management, 27(3), 394-409.
70. Sanchez-Fernandez, R., & Iniesta-Bonillo, M. A. (2007). The concept of perceived value: a system-atic review of the research. Marketing Theory, 7(4), 427-451.
71. Shamdasani, P., Mukherjeeb, A., & Malholtra, N. (2008). Antecedents and consequences of ser-vice quality in consumer evaluation of self-serser-vice internet technologies. The Service Industries Journal, 28(1), 117-138.
72. Sureshchandar, G. S., Rajendran, C., & Anantharaman, R. N. (2002). Determinants of customer-per-ceived service quality: a confi rmation factor analysis approach. Journal of Services Marketing, 16(1), 9-34.
73. Sweeney, J., Soutar, G., & Johnson, L. (1999). The role of perceived risk in the quality-value rela-tionship: a study in a retail environment. Journal of Retailing, 75(1), 77-105.
74. Teas, R. K., & Agarwal, S. (2000). The eff ects of extrinsic product cues on consumers’ perceptions of quality, sacrifi ce and value. Journal of the Academy of Marketing Science, 28(2), 278-290. 75. Thiele, S., & Mackay, M. (2001). Assessing the performance of brand loyalty measures. Journal of
Services Marketing, 15(7), 529-546.
76. Tse, D. K., & Wilton, P. C. (1988). Models of consumer satisfaction formation: an extensive. Journal of Marketing Research, 25(2), 204-212.
77. Ulaga, W., & Chacour, S. (2001). Measuring Customer-Perceived Value in Business Markets. Indus-trial Marketing Management, 30(6), 525-540.
78. Ulaga, W. (2001). Customer value in business markets. Industrial Marketing Management, 30(4), 315-319. 79. Vargo, S. L., & Lusch, R. F. (2008). Service-dominant logic: continuing the evolution. Journal of the
Academy of Marketing Science, 36(1), 1-10.
80. Wang, C. (2010). Service Quality, Perceived Value, Corporate Image, and Customer Loyalty in the Context of Varying Levels of Switching Costs. Psychology & Marketing, 27(3), 252-262.
81. Wang, Y., Lo, H. P., & Yang, Y. (2004). An integrated framework for service quality, customer value, satisfaction: Evidence from China’s telecommunication industry. Information systems frontiers, 6(4), 325-340.
82. Wang, Y., Lo, H. P., Chi, R., & Yang, Y. (2004). An integrated framework for customer value and customer-relationship-management performance: a customer-based perspective from China.
Managing Service Quality, 14(2/3), 169-182.
83. Woodall, T. (2003). Conceptualising Value for the customer: A structural, attributional and dispo-sitional perspective. Academy Of Marketing Science Review, 12, 1-42.
84. Woodruff , R. B., & Fisher Gardial, S. (1996). Know your customer: New approaches to understanding customer value and satisfaction. Oxford: Blackwell Business.
85. Woodruff , R. B. (1997). Customer Value: The next Source for Competitive Advantage. Journal of the Academy of Marketing Science, 25(2), 139-153.
86. Yang, Z., & Peterson, R. T. (2004). Customer perceived value, satisfaction, and loyalty: The role of switching costs. Psychology & Marketing, 21(10), 799-822.
87. Yavas, U., Benkenstein, M., & Stuhldreider, U. (2004). Relationships between service quality and behavioral outcomes: A study of private bank customers in Germany. International Journal of Bank Marketing, 22(2), 144-157.
88. Zeithaml, V. A. (1988). Consumer perceptions of price, quality and value: A means-end model and synthesis of evidence. Journal of Marketing, 52(3), 2-22.
89. Zeithaml, V. A. (2000). Service quality, profi tability, and the economic worth of customers: what we know and what we need to learn. Journal of the Academy of Marketing Science, 28(1), 67-85. 90. Žižek, P., & Žižek, U. (2015). Digitalno bančništvo v Sloveniji doživlja razmah (Digital banking is
V o l. 28, No . 2, 2016, pp . 191-212
Appendix
TABLE A1: The main characteristics of the sample
Age Frequency % 18 - 25 years 101 14.4 26 - 35 years 111 15.9 36 - 45 years 124 17.7 46 - 55 years 140 20.0 56 - 65 years 96 13.7 66 - 75 years 83 11.9
76 years and older 45 6.4
Total 700 100.0 Gender Male 336 48.0 Female 364 52.0 Total 700 100.0 Education
Primary school or lower 178 25.4
Vocational school 178 25.4
Secondary school 227 32.4
High school or University 115 16.4
Doesn’t want to tell 2 0.3
Total 700 100.0
Number of family members
1 91 13.0 2 196 28.0 3 167 23.9 4 188 26.9 5 40 5.6 6 17 2.4 Total 700 100.0
The frequency of banking services used
Retail bank branches (%) ATM (%) Web (%) Telephone banking (%) Mobile banking (%) Every day 0.4 1.6 2.0 0 0
Few times a week 0.9 30.7 4.3 0.2 0
Once a week 4.4 28.2 4.7 1.6 0.2
Once to three times a month 42.2 12.3 7.2 2.2 1.3
Less than once a month 49.7 3.0 1.1 1.5 0.1
Never 2.4 24.2 80.7 94.5 98.3
Total 100.0 100.0 100.0 100.0 100.0
V
o
l. 28, No
. 2, 2016, pp
. 191-212
TABLE A2: Summary statistics for the one-factor and multi-factor models for perceived quality and per-ceived price
Perceived quality* Perceived price**
One-factor model χ2/df = 266.61 / 44 RMSEA = 0.099 NFI = 0.92 CFI = 0.93 SRMR = 0.18 GFI = 0.83 χ2/df = 80.10 / 2 RMSEA = 0.237 NFI = 0.84 CFI = 0.84 SRMR = 0.15 GFI = 0.92 Multi-factor model χ2/df = 125.5 / 41 RMSEA = 0.094 NFI = 0.97 CFI = 0.97 SRMR = 0.03 GFI = 0.97 χ2/df = 1.98 / 1 (P=0.16) RMSEA = 0.037 NFI = 0.99 CFI = 0.99 SRMR = 0.01 GFI = 0.99
* Multi-factor model: core service, safety and confi dence, as well as physical evidence ** Multi-factor model: monetary costs, non-monetary costs
V
o
l. 28, No
. 2, 2016, pp
. 191-212
TABLE A3: Items, standardized loadings, construct reliabilities and average variance extracted for per-ceived quality
Dimension Item Standar.
loadings Composite reliability (CR) Average variance extracted (AVE) Core service
SQ1_This bank off ers me a complete range of products.
0.800
0.87 0.69
SQ3_This bank is innovative. 0.795
SQ5_This bank matches my specifi c
needs. 0.888
Safety and confi dence
SQ24_The employees of this bank are well-educated and professional.
0.610
0.84 0.57
SQ27_My money and savings are safe
in this bank. 0.829
SQ28_Using services outside bank facilities (ATM, telephone banking, e-banking) is safe.
0.684 SQ29_Recommedations of employees
of this bank are trustworthy.
0.864
Physical evidence
SQ6_Employees of this bank are neat in
appearance. 0.873
0.88 0.65
Sq7_This bank has up-to-date facilities
and equipment. 0.822
SQ8_The outdoor facilities of my bank
are visually appealing. 0.755
SQ9_Informative materials (website, advertisements, brochures, etc.) are visually appealing.
0.776
V
o
l. 28, No
. 2, 2016, pp
. 191-212
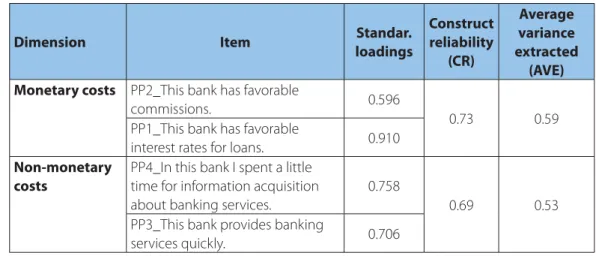
TABLE A4: Items, standardized loadings, construct reliabilities and average variance extracted for per-ceived price
Dimension Item Standar.
loadings Construct reliability (CR) Average variance extracted (AVE) Monetary costs PP2_This bank has favorable
commissions. 0.596
0.73 0.59
PP1_This bank has favorable
interest rates for loans. 0.910
Non-monetary costs
PP4_In this bank I spent a little time for information acquisition about banking services.
0.758
0.69 0.53
PP3_This bank provides banking
services quickly. 0.706
Source: Research results
TABLE A5: Correlations between researched constructs
Perceived price Perceived value Perceived quality Customer satisfaction Customer loyalty Perceived price 1 Perceived value 0.743 1 Perceived quality 0.613 0.627 1 Customer satisfaction 0.709 0.824 0.745 1 Customer loyalty 0.802 0.728 0.698 0.825 1