IMPACT OF A FISH FARM ON PHYSICAL AND
CHEMICAL PROPERTIES OF SEDIMENT AND
WATER COLUMN IN THE MIDDLE ADRIATIC SEA
Slavica Matijević, Grozdan Kušpilić and Ante Barić
Institute of Oceanography and Fisheries, PO Box 500, Šet. I. Meštrovića 63, 21000 Split, Croatia
Presented at the 13th International Symposium on Environmental Pollution and its Impact
on Life in the Mediterranean Region (MESAEP), Thessaloniki, Greece, 08 – 12 Oct. 2005
SUMMARY
This paper presents monitoring results of the impacts of a tuna breeding farm on physical and chemical parame-ters in sediment and water column. The results showed per-manently more negative sediment redox-potential at the station under the cage than at the referential station, as well as higher organic carbon and total nitrogen sediment con-tent. The average sediment total phosphorus concentration (TP) in surface sediment for the station under the cage (G1) was 24.1±7.9 µmol g-1 d.w., which is almost twofold higher than at the station 200 meters far from the cage (G2) and the referential station (REF) distanced 500 meters. These concentration values were similar to those recorded for highly eutrophicated bays in the Middle Adriatic area. SEDEX analysis showed an increased “fish debris phos-phorus” concentration at the station under the cage (31% of TP concentration) in relation to G2 and REF station (20% and 12% of TP). This increase is directly influenced by fish farming activities (fish bones and fish tooth remains, origi-nated from uneaten fish food settled at the seabed).
The bottom layer of the water column showed occa-sionally an enhancement of nutrient concentrations at the station under the cage in relation to REF station (ortho-phosphate: 1.423 to 0.028 mmol m-3, organic phosphorus: 0.577 to 0.146 mmol m-3 and ammonia: 2.41 to0.71 mmol m-3, respectively).
KEY WORDS:
Adriatic, tuna farming, sediment, water column, redox potential, phosphorus, SEDEX analysis, nutrient concentration.
INTRODUCTION
During the last ten years an intensive tuna breeding has been developed along the central Croatian coast. There are twelve tuna breeding farms in this part of the Adriatic at the moment, which is the highest number at the Medi-terranean nowadays, and their present yearly production rate exceed 4500 tones [1].
Due to inputs of excretory metabolic products and un-eaten food which are settling on the seabed beneath the cages, fish farms represent an important source of organic matter. The environmental effects of fish farming have been reported in numerous publications like specific sediment geochemistry such as negative redox-potential values [2-4], organic carbon accumulation [5, 6], accumulation of phosphorus and nitrogen compounds, [7, 8] and conse-quently changed or reduced benthic communities [9-12].
Previous investigations about fish farming influence in the Mediterranean area referred to its eastern [4, 12-15] and western areas [9, 16, 17] with a few studies in the northern part of the Adriatic Sea [10, 11]. There is a lack of information from the central Adriatic coastal area [18].
Ad riatic
S ea IT
ALY Ad
riatic S
ea IT
ALY
GRŠKA BAY GRŠKA BAY
43°17,35’ N 16°28,97’ W 43º17,49’ N
16º28,74’ W
43º 16,70‘ N 16º 28,69‘ W
43°17,35’ N 16°28,97’ W 43º17,49’ N
16º28,74’ W 43°17,35’ N 16°28,97’ W 43º17,49’ N
16º28,74’ W
43º 16,70‘ N 16º 28,69‘ W MATERIALS AND METHODS
The investigated tuna farm is located in the semi-enclosed bay Grška, island of Brač, middle Adriatic. This tuna farm was established in 2001 and has an annual pro-duction of about 450 tones with average breeding cycles of 20 months. Measurements and samplings were performed in June 2003, April 2004, and January 2005 at two stations inside the breeding area: G1 under the cage, G2 station 200 meters distanced away from G1 and referential sta-tion REF 500 meters distanced away from the cage (Fig-ure 1). Water column salinity values for the sampling area were in a very small range through investigated periods (38.29 to 38.62), which indicate the absence of freshwater inputs. Temperature ranged from 16.3-24.3ºC in the sur-face layer, and from 13.3 to 15.9 ºC in the bottom layer of the water column. Vertical profiles of salinity and tempera-ture were measured by means of SEABIRD-25 CTD.
FIGURE 1 - Farm location and sampling-stations (Grška Bay, island of Brač).
Sediment samples were collected by SCUBA-divers using plastic tubes which were inserted into the sediment to preserve an undisturbed core. Plastic rubber stoppers were used to close the top and the bottom of the each sam-ple. Redox-potential was measured in sediment core „in situ” by vertical penetration of Pt electrode connected to voltmeter Metrohm E-605 with Ag/AgCl reference
elec-trode in 3M KCl electrolyte. Calibration was performed in the quinhidrone buffer solutions (pH 4 and pH 7) prepared according to Metrohm, Ag Herissau, Switzerland.
For measurements of phosphorus sediment concentra-tion, each sample was divided into slices (1 cm thick), fro-zen and freeze dried until the laboratory analysis. Sedi-ment phosphorus concentrations were measured according to modified SEDEX methods [19-21]. Determined phos-phorus species were: phosphos-phorus in biogenic apatite or ”fish debris” P-FD, authigenic apatite phosphorus P-AUT, detri-tal apatite phosphorus P-DET, phosphorus adsorbed on iron-oxyhidroxides P-FE, and organic phosphorus P-ORG. Standard reference materials for phosphorus concentration determination were used (PACS-2 from Canadian Institute for National Measurement Standards NRC-CNRC, and BCR-684 from European Commission Community Bureau of Reference).
Sediment organic carbon and total nitrogen contents were determined using a CHNS-O Carlo Erba analyzer, granulometric composition was determined according to Folk [22] and organic matter content was determined gra-vimetrically according to Vdović et al. [23].
Water column oxygen saturation was determined ac-cording to Grasshoff [24]. Dissolved inorganic nutrients concentrations (nitrates, nitrites, ammonia, phosphates and silicates) and total nitrogen and phosphorus concen-trations were determined colorimetrically on an AutoAna-lyzer-3 according to Grasshoff [24].
RESULTS AND DISCUSSION
Sediment collected under the tuna cage (G1 - gravelly sand) and 200 meters from the cage (G2 - gravelly muddy sand) was characterized by higher portion of coarse-grained particles. Sediment from the REF station (slightly gravelly sandy mud) had higher portion of fine-sized particles (Ta-ble 1). Organic matter content in sediment of all collected samples was in accordance with granulometric composi-tion since organic matter has a higher affinity for smaller particles in sediments [25, 26] (Table 1).
Sediment redox-potential at the investigated stations was between -150 mV and +174 mV (at G1 and G2, respec-tively) (Figure 2).
TABLE 1 - Station depth, sediment type (according to Folk [22]), organic matter, organic carbon and total nitrogen content at investigated stations.
Station Depth
(m) Sediment type Organic matter (%)
C-ORG (%)
N-TOT (%)
G1 45 gravelly sand 2.2 0.71-10.13 0.19-0.95
G2 48 gravelly muddy sand 2.1 0.89-1.51 0.07-0.33
-150 -100 -50 0 50 100 150 200 FIGURE 2 - Sediment redox-potential at the stations G1, G2 and REF station during the investigated period.
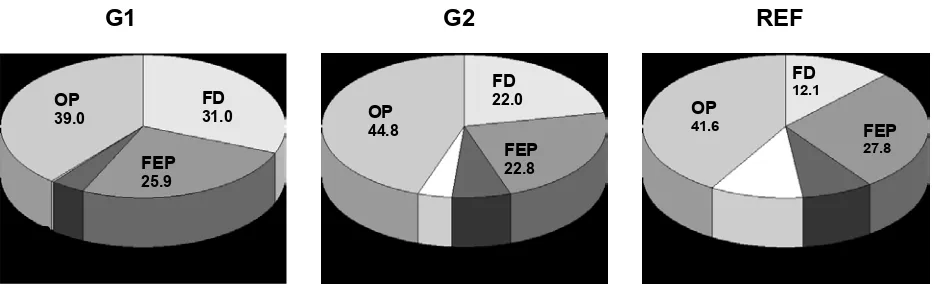
FIGURE 3 - Portion of sediment phosphorus species in total sediment phosphorus (fish debris FD-P, phosphorus adsorbed on iron oxy-hidroxides P-FE, detrital apatite phosphorus P-DET, authigenic apatite phosphorus, and organic phosphorus) at the investigated stations.
Redox-potential was permanently more negative at the station G1 under the cage than at the REF station, which in-dicates a higher input of organic matter into the sediment under the cage and presence of SO42- ion as main electron
acceptor for the oxido-reduction processes [6]. According to Collman and Holland [27] sediment redox transition from oxic to suboxic conditions occurs between 150 and 300 mV, while transition from suboxic to anoxic between 0 and -150 mV. Results presented in this paper are in agree- ment with previous investigations of fish farming influ-ence on the sediment redox-potential which also showed more negative values at the stations under the cages than at the referential sites; for salmon culture according to Hargrave et al. [2],and Brown et al. [28], for the sea bass and sea bream cages in Japan [3], and in eastern Mediter-ranean [13].
Average sediment total phosphorus concentration (TP) in 0-2 cm sediment layer for G1 station was (24.11±7.96
µmol g-1 d.w.), which is almost twofold higher than the average values recorded for G2 and REF station (12.74±2.66 and 12.67±2.86 µmol g-1 d.w., respectively). TP concentra-tion values at G1 staconcentra-tion were similar to those recorded for highly eutrophicated bays in the middle Adriatic area [29]. Mean values of sediment phosphorus species portion in TP determined by SEDEX methods are shown in Figure 3.
phospho-rus sediment species under the fish cages in Aquaba Bay, Israel [31] that showed 80-90% of TP as Ca-bound phos-phorus. However, SEDEX method used in that study [32] was not selective for distinction between biogenic and authigenic apatite phosphorus species. Fish debris phos-phorus FD-P decreased with the increasing distance from the cage (Figure 3). On the contrary, detrital phosphorus (D-AP), phosphorus originated from land plants and river-ine inputs [19] increases with distance from the cage. This phosphorus species is found prevailing in the middle Adri-atic areas with a riverine influence [30].
Sediment as important source of phosphorus was re-ported for trout farms in North Europe [7], and also for Cephalonia Bay in Greece [12] where, according to the author, benthic algal production is probably favored by periodic release of phosphate in reducing conditions in sediments. According to Sundbay et al. [33] flux of phos-phate is correlated with phosphorus associated on iron oxy-hydroxides, however, considering our results, phosphorus species responsible for the phosphate releasing under the cages could be a fish-debris phosphorus form as suggested from Schenau and De Lange [34].
Decreasing of the farm impact with increasing the distance from the cage have already been reported; for Greek seabass and sea bream farms the influence decreases 25 meters from the cage [4, 13], and for the same farms in Seto Inland Sea, Japan, farming influence is obvious at 165 meters from cages [3].
Sediment organic carbon and total nitrogen content values (Table 1) at G1 station were higher than the average values given for the middle Adriatic area (0.28-1.20 % for C-ORG, and 0.02-0.15% for N-TOT) [18]. Recorded val-ues for G1 station were enhanced in relation to the REF station 1.5 to 7 times for C-ORG, and 3 to 8 times for N-TOT. Enhancement of organic carbon and total nitrogen content [5, 6] is already reported for salmon cages in
Can-ada, and for seabass and sea bream cages in Greece and it was noted that values were 1,5 to 5 times higher under the cage than at control sites [13]. Sediment C-ORG and N-TOT analysis of seabass farm in Adriatic Sea, Slovenia [11] showed dispersion pattern of organic loadings with most affected areas under the cages. Vertical distribution of organic carbon and total nitrogen content indicate that organic matter is originated from the fish food and feces. Maximal sediment C-ORG and N-TOT contents (10.13 and 0.95%, respectively, with atomic C/N ratio of 12.5) reported in this paper are similar to contents recorded for fish feces in Slovenian seabass farm (15.04 and 1.34%, respectively with atomic ratio of 12.63) that could be an indication of the same origin of organic matter.
No negative changes of oxygen saturation were ob-served in the bottom layer of the water column under the cage in relation to REF station. Saturation varied between 90 and 97.3% which are usual values for bottom layer of undisturbed natural middle Adriatic waters [35] (Table 2).
Nitrate, ammonia and ortophosphate concentrations in the bottom layer at G1 station were higher than at the REF station during the summer season when water column strati-fication occurs (Table 2), but they were still in range of values usual for this area [35]. The only exception was orthophosphate concentration at G1 station noted in sum-mer 2003 (1.42 mmol m-3 which was up to seven times higher than concentration for eutrophicated areas of the middle Adriatic). Inorganic nitrogen concentrations in the bottom layer of water column for summer 2003 have also been higher than at the REF station with ammonia as the most abundant species.
Ortophosphate enhancement have also been reported by Pitta et al. [15], with concentrations in the farming area up to threefold than at the referential sites, while, Maldo-nado et al. [17], observed no abnormal concentrations in the water column under the cages. Ruiz et al. [36], explained
TABLE 2 - Oxygen saturation (%) and nutrient concentrations (mmol m-3) in
the bottom layer of the water column at sampling sites through the investigated periods.
2003
O2 NO3- NO2- NH4+ N-ORG PO43- P-ORG SiO4
4-G1 90.00 0.195 0.006 1.60 5.44 1.423 0.577 0.95
G2 92.68 0.156 0 0.45 2.87 0.043 0.070 0.37
REF 86.63 0.122 0.021 0.44 4.49 0.028 0.146 1.39
2004
NO3- NO2- NH4+ N-ORG PO43- P-ORG SiO4
4-G1 91.17 1.233 0.087 2.41 4.41 0.366 0.017 0.95
G2 91.06 0.150 0.100 1.64 0.132 0.245 0.69
REF 81.45 0.428 0.212 0.71 1.89 0.117 0.254 5.00
2005
O2 NO3- NO2- NH4+ N-ORG PO43- P-ORG SiO4
4-G1 97.33 0.250 0 0.06 2.68 0.047 0.231 2.54
G2 97.65 0.246 0.254 0.27 2.16 0.029 3.11
differences between nitrate and nitrite concentrations with seasonal pattern rather than fish farming influence. Ac-cording to Karakassis et al. [37], phosphate and nitrate con-centrations differ diurnally (increasing during the morn-ing, reaching maxima at noon, and dropped to very low levels thereafter). Ammonia as abundant inorganic nitrogen species in the water column of fish farms was described in many papers [8, 15, 36, 37], but with no influence on the primary production in water column [15]. Silicate concen-trations showed in table 2 indicate no influence of the fish farming activities on its concentration in the water column as reported from Maldonado et al. [17].
CONCLUSIONS
Monitoring results of physical and chemical parame-ters in sediment and water column for Croatian tuna farm showed some negative changes in relation to the natural state of the environment. Observed changes included: more negative redox-potential, higher organic carbon and total nitrogen sediment content and higher phosphorus sedi-ment concentrations.
Enhanced sediment phosphorus originated from “fish debris phosphorus” (biogenic apatite incorporated in fish bones and tooth) that falls on the seabed as uneaten fish food. Accumulation of “fish debris phosphorus” in sediment and subsequent dissolution could potentially have an effect on orthophosphate flux and consequently on the primary production of the water column.
REFERENCES
[1] FAO (2005) General Fisheries Commission for the Mediter-ranean: Report of the third meeting of the Ad Hoc GFCM ICCAT Working group on Sustainable Bluefin Tuna Farm-ing/Fattening practices in the Mediterranean.FAO Fisheries Reports R7792005 ISBN: 9251053405, 115 p.
[2] Hargrave, B.T., Duplisea, D.E., Pfeiffer, E. and Wildish, D. J. (1993) Seasonal changes in benthic fluxes of dissolved oxy-gen and ammonium associated with marine cultured Atlantic salmon. Mar. Ecol. Prog. Ser. 96: 149-157.
[3] Pawar, V., Matsuda, O., Yamamoto, T., Hashimoto, T. and Rajendran, N. (2001) Spatial and temporal variations of sediment quality in and around fish cage farms: A case study of aquaculture in the Seto Inland Sea, Japan. Fish. Sci. 67: 619-627.
[4] Karakassis, I., Tsapakis, M. and Hatziyanni, E. (1998) Sea-sonal variability in sediment profiles beneath fish farm cages in the Mediterranean. Mar. Ecol. Prog. Ser. 162: 243-252.
[5] Hall, P.O.J., Anderson, L.G., Holby, O., Kollberg, S. and Samuelsson, M.O. (1990) Chemical fluxes and mass balances in a marine fish cage far. I. Carbon. Mar. Ecol. Prog. Ser. 61: 61-73.
[6] Hargrave, B.T., Phillips, T.A., Doucette, L.I., White, M.J. Milligan, T.G., Wildish, D.J. and Cranston, R.E. (1997) As-sessing benthic impacts of organic enrichment from marine aquaculture. Wat. Air Soil Pollut. 99: 641-650.
[7] Holby, O. and Hall, P.O.J. (1991) Chemical fluxes and mass balances in marine fish cage farm. II Phosphorus. Mar. Ecol. Prog. Ser. 70: 263-272.
[8] Hall, P.O.J., Holby, O., Kollberg, S. and Samuelsson, M.O. (1992) Chemical fluxes and mass balances in marine fish cage farm. IV. Nitrogen. Mar. Ecol. Prog. Ser. 89: 81-91.
[9] Mazzola, A., Mirto, S. and Danovaro, R. (1999) Initial fish-farm impact on meiofaunal assemblages in coastal sediments of the western Mediterranean. Mar. Pollut. Bull. 38: 1126-1133.
[10] Kovač, N., Vrišer, B. and Črmelj, B. (2001) Impacts of net cage fish farm on sedimentary biogeochemical and meiofau-nal properties of the Gulf of Trieste. Anmeiofau-nales, Ser. hist. nat. 11: 65-74.
[11] Kovač, N., Cermelj, B., Vrišer, B. and Lojen, S. (2004) The influence of fish farming on coastal marine sediment in Slo-venia (2004) in UNEP/MAP Mariculture in the Mediterra-nean MAP Technical reports Series No. 140, Athens, 2004.
[12] Karakassis, I., Hatziyanni, E., Tsapakis, M. and Plaiti, W. (1999) Benthic recovery following cessation of fish farming: a series of successes and catastrophes. Mar. Ecol. Prog. Ser. 184: 205-218.
[13] Karakassis, I., Tsapakis, M., Hatziyanni, E., Papadopoulou, K.N. and Plaiti, W. (2000) Impact of cage farming of fish on the seabed in three Mediterranean coastal areas. ICES J. Mar Sci. 57: 1462-1471.
[14] Karakassis, I., Tsapakis, M., Smith, C.J. and Rumohr, H. (2002) Fish farming impacts in the Mediterranean studied through sediment profiling imagery. Mar. Ecol. Prog. Ser. 227: 125-133.
[15] Pitta, P., Karakassis, I., Tsapakis, M. and Živanovićc, S. (1999) Natural versus mariculture induced variability in nu-trients and plankton in the Eastern Mediterranean. Hydrobi-ologia 391: 181-194.
[16] Mirto, S., La Rossa, T., Gambi, C., Danovaro, R. and Maz-zola, A. (2002) Nematode community response to fish farm impact in the Western Mediterranean. Environ. Pollut. 116: 203-214.
[17] Maldonado, M., Carmona, M.C., Echeverria, Y. and Riesgo, A. (2005) The environmental impact of Mediterranean cage fish farms at semi exposed locations: does it need a re-assessment? Helgol. Mar. Res. 59: 121-135.
[18] Matijević, S., Kušpilić, G., Bogner, D. and Barić, A. (2004) Fish farming influence on physical and chemical properties of sediment and water column in the middle Adriatic, Rap-port du 37e Congress de la CIESM (0373-434X) 37: 222.
[20] Schenau, S.J. and De Lange, G.J. (2000) A novel chemical method to quantify fish debris in marine sediments. Limnol. Oceanogr. 45: 963-971.
[21] Anshutz, P., Zhong, S. and Sundby, B. (1998) Burial effi-ciency of phosphorus and the geochemistry of iron in conti-nental margin sediments. Limnol. Oceanogr. 43: 53-64.
[22] Folk, R.L. (1954) The distinction between grain size and mineral composition in sedimentary rock nomenclature, Journ. Geol. 62: 344-356.
[23] Vdović, N., Bišćan, J. and Juračić, M. (1991) Relationship between specific surface area and some chemical and physi-cal properties of particulates: study in the Northern Adriatic. Mar. Chem. 36: 317-328.
[24] Grasshoff, K. (1976) Methods of Seawater Analysis, Verlag Chemie, Weinheim, 307 p.
[25] Ujević, I., Odžak, N. and Barić, A. (2000) Trace metal accu-mulation in different grain size fractions of the sediments from a semienclosed bay heavily contaminated by urban and industrial wastewaters. Wat. Res. 34: 3055-3061.
[26] Bogner, D., Ujević, I. and Barić, A. (2005) Trace metals (Cd, Pb, Cu, Zn and Cr) distribution in sediment along east coast of the Adriatic Sea (Croatia). Fresen. Environ. Bull. 14: 50-58.
[27] Collman, A.S. and Holland, H.D. (2000) The global diagenetic flux of phosphorus from marine sediments to the oceans: Redox sensitivity and the control of atmospheric oxygen levels: Marine Authigenesis: From Global to Micro-bial, SEPM Special Publication No 66, p. 53-75.
[28] Brown, J.R., Gowen, R.J. and McLusky, D.M. (1987) The ef-fects of salmon farming on the benthos of a Scottish Sea. Journ Experiment. Mar Biol. Ecol. 109: 39-51.
[29] Barić, A., Kušpilić, G and Matijević, S. (2001) Nutrient (N, P, Si) fluxes between marine sediments and water column in coastal and open Adriatic. Hydrobiologia 475:151-159.
[30] Matijević, S. (2006) Distribution of chemical phosphorus species in the middle Adriatic sediment. PhD Thesis, Univer-sity of Zagreb, Faculty of Science, Zagreb, 123 p.
[31] Research Projects in the Gulf of Eilat /Aquaba, Reconnais-sance study on sedimentary phosphorus in the Northern Gulf of Eilat, P.I. Barak Herut and Ami Nishri, 2004, p. 26
[32] Hieltjes, A.H.M. and Lijklema, L. (1980) Fractionation of in-organic phosphates in calcerous sediments, Journal Environ-mental Quality, 9: 405-407.
[33] Sundby, B., Gobeil, C., Silverberg, N. and Mucci, A. (1992) The phosphorus cycle in coastal marine sediments. Limnol. Oceanogr. 37: 1129-1145.
[34] Schenau, S.J. and De Lange, G.J. (2001) Phosphorus regen-eration vs. burial in sediments of the Arabian Sea. Mar. Chem. 75: 201-217.
[35] Zore-Armanda, M., Bone, M., Dadić, V., Morović, M., Ratković, D., Stojanoski, L. and Vukadin, I. (1991). Hydro-graphic properties of the Adriatic Sea in the period from 1971 through 1983. Acta Adriatica, 32: 6-544.
[36] Ruiz, J.M., Perez, M. and Romero, J. (2001) Effects of fish farm loadings on seagrass (Posidonia oceanica) distribution,
growth and photosynthesis. Mar. Pollut. Bull. 42: 749-760.
[37] Karakassis, I., Tsapakis, M., Hatziyanni, E. and Pitta, P. (2001) Diel variation of nutrients and chlorophyll in sea bream and sea bass cages in the Mediterranean. Fresen. Envi-ron. Bull. 10: 278-283.
Received: February 07, 2006 Revised: April 18, 2006 Accepted: April 20, 2006
CORRESPONDING AUTHOR
Matijević Slavica
Institute of Oceanography and Fisheries PO Box 500
Šet. I. Meštrovića 63 21000 Split
Croatia
e-mail: [email protected]
![TABLE 1 - Station depth, sediment type (according to Folk [22]), organic matter, organic carbon and total nitrogen content at investigated stations](https://thumb-ap.123doks.com/thumbv2/123dok/2107556.1608578/2.595.51.293.328.536/station-sediment-according-organic-organic-nitrogen-investigated-stations.webp)