Effects of winter selective tree harvest on soil microclimate and surface CO
2
flux of a northern hardwood forest
Jennifer L. Stoffel
a,b,1,*, Stith T. Gower
a, Jodi A. Forrester
a, David J. Mladenoff
aaDepartment of Forest and Wildlife Ecology, University of Wisconsin-Madison, 1630 Linden Drive, 120 Russell Labs, Madison, WI 53706, United States
bDivision of Science and Mathematics, Upper Iowa University, 605 Washington Street, P.O. Box 1857, Fayette, IA 52142, United States
1. Introduction
Soil carbon accounts for approximately 60% of the terrestrial carbon (Landsberg and Gower, 1997) 34% of which occurs in forest soils (Post et al., 1982). Soil carbon is the long-term balance between detritus production and decomposition. Temperate forest soils generally accumulate 5.6 g C m2year1, which is second only to
the boreal forest (Schlesinger, 1997; Landsberg and Gower, 1997). Even small accumulation rates when summed over a biome can comprise an important carbon sink. Therefore, the storage of carbon in forests soils is an important area of research, especially as the atmospheric levels of CO2continue to rise (Houghton et al., 2001).
Soil surface CO2flux (Sflux) is the second largest carbon flux in
temperate forests (Raich and Schlesinger, 1992).Sfluxis the sum of
autotrophic root respiration and microbial respiration. The root contribution to totalSfluxranges from 30 to 50% for most terrestrial
ecosystems (Bond-Lamberty et al., 2004) suggesting that hetero-trophic respiration is the largest contributor. Microbial respiration is strongly influenced by soil temperature and moisture, while root respiration is influenced by root mass, soil temperature and canopy photosynthesis.
Minor changes in soil carbon turnover rates could have major implications on regional carbon dynamics given the size of the temperate forests and their importance as a source for wood fiber. Scientists have suggested that harvesting unmanaged or mature forests decreases soil and forest floor carbon content (Covington, 1981; Mattson and Smith, 1993; Brais et al., 1995; Seely et al., 2002; Yanai et al., 2003). The decreased carbon content in the forest floor and mineral soil may result in increased microbial respiration, leaching, and decreases in detritus inputs (i.e. fine roots and coarse woody debris) (Alban, 1982; Landsberg and Gower, 1997; Yanai et al., 2003). However, results from both a meta-analysis (Johnson and Cutis, 2001) and a case study (Martin et al., 2005) indicate that harvesting does not have a consistent effect on soil carbon.
A R T I C L E I N F O
Article history: Received 9 March 2009
Received in revised form 4 October 2009 Accepted 5 October 2009
Keywords: Soil surface CO2flux Selective tree harvest Northern hardwood forest Harvesting
Microclimate
A B S T R A C T
Soil surface CO2flux (Sflux) is the second largest terrestrial ecosystem carbon flux, and may be affected by
forest harvest. The effects of clearcutting onSfluxhave been studied, but little is known about the effect of
alternative harvesting methods such as selective tree harvest onSflux. We measuredSfluxbefore and after
(i) the creation of forest canopy gaps (simulating group tree selection harvests) and (ii) mechanized winter harvest but no tree removal (simulating ground disturbance associated with logging). The experiment was carried out in a sugar maple dominated forest in the Flambeau River State Forest, Wisconsin. Pre-treatment measurements of soil moisture, temperature and Sflux were measured
throughout the growing season of 2006. In January–February 2007, a harvester created the canopy gaps (200–380 m2). The mechanization treatment consisted of the harvester traveling through the plots for a
similar amount of time as the gap plots, but no trees were cut. Soil moisture and temperature andSflux
were measured throughout the growing season for 1 year prior to harvest and for 2 years after harvest. Soil moisture and temperature were significantly greater in the gap than mechanized and control treatments. InstantaneousSfluxwas positively correlated to soil moisture and soil temperature at 2 and
10 cm, but temperature at 10 cm was the single best predictor. AnnualSfluxwas not significantly
different among treatments prior to winter 2007 harvest, and was not significantly different among treatments after harvest. Annual (+1 std. err.) Sflux averaged 967 + 72, 1011 + 72, and
1012 + 72 g C m2year1in the control, mechanized and gap treatments, respectively, for the 2-year
post-treatment period. The results from this study suggest selective group tree harvest significantly increases soil moisture and temperature but does not significantly influenceSflux.
ß2009 Elsevier B.V. All rights reserved.
* Corresponding author at: Division of Science and Mathematics, Upper Iowa University, 605 Washington Street, P.O. Box 1857, Fayette, IA 52142, United States. Tel.: +1 563 425 5847; fax: +1 563 425 5332.
E-mail address:[email protected](J.L. Stoffel). 1Formerly: Jennifer L. Martin.
Contents lists available atScienceDirect
Forest Ecology and Management
j o u r n a l h o m e p a g e : w w w . e l s e v i e r . c o m / l o c a t e / f o r e c o
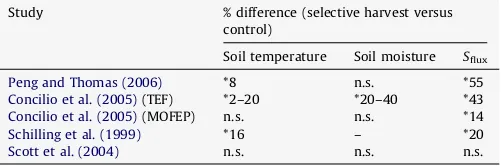
Most forest management studies have concentrated on the effects of clear-cut harvest on soil carbon dynamics and few have focused on alternative management practices, such as selective tree or group harvest on soil carbon dynamics (but seeSchilling et al., 1999; Scott et al., 2004; Concilio et al., 2005; Peng and Thomas, 2006) (Table 1). In particular, the effects of these less intensive silvicultural systems on Sflux are inconsistent and
unclear. Some studies have measured a significant change inSflux
following harvesting; although the direction of change varies among studies. Additionally, there is variation in the intensity and timing of forest harvesting among the studies.
A selective thinning in mixed-conifer stands in the Sierra Nevada Mountains and hardwoods of the Ozark Mountains resulted in significant increases in Sflux, soil moisture and soil
temperature although the magnitude of the response to thinning was greater in the mixed-conifer stand than the hardwood stand (Concilio et al., 2005).Schilling et al. (1999)reported thatSfluxwas
significantly greater in the selection harvest and clear-cut than control treatments only during the active growing season;Londo et al. (1999)reported similar results.
Finally, there are a few studies which found that smaller scale forest cuts significantly reduced the overallSflux.Peng and Thomas
(2006)comparedSfluxin the gaps and non-gap locations in
uneven-aged manuneven-aged northern hardwood forests in central Ontario and found that Sflux increased by 55% immediately after harvest,
declined to 20–40% below pre-harvest rates in 1–3 years, and gradually returned to pre-harvest rates by years 5–6.Tang et al. (2005)reportedSfluxwas 13% less at a given soil temperature and
moisture for thinned versus control ponderosa pine stands. The thinning treatment removed about 60% of the trees (30% of the total biomass and LAI) and the harvested trees and shrubs were mulched on the site. Therefore, the effect of selective harvest on Sfluxis not uniform.
Soil temperature (Witkamp, 1969; Singh and Gupta, 1977; Schlenter and Van Cleve, 1985; Kirschbaum, 1995; Winkler et al., 1996; Rustad and Fernandez, 1998; Qi et al., 2002) and soil moisture (Schlenter and Van Cleve, 1985; Singh and Gupta, 1977; Davidson et al., 1998) influenceSflux. Often incident photosynthetic
active radiation, soil surface temperature and moisture are greater in canopy openings or gaps, than beneath intact canopies (Minckler and Woerheide, 1965; Moore and Vankat, 1986; Gray et al., 2002). However, likeSflux, not all forest harvests or thinning
result in an increase in temperature or moisture within the created gaps (Table 1). Significant differences in soil microclimate were not evident between thinned and control areas in hardwood forests (Concilio et al., 2005) or in a shelterwood harvest (Scott et al., 2004) (Table 1). In a northern hardwood forest, Nauertz et al. (2004) reported significant changes in photosynthetic active radiation between harvested (even-aged and uneven-aged management) and control locations, but not soil temperature.
Harvesting creates gaps belowground as well that may reduce autotrophic root respiration, turnover, and exudates that could decreaseSflux (Edwards and Ross-Todd, 1983; Yin et al., 1989;
Strigel and Wickland, 1998; Schilling et al., 1999). Conversely, the sudden pulse of fine roots and mycorrhizae turnover from the harvested trees may stimulate decomposition (Peng and Thomas, 2006).
The objectives of this study were to quantify the effect of a simulated selection harvest in a northern hardwood forest on (1) the soil microclimate (temperature and moisture), (2) Sflux, (3)
determine if the size of the harvest influencesSflux, and (4) compare
the modeled annualSflux(soil and forest floor flux) budgets for the
northern hardwood forest treatments. We hypothesized that: (1) soil temperature and moisture would be significantly greater in the selective harvest gaps than control gaps, (2)Sfluxwould not differ
between gap size, and (3)Sfluxwould be greater in selective harvest
gaps than the control gaps, (4) mechanization treatments would not significantly increaseSflux.
2. Methods
2.1. Site description and experimental design
This study was conducted in the Flambeau River State Forest, (45837024.5100N, 9084707.7200W), Rusk County, in north-central Wisconsin, U.S.A. The study area is comparable to many of the forests in the Great Lakes State forest region and typifies maturing northern hardwood forests with one predominant age cohort (ca. 80 years) (J. Dyer, unpublished data). The forest was selected because it is reasonably representative of the age structure of many forests in northern Wisconsin, there was a sufficient area of relatively uniform forest to implement the large scale manipula-tions, and the Wisconsin Department of Natural Resources will host the experiment for 50 years.
The dominant soils in this region were silt loams (Glossudalfs) of the Magnor, Freeon, and Ossemer series overlying dense till (David Hvizdak, USDA, NRCS). Mean annual temperature for 2006– 2008 was 7.4, 6.1 and 4.48C, respectively. The annual precipitation range for 2006–2008 was from 558, 618, and 530 mm, respectively (J. Forrester, unpublished data).
Sugar maple (Acer saccharum (Marshall)) is the dominant overstory tree species throughout the research area while species of lesser dominance such as white and black ash (Fraxinus americanaL. andF. nigra), basswood (Tilia americanaL.), bitternut hickory (Carya cordiformis(Wagenh), and eastern hemlock (Tsuga canadensis) vary moderately within the plots (Table 2). The experimental design included three blocks to account for the natural heterogeneity of pre-treatment of plant species composi-tion throughout the research area. The presence of eastern hemlock and ash species described the most variation between plots. The presence of hemlock influences soil carbon and nitrogen dynamics (Campbell and Gower, 2000). Therefore the three blocks designated prior to treatment were: (1) maple-hemlock, (2) maple-ash, and (3) maple. The third block included plots where several other species at the site were more abundant, including bitternut hickory, American basswood, red and white elm (Ulmus rubra(Muhl.) andU. americana(L). Within each block treatments were randomly assigned to plots.
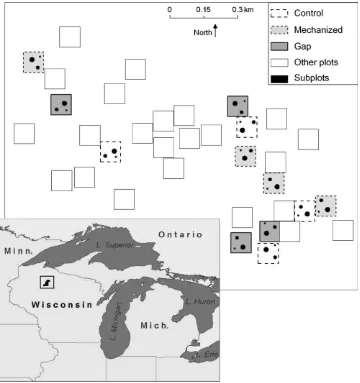
This study was a part of a larger experiment that included additional treatments (Fig. 1), but this study focused on only three of these treatments: group selection cuts referred to hereafter as ‘‘gaps’’, mechanized control, and control (no treatment). The experimental design was a split plot design with gap size (subplots) nested within three whole plot treatments. Each treatment consisted of five, 80 m80 m whole plots that were randomly assigned across treatments in the total study area (9.6 ha) and of those of the larger study (Fig. 1). Only four of the five subplots were used in this study because of logistical constraints associated with measuring soil surface CO2flux over a large area.
Table 1
A comparison ofSflux, soil temperature, and moisture data between selection harvests and control by percent; asterisks denote significant differences while n.s. denotes non-significant differences.
Study % difference (selective harvest versus
control)
Soil temperature Soil moisture Sflux
Peng and Thomas (2006) *8 n.s. *55
Concilio et al. (2005)(TEF) *2–20 *20–40 *43
Concilio et al. (2005)(MOFEP) n.s. n.s. *14
Schilling et al. (1999) *16 – *20
The four plots were chosen to include each of the subplot orientations. Plot orientation was not a significant pre- or post-treatment effect; therefore, this effect was not included in any statistical models. Within each whole plot, three ‘‘gap’’ subplots with 22, 16, and 8 m diameters were created. Only the 22 and 16 m gap subplots were used in this study because these sizes are more representative of selection cuts in the northern hardwood forest.
2.2. Treatment implementation
Treatments were implemented during January–February 2007. The soil was frozen and a snow pack (10–20 cm) was present when the treatments were initiated. Group selection cuts were made using a harvester (Ponsse Ergo, Ponsse Oyj, Vierema¨, Finland) operated by a certified master logger. Timber (including slash) was
Table 2
Structure and composition of trees>10 cm diameter at breast height of the study area in Flambeau River State Forest (N= 35, 80 m80 m whole plots).
Species Density (stem/ha) Basal area (m2/ha)
Mean Std. err. Mean Std. err.
Sugar mapleAcer saccharum 287.72 8.35 16.34 0.59
American basswoodTilia americana 51.43 4.59 4.62 0.4
AshFraxinusspp. 45.4 5.75 4.33 0.52
Bitternut hickoryCarya cordiformis 23.66 5.4 1.19 0.27
Eastern hophornbeamOstrya virginiana 18.04 4.98 0.25 0.07
Red oakQuercus rubra 4.91 1.14 0.66 0.17
Yellow birchBetula alleghaniensis 5.54 1.2 0.49 0.13
Red mapleAcer rubrum 7.01 3.35 0.36 0.16
CherryPrunusspp. 3.75 1.82 0.38 0.22
Eastern hemlockTsuga canadensis 2.50 0.64 0.29 0.08
Trembling aspenPopulus tremulodies 3.13 2.46 0.17 0.11
ElmUlmusspp. 2.37 0.57 0.07 0.02
ButternutJuglans cinerea 0.76 0.31 0.07 0.03
All species 456.38 13.34 29.25 0.49
removed from the experimental plots with a forwarder (Ponsse Buffalo, Ponsse Oyj, Vierema¨, Finland). The mechanization treat-ment consisted of the harvesters traveling within an experitreat-mental plot for a similar amount of time as spent in the gap plots, but no trees were harvested.
2.3. Meteorological monitoring
A meteorological station was established within one plot of each treatment prior to treatment (winter 2005). Within the gap, soil moisture and temperature were measured 5.5 m from the subplot center in the north and south directions. Soil temperature was measured continuously at two depths (1.6 and 7.5 cm) using thermocouple wire (type-T) (Fig. 2) Soil moisture was also measured at all of these locations to a depth of 3.2 cm and then an average over a depth of 20 cm using two ECH20-20 probes
(Decagon Inc., Pullman, WA, UA) (Fig. 2). Air temperature was recorded at a height of 1 m. All environmental data were recorded using Campbell Scientific CR 10X data loggers (Campbell Scientific, Logan, UT, USA) (Fig. 2). The continuous meteorological data was used only for modeling annualSflux.
2.4. Soil surface CO2flux (Sflux) measurements
Soil surface CO2flux (Sflux) was measured with a Li-Cor 6200
portable CO2infrared gas analyzer (IRGA) (Li-Cor Inc., Lincoln, NE)
equipped with a 15.2 cm (inside diameter) clear acrylic chamber. The chamber fit on PVC (polyvinyl chloride) collars (15.4 cm diameter6 cm tall). The collars were beveled at the bottom to minimize soil disturbance when they were placed in the soil. The
collars were placed along two north–south transects in the large and medium subplots. In the large subplot, the two transects were located 2.1 m on the east and west side of plot center and four collars were evenly spaced 4.1 m from each other along each transect for a total of eight collars. In the medium subplot, transects were located 2.0 m on the west and east side of plot center.Sfluxwas not measured for 3 weeks after the collars were
installed to avoid any disturbance artifact associated with installation (Vogel and Valentine, 2005).
The IRGA was calibrated by LiCor at least once a year and was calibrated daily prior to use. The IRGA was configured to automatically measure five times every 10 s at every collar location. This method provides accurate estimates of Sflux
compared to other approaches (Norman et al., 1997). Pre-treatmentSfluxmeasurements were made approximately every
2–4 weeks. Pre-treatment data was used to calculate the coefficient of variation inSfluxto ensure that enough collars were
in every plot and subplot. The variability was less than 15% standard error of the mean so no additional collars were added for post-treatment collections. In 2007,Sfluxwas measured bi-weekly
during the growing season and monthly during days 108–131 and days 239–310. In 2008, the second post-treatment year, soilSflux
was measured monthly during times with no snow (days 113– 286). Snow surface CO2flux was measured once in early 2008
following the methodology described in Wang et al. (2003). Discrete soil temperature at 2 and 10 cm depth (T2andT10) was
measured simultaneously at each soil collar using digital long stem thermometers (model no. 15-078k, Fisher Scientific, Pittsburg, PA, USA). Discrete soil moisture measurements were made to a depth of six cm using a portable soil moisture probe
(Delta TH20, Dynamax Inc, Houston, TX) at the time of Sflux
measurements. These data were used in mixed effects models to determine the effect of temperature and moisture on soil surface CO2flux.
2.5. Statistical analysis
Statistical analyses were conducted with SAS version 9.1 software (SAS Institute Inc 2003, Cary, NC), using multiple mixed effects procedure (PROC MIXED) to determine differences among treatments (gaps, mechanized, and control plots). Fixed effects were species gradient (block), treatment, and gap size (subplot) and the random effects included plot by the interaction of block and treatment and plot by subplot. The multiple mixed effects models were conducted by year and across post-treatment years. Repeated measures analyses were also con-ducted using a mixed effects procedure and compound symmetry for the covariance structure. The random effects were plot within treatment by block and plot within treatment, block and subplot.
Regression analyses were performed (PROC REG) using the Sflux versus discrete soil temperature and moisture data. The
results from the regression analyses were used to determine which factor (s) were included in empirical models that estimated annual Sflux from continuous soil temperature or
moisture data. Model assumptions were satisfied prior to selecting the best model.
Annual Sflux was modeled using the empirical relationships
between instantaneous Sflux and T10 for each year, plot, and
subplot. Parameters were also generated for each year, block, and treatment to provide average parameters for each treatment. Three models were evaluated: a first order exponential model (Landsberg and Gower, 1997)R=aebT, an Arrhenius model of the formR
s¼
aebT1
(Lloyd and Taylor, 1994; Tuomi et al., 2008), and a power model with a fixed minimum temperature Rs=a(T(208C))b (Fang and Moncrieff, 2001; Bond-Lamberty et al., 2004). We selected a minimum temperature of208C because it occurred well below temperatures measured in the field (Fig. 3), it was below laboratory incubations microbial respiration threshold of
188C (Elberling and Brandt, 2003), and it provided parameters that were statistically relevant. The three models were fit using a nonlinear model (PROC NLIN). Models that provided reasonable parameters, the smallest sum of squares error, and converged were deemed to be the best fit. All models provided good visual fits to the data, reasonable parameter values, good sums of squares, and all residual distributions were satisfactory (data not shown). The Fang and Moncrieff (2001)minimum temperature function with a fixed temperature minimum provided the best sum of squares error (86%) for all of the plots and subplots and provided good fits (Appendix A1,Table 3,Fig. 5). The temperature was fixed to help solve convergence problems or inappropriate parameter values. Model parameters for the best model (Fang and Moncrief with fixed temperature) were not significantly different among treat-ment (Table 3andAppendix A1).
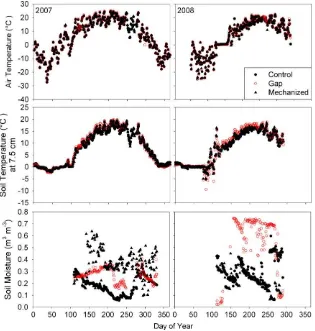
Fig. 3.Discrete measurements of soil temperature (8C) and soil moisture (m3m3) (depth of 6 cm) taken at the time of soil surface CO
2flux (Sflux) measurements. Asterisks denote significant differences at measurement periods (a= 0.05).
Table 3
Parameters were generated from a two parameterFang and Moncrieff Function (2001)using PROC NLIN for each plot and subplot to determine if the parameters varied significantly among treatment. Since no parameters varied significantly, parameters were generated directly for each block and treatment andNtotalandNerrorare degrees of freedom for the overall model and the error term, annually.
Year Block Ntotal Nerror a b P-value
2007 Maple-ash 412 410 0.00191 2.1709 <0.0001
2007 Maple-hemlock 435 433 0.00536 1.8801 <0.0001
2007 Maple 841 839 0.00184 2.1984 <0.0001
2008 Maple-ash 217 215 0.000019 3.4893 <0.0001
2008 Maple-hemlock 208 206 0.000030 3.3400 <0.0001
3. Results
3.1. Pre-treatment (2006)
Soil temperature and moisture ranged from 9 to 47 in 2006 and did not differ significantly between plots designated for different treatment types. Measured soil surface CO2 flux (Sflux) ranged
from 1.0 to 6.8 (mmol m2s1). Pre-treatment
Sflux was not
significantly different among plots designated for a given treatment during any pre-treatment measurement periods (Julian days 150–290) (n= 7).
3.2. Treatments effects on soil microclimate
Discrete soil temperature at 2 cm (T2) did not differ significantly
among treatments in 2007 (P= 0.23), or in 2008 (P= 0.10). Discrete soil temperature at 10 cm (T10) was almost significantly different
among treatments in 2007 (P= 0.07) and in 2008 (P= 0.09) and during specific time periods. When 2007 and 2008 data were pooled, soil temperature atT10was significantly greater (P= 0.039)
for the harvested gaps than control and mechanized harvest treatments.
Discrete soil moisture was significantly greater in the selective harvest gap treatment than the mechanized and control treatments in 2007 (P<0.0001) and 2008 (P= 0.003). Average growing season soil moisture (m3water m3 soil) in 2007 and
2008 ranged from 0.32 to 0.36 in the gap treatments, 0.23–0.24 in the control treatment, and 0.22–0.24 in the mechanized treatment (Fig. 3).
3.3. Relationship of soil surface CO2flux (Sflux) to biophysical factors
Measured soil surface CO2 flux (Sflux) ranged from 0.45 to
6.23
mmol m
2s1. Soil moisture, temperature, andSfluxwere all
correlated variables.Sfluxwas more positively correlated toT2and
T10than soil moisture in 2007.Sfluxwas more strongly correlated to
T10thanT2(P<0.0001) in 2008, with good model fits and residuals (adj. R2= 0.44, P<0.0001). In 2007, the regressions of S
flux to
temperature and moisture were significant (adj. R2= 0.38,
P<0.0001), but the Sflux relationships to T2 and soil moisture were not significant in 2008.
Backwards elimination was used to help determine the variables to model annual flux. Using pooledSfluxdata for 2007
and 2008 the full model including both temperatures and soil moisture produced an adj.R2of 0.37 (P<0.0001). The best reduced
model when pooling post-treatment years included onlyT10(adj.
R2= 0.41,P>0.0001). Because soil temperature atT10was the best predictor of Sflux for both years and across all treatments, we
selectedT10to model annualSflux(Fig. 4).
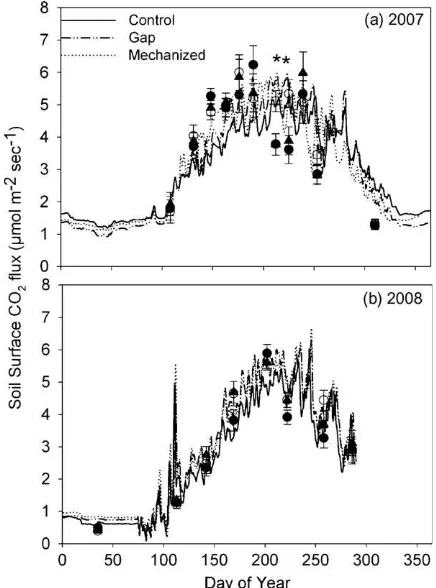
3.4. Treatment and subplot effects on soil surface CO2flux (Sflux)
Sflux was significantly greater for the gap than control or
mechanized treatments for two of the eleven individual measure-ment periods in 2007 and was not significantly different among treatment for any of the eight measurement periods in 2008 (Fig. 5). Sfluxfor measured data were not significantly different
among treatment in 2007 (P= 0.38) or 2008 (P= 0.61). Annual modeledSfluxwas not significantly different among treatments for
2007 (P= 0.61) or for 2008 (P= 0.15) (Table 4).
BlockSfluxwas not a significant main effect when measured flux
data were compared for 2007 (P= 0.27) or 2008 (P= 0.60). Modeled annual flux for blocks was not significantly different among treatments in 2007 (P= 0.35) or in 2008 (P= 0.88) (Appendix A2). Sfluxof subplots was not significantly different in 2007 (P= 0.90) or
2008 (P= 0.71).
Fig. 4.The relationship between soil surface CO2(Sflux) (mmol m2s1) and soil temperature at 10 cm (T10). Symbols are the means of treatment data while the error bars represent the standard error of the mean per measurement period. See
Fig. 3for legend labels.
3.5. Soil surface CO2flux (Sflux) models
Parameter b from the exponential equation was used to
calculate the Q10 (rise in respiration for a 108C increase in
temperature) for each block and treatment. The averageQ10in
2007 for the control, selective harvest gap, and mechanized plots were 1.81, 1.91, and 1.84, respectively, and did not differ significantly among treatments. In 2008, Q10 averaged 2.87,
2.88, 2.85 for control, selective harvest gap and mechanized plots, respectively, and also did not differ significantly among treat-ments. Averaged across treatments,Q10s were 33–36% larger in
2008 than 2007.
Annual (1 std. err.)Sfluxwas not significantly different (P= 0.60)
among treatments and averaged 96772, 101172, and
101272 g C m2year1in the control, mechanized and selective
harvest gap treatments, respectively, for the 2-year post-treatment period (Table 4).
4. Discussion
4.1. Comparison of seasonal patterns and annual soil surface CO2flux
(Sflux) in temperate forest systems
The seasonal soil surface CO2flux (Sflux) pattern followed the
characteristic bell shaped curve (Fig. 5) which closely mirrored soil temperature (Fig. 2). InstantaneousSfluxreached its peak in July
(Fig. 5) and declined as soil temperatures decreased.Gower (2003) reported the averageSfluxfor temperate broad-leaved deciduous
forests averaged 780 g C m2year1, but a number of stands had
annual values greater than 1000 g C m2year1. Our annual
estimate for Sflux in this mature northern hardwood forest is
similar to other deciduous forests in northern Wisconsin ranging in age and management history (Euskirchen et al., 2003; Bolstad et al., 2004; Zheng et al., 2005; Tang et al., 2009).Sfluxis positively
correlated to net primary productivity (NPP) and litter quantity (Landsberg and Gower, 1997; Hibbard et al., 2005). The above-ground NPP and quantity of leaf litter biomass at this site (Dyer, 2009) were also greater than other temperate hardwood stands (Fassnacht and Gower, 1997; Burrows et al., 2003), suggesting that the high annualSfluxreflects the higher productivity of this forest
(Raich and Schlesinger, 1992).
4.2. Effects of harvest treatments on soil microclimate and Sflux
We hypothesized that the creation of harvested gaps would significantly increase soil moisture and temperature, as well as Sflux. The creation of gaps removes a portion of the canopy and
understory leaf area that are responsible for transpiration and increases incident light reaching the soil surface. Soil moisture content below 40% or above 80% of field capacity decreases microbial activity (Ino and Monsi, 1969). Soil moisture was 47% greater in harvested gap treatments than mechanized or control treatments in 2007, and was 27–35% greater in harvested gap treatments than the mechanized and control treatments in 2008.
Soil temperatures are typically greater in clear cuts and smaller gaps within the forest than beneath a closed canopy (Gray et al., 2002; Raymond et al., 2006; Fleming et al., 2006), and increased soil temperatures in forest openings ranging in size may explain reported increases inSflux(Fleming et al., 2006). Similar to previous
selection harvest studies summarized in Table 1, this study measured significant differences in soil temperature and moisture, with gaps being 6% warmer and 27% moister than control areas (Figs. 2 and 3). Across many temperate ecosystems, soil respiration was most strongly related to soil temperature rather than factors such as fine root biomass, litterfall, leaf area index, NPP, fine root carbon and gross primary production (Hibbard et al., 2005). Decomposition rates have been found to be related with temperature and precipitation, but are influenced by regional climatic factors which may be influenced by overstory character-istics (Yin et al., 1989).
4.3. Understanding the overall variability in soil surface CO2flux (Sflux)
following forest management
Several mechanisms may be responsible for the wide range of reported variability in Sflux including temperature, moisture,
microbial contributions, fine root contributions, and changes in litter inputs. These abiotic and biotic factors may not respond in synchrony and the overallSfluxmay change depending on the lag
time for each response to occur. We speculate that in 2007 the <18C increase in harvested gaps and the increase in soil moisture significantly influencedSfluxfor brief time periods; especially late
in the growing season when moisture became limiting. Through-out most of the season these effects may have been counteracted by a decrease in autotrophic respiration. Root biomass within the harvested treatment was significantly lower than the mechanized and control treatments (J.A. Forrester, unpublished data) in 2007. Winter harvesting will change the litter inputs, but the effects will be temporally offset by a growing season. The forest floor in 2007, received pre-treatment inputs so it would not contribute to a response during this season.Fahey et al. (2005)estimated that 58% of soil surface CO2emissions were from forest floor horizons. By
2008, litter inputs were significantly lower within harvested areas (J.A. Forrester unpublished data). Soil moisture and temperature were still significantly greater in harvested gap plots, but the difference was smaller than the previous year. The weakened temperature and moisture response of the harvested treatment and concomitant reduced contributions from fine root and forest floor components of Sflux are likely responsible for the lack of
difference in between the control and harvested gap treatments. In addition, the contribution of microbial respiration to total Sflux may respond differently to forest harvesting. Microbial
respiration comprises 40–60% of the total soil surface CO2 flux,
although the contribution can range from 10 to 90% depending on stand age and other factors (Hanson et al., 2000; Bond-Lamberty et al., 2004). Thus, any activity that affects microbial biomass or microbial activity could change Sflux. In a companion study
conducted in the same plots as this research, we did not find a reduction in microbial biomass among treatments, although the microbial community composition did shift (Stoffel, 2009). Chaterjee et al. (2008) reported that harvesting decreased microbial biomass and community structure.
Finally, the timing of the harvest and lack of soil disturbance may also be a factor.Peng and Thomas (2006)reported a similar response as observed here in the non-gap locations of the uneven-aged manuneven-aged stand, although the magnitude of the response was less than that observed in their study. It is possible that the different results might be attributed to the time of harvest. In our study, the harvest occurred during winter when there was significant snow pack and the ground was frozen so there was
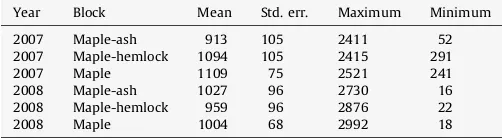
Table 4
Modeled annual soil surface CO2 flux (Sflux) (g C m2year1) from blocks and treatments calculated from LSMEANS. AnnualSfluxwere not significantly different among blocks or treatments.
Year Block Mean Std. err. Maximum Minimum
2007 Maple-ash 913 105 2411 52
2007 Maple-hemlock 1094 105 2415 291
2007 Maple 1109 75 2521 241
2008 Maple-ash 1027 96 2730 16
2008 Maple-hemlock 959 96 2876 22
minimal disturbance to the soil, as shown by the lack of effect of the mechanical disturbance treatment on Sflux and surviving
vegetation (J. Burton, unpublished data). The harvest in the Ontario study (Peng and Thomas, 2006) occurred from June to October, but little detail was provided on the magnitude of disturbance from the mechanized harvest. The winter mechanization treatment did not significantly influenceSfluxcompared to the control plot (Fig. 5,
Tables 3 and 4). Studies have found that scarification or ripping of the mineral soil increases theSflux(Fleming et al., 1998). However,
during this study we had no disturbance of the mineral soil and minimal disturbance to the forest floor and organic layer; therefore, it is not surprising there was no treatment effect onSflux.
Though group selection cuts affected the microclimate within canopy openings following harvest, theSfluxremained relatively
unchanged except for brief periods of time when the harvested gap plots had significantly greaterSflux(Fig. 5). We speculate that the
biotic changes following a harvest balance the response of the abiotic variables, negating an overall change in total Sflux.
Continued monitoring of these treatments will be important in determining if delayed biotic responses to harvest will cause a change inSflux. We recommend that studies examining the effects
of selective harvests on soil carbon dynamics provide not only data on soil moisture and temperature but, litter quality, or fine roots to better understand the short-term effects of selective harvest on soil microclimate data. These data will allow for a better understanding of the effects of selective harvest onSflux.
Acknowledgements
This project was supported in part by a McIntire-Stennis grant WI01075 to S.T. Gower and the National Research Initiative of the USDA Cooperative State Research, Education and Extension Service, grant number 2006-55101-17060 ‘‘Experimental manip-ulation of northern hardwoods forest structure: Quantifying biogeochemical responses for sustainable management’’ to D. Mladenoff, S.T. Gower, and C. Lorimer. The Wisconsin Department of Natural Resources Division of Forestry and Bureau of Integrated Science Services provided major funding, logistical support, and have dedicated the site to long-term research. Special thanks to Erika Latty and Tom Hayes for their work in establishing the research area and field assistants for help with data collection. We thank Nicholas Keuler from the University of Wisconsin-Madison for his statistical assistance and Ben Bond-Lamberty for his comments on drafts of the manuscript.
Appendix A. Supplementary data
Supplementary data associated with this article can be found, in the online version, atdoi:10.1016/j.foreco.2009.10.004.
References
Alban, D.H., 1982. Nutrient accumulation by aspen, spruce and pine. Soil Science Society of America Journal 46, 853–861.
Bond-Lamberty, B., Wang, C., Gower, S.T., 2004. Contribution of root respiration to soil surface CO2flux in a boreal black spruce chronosequence. Tree Physiology 24, 1387–1395.
Bolstad, P.V., Davis, K.J., Martin, J., Cook, B.D., Wang, W., 2004. Component and whole-system respiration fluxes in northern deciduous forests. Tree Physiology 24, 493–504.
Brais, S., Camire, C., Pare´, D., 1995. Impacts of whole-tree harvesting and winter windrowing on soil-pH and base status of clayey sites in northwestern Quebec. Canadian Journal of Forest Research 25, 997–1007.
Burrows, S.N., Gower, S.T., Norman, J.M., Diak, G., Mackay, D.S., Ahl, D.E., Clayton, M.K., 2003. Spatial variability of aboveground net primary production for a forested landscape in northern Wisconsin. Canadian Journal of Forest Research 33, 2007–2018.
Campbell, J.L., Gower, S.T., 2000. Detritus production and soil N transformation in old-growth eastern hemlock and sugar maple stands. Ecosystems 3, 185–192.
Chaterjee, A., Vance, G.F., Pendall, E., Stahl, P.D., 2008. Timber harvesting alter soil carbon mineralization and microbial community structure in coniferous for-ests. Soil Biology and Biochemistry 40, 1901–1907.
Concilio, A., Ma, S., Li, Q., LeMoine, J., Chen, J., North, M., Moorhead, D., Jensen, R., 2005. Soil respiration response to prescribed burning and thinning in mixed conifer and hardwood forests. Canadian Journal of Forest Research 35, 1581– 1591.
Covington, W.W., 1981. Changes in the forest floor organic matter and nutrient content following clear cutting in northern hardwoods. Ecology 62, 41–48. Davidson, E.A., Belk, E., Boone, R.D., 1998. Soil water content and temperature as
independent or confounded factors controlling soil respiration in a temperate mixed hardwood forest. Global Change Biology 4, 217–227.
Dyer, J., 2009. Forest productivity and growth in and around experimental canopy gaps in a second-growth northern hardwood forest, WI. M.S. Thesis. University of Wisconsin-Madison.
Elberling, B., Brandt, K.K., 2003. Uncoupling of microbial CO2production and release in frozen soil and its implications for field studies of arctic C cycling. Soil Biology and Biochemistry 35, 263–272.
Edwards, N.T., Ross-Todd, B.M., 1983. Soil carbon dynamics in a mixed deciduous forest following clear cutting with and without residue removal. Soil Science Society of America Journal 47, 1014–1021.
Euskirchen, E.S., Chen, J., Gustafson, E.J., Ma, S., 2003. Soil respiration at dominant patch types within a managed northern Wisconsin landscape. Ecosystems 6, 595–607.
Fang, C., Moncrieff, J.B., 2001. The dependence of soil CO2efflux on temperature. Soil Biology and Biochemistry 33, 155–165.
Fahey, T.J., Tierney, G.L., Fitzhugh, R.D., Wilson, G.F., Siccama, T.G., 2005. Soil respiration and soil carbon balance in a northern hardwood forest ecosystem. Canadian Journal of Forest Research 35, 244–253.
Fassnacht, K.S., Gower, S.T., 1997. Interrelationships among the edaphic and stand characteristics, leaf area index and aboveground net primary production of upland forest ecosystems in north central Wisconsin. Canadian Journal of Forest Research 27, 1058–1067.
Fleming, R.L., Black, T.A., Adams, R.S., Stathers, R.J., 1998. Silvicultural treatments, microlimatic conditions and seedling response in Southern Interior clearcuts. Canadian Journal of Soil Science 78, 115–126.
Fleming, R.L., Laporte, M.F., Hogan, G.D., Hazlett, P.W., 2006. Effects of harvesting and soil disturbance on soil CO2efflux from a jack pine forest. Canadian Journal of Forest Research 36, 589–600.
Gower, S.T., 2003. Patterns and mechanisms of the forest carbon cycle. Annual Review of Energy and Environment 29, 169–204.
Gray, A.N., Spies, T.A., Easter, M.J., 2002. Microclimatic and soil moisture responses to gap formation in coastal Douglas-Fir forests. Canadian Journal of Forest Research 32, 332–343.
Hanson, P.J., Edwards, N.T., Garten, C.T., Andrews, J.A., 2000. Separating root and soil microbial contribution to soil respiration: a review of methods and observa-tions. Biochemistry 48, 115–146.
Hibbard, K.A., Law, B.E., Reichstein, M., Sulzman, J., 2005. An analysis of soil respiration across northern hemisphere temperate ecosystems. Biogeochem-istry 73, 29–70.
Houghton, J.T., Ding, Y., Griggs, J.J., Nouger, M., van der Linden, P.J., Dai, X., Maskell, K., Johnson, C.A., 2001. Climate Change 2001: The Scientific Basis. Cambridge University Press, Cambridge.
Ino, Y., Monsi, M., 1969. An experimental approach to the calculation of CO2amount evolved from several soils. Japanese Journal of Botany 20, 153–188. Johnson, D.W., Cutis, P.S., 2001. Effects of forest management on soil C and N
storage: meta-analysis. Forest Ecology and Management 140, 227–238. Kirschbaum, M.U.F., 1995. The temperature dependence of soil organic matter
decomposition, and the effect of global warming on soil organic C storage. Soil Biology and Biochemistry 27, 753–760.
Landsberg, J.J., Gower, S.T., 1997. Applications of Physiological Ecology to Forest Management. Academic Press, New York, p. 354.
Lloyd, J., Taylor, A., 1994. On the temperature dependence of soil respiration. Functional Ecology 8, 315–323.
Londo, A.J., Messina, M.G., Schoenholtz, S.H., 1999. Forest harvesting effects on soil temperature, moisture, and respiration in a bottomland hardwood forest. Soil Science Society American Journal 63, 637–644.
Martin, J.L., Gower, S.T., Plaut, J., Holmes, B., 2005. Carbon pools in a boreal mixedwood logging chronosequence. Global Change Biology 11, 1883–1894. Mattson, K.G., Smith, H.C., 1993. Detrital organic matter and soil CO2efflux in forests
regenerating from cutting in West Virginia. Soil Biology and Biochemistry 25, 1241–1248.
Minckler, L.S., Woerheide, J.D., 1965. Reproduction of hardwoods: 10 years after cutting as affected by site and opening size. Journal of Forestry 63, 103–107. Moore, M.R., Vankat, J.L., 1986. Responses of herb layer to the gap dynamics of a
mature beech-maple forest. American Midland Naturalist 115, 336–347. Nauertz, E.A., Crow, T.R., Zasada, J.C., Teclaw, R.M., 2004. Microclimatic variation
between managed and unmanaged northern hardwood forests in Upper Michi-gan, USA. United States Department of Agriculture, North Central Research Station, General Technical Report NC-236.
Post, W.M., Emanuel, W.R., Zinke, P.J., Strangenberger, A.G., 1982. Soil carbon pools and world life zones. Nature 298, 156–159.
Qi, Y., Xu, M., Wu, J., 2002. Temperature sensitivity of soil respiration and its effects on ecosystem carbon budget: nonlinearity begets surprises. Ecological Model-ing 153, 131–142.
Raich, J.W., Schlesinger, W.H., 1992. The global carbon dioxide flux in soil respira-tion and its relarespira-tionship to vegetarespira-tion and climate. Tellus 44B, 81–99. Raymond, P., Munson, A.D., Ruel, J.-C., Coates, K.D., 2006. Spatial patterns of soil
microclimate, light, regeneration, and growth within silvicultural gaps of mixed tolerant hardwood-white pine stands. Canadian Journal of Forest Research 36, 639–651.
Rustad, L.E., Fernandez, I.J., 1998. Experimental soil warming effects on CO2and CH4 flux from a low elevation spuce-fir forest soil in Maine, U.S.A. Global Change Biology 4, 597–605.
Schilling, E.B., Lockaby, B.G., Rummer, R., 1999. Belowground nutrient dynamics following three harvest intensities on the Pearl River floodplain, Mississippi. Soil Science Society American Journal 63, 1856–1868.
Schlenter, R.E., Van Cleve, K., 1985. Relationship between CO2evolution for soil, substrate temperature, and substrate moisture in four mature forest types in interior Alaska. Canadian Journal of Forest Research 15, 97–106.
Schlesinger, W.H., 1997. Biogeochemistry: An Analysis of Global Change, 2nd ed. Academic Press, Boston, p. 588.
Scott, N.A., Rodrigues, C.A., Hughes, H., Lee, J.T., Davidson, E.A., Dail, D.B., Malerba, P., Hollinge, D.Y., 2004. Changes in carbon storage and net carbon exchange one year after an initial shelterwood harvest at Howland Forest, ME. Environmental Management 33, S9–S22.
Seely, B., Welham, C., Kimmins, H., 2002. Carbon sequestration in a boreal forest ecosystem: results from the ecosystem simulation model, FORCAST. Forest Ecology and Management 169, 123–135.
Singh, J.S., Gupta, S.R., 1977. Plant decomposition and soil respiration in terrestrial ecosystesm. Botanical Reviews 43, 449–528.
Stoffel, J.L., 2009. Effects of tree species and management practices on soil carbon dynamics in Upper Midwest forests. Ph.D. Dissertation. University of Wiscon-sin-Madison.
Strigel, R.G., Wickland, K.P., 1998. Effects of a clear-cut harvest on soil respiration in a jack pine-lichen woodland. Canadian Journal of Forest Research 28, 534– 539.
Tang, J., Bolstad, P.V., Martin, J.G., 2009. Soil carbon fluxes and stocks in a Great Lakes forest chronosequence. Global Change Biology 15, 145–155.
Tang, J., Misson, L., Goldstein, A.H., 2005. Forest thinning and soil respiration in a ponderosa pine plantation in the Sierra Nevada. Tree Physiology 25, 57–66. Tuomi, M., Vanhala, P., Karhu, K., Fritze, H., Liski, J., 2008. Heterotrophic soil
respiration—comparison of different models describing its temperature depen-dence. Ecological Modeling 211, 182–190.
Vogel, J.G., Valentine, D.W., 2005. Small root exclusion collars provide reasonable estimates of root respiration when measured during the growing season of installation. Canadian Journal of Forest Research 35, 2112–2117.
Wang, C., Bond-Lamberty, B., Gower, S.T., 2003. Soil surface CO2flux in a boreal black spruce fire chronosequence. Journal of Geophysical Research 108 (D3) WFX5-1–WFX5-8, art. no. 8224.
Winkler, J.P., Cherry, R.S., Schlesinger, W.H., 1996. The Q10relationship of microbial respiration in a temperate forest soil. Soil Biology and Biochemistry 28, 1067– 1072.
Witkamp, M., 1969. Cycles of temperature and carbon dioxide evolution from litter and soil. Ecology 50, 922–924.
Yanai, R.D., Currie, W.S., Goodale, C.L., 2003. Soil carbon dynamics following forest harvest: an ecosystem paradigm reconsidered. Ecosystems 6, 197–212. Yin, X., Perry, I.A., Dixon, R.K., 1989. Influence of canopy removal on oak forest floor
decomposition. Canadian Journal of Forest Research 19, 204–214.