DISCLOSURE APPENDIX AT THE BACK OF THIS REPORT CONTAINS IMPORTANT DISCLOSURES, ANALYST CERTIFICATIONS, AND THE STATUS OF NON-US ANALYSTS. US Disclosure: Credit Suisse does and seeks to do business with companies covered in its research reports. As a result, investors should be aware that the Firm may have a conflict of interest that could affect the objectivity of this report. Investors should consider this report as only a single factor in making their investment decision.
29 April 2014 Asia Pacific Equity Research
ASEAN Healthcare Sector
Connections SeriesClose to escape velocity
Figure 1: Health expenditure as a percentage of GDP—OECD since 1960 vs ASEAN since 1995
0.0 1.0 2.0 3.0 4.0 5.0 6.0 7.0 8.0 9.0
'60 '65 '70 '75 '80 '85 '90 OECD UK AU JP SG MY ID TH PH
ASEAN
Source: OECD, World bank, Credit Suisse research
■ ASEAN healthcare nearing a tipping point à la OECD in the 1960s: Malaysia/Indonesia to lead growth. The perception of the ASEAN hospital sector's attractiveness is mainly driven by its level of underpenetration. We argue that the more critical underlying macroeconomic drivers (primarily per capita income, ageing and favourable regulations) are now aligned to push healthcare expenditure into a sustainably higher growth trajectory, with Malaysia and Indonesia likely to be growth leaders. ASEAN now resembles OECD in the 1960s-70s—on the verge of a multi-year secular bull cycle.
■ Medium-term valuations: ASEAN hospitals attractively priced (and offer further optionality). Given the varied stages of growth and profitability, near-term valuations are misleading. Our analysis focusses on assessing the potential medium-term earnings potential of ASEAN peers, to look at a more sustainable earnings stream, compare valuations in the global context and pick potential stock winners. ASEAN hospitals look attractively valued on our base and bull cases (and many of them offer significant optionality from other potential future opportunities).
■ IHH, Siloam and Bumrungrad are standout growth stories. Our top picks in the ASEAN hospital space are IHH Healthcare (Upgrade to OUTPERFORM)—hitting the sweet spot in geographies and customer segments plus optionality in India/China; Siloam (re-instate coverage with OUTPERFORM)—stands out in terms of being the dominant player in the most attractive market in the region; and Bumrungrad—premium player in ASEAN medical tourism, expected to maintain its leadership position.
The Credit Suisse Connections Series leverages our exceptional breadth of macro and micro research to deliver incisive cross-sector and cross-border thematic insights for our clients.
Research Analysts
Anand Swaminathan
65 6212 3012 anand.swaminathan@credit-suisse.com
Thaniya Kevalee
66 2 614 6219 thaniya.kevalee@credit-suisse.com
Focus charts
Figure 2: ASEAN—country attractiveness to private healthcare spending growth over the medium term
Population growth Aging Income growth Penetration Regulations Medical tourism
Overall relative attractiveness
Singapore Neutral Attractive Neutral Unattractive Neutral Attractive Medium to high
Malaysia Attractive Neutral Neutral Neutral Attractive Attractive Very high
Indonesia Attractive Neutral Attractive Attractive Attractive Neutral Very high
Thailand Neutral Attractive Neutral Neutral Neutral Attractive Medium to high
Philippines Attractive Neutral Attractive Neutral Neutral Neutral Medium to high
Note: This heatmap depicts the attractiveness of various drivers to growth in private healthcare spending over the medium term (five years). Source: Credit Suisse research
Figure 3: Per capita GDP versus health expenditure as a percentage of GDP
US'70
0 5,000 10,000 15,000 20,000 25,000 30,000
Per capita GDP (US$)
1,000 1,500 2,000 2,500 3,000 3,500 4,000 4,500 5,000
Per capita GDP (US$) Health expenditure as % of GDP
Figure 4: Percentage of aged population (65 years+) Figure 5: EBITDA under CS scenarios (2013 = 100)
0.0
1995-2010 100 100 100 100 100 100
166 170 201 160 151
340
IHH BGH BH KPJ RFMD SILO 2013 '18 Bear '18 Base '18 Bull
Figure 6: 2013-18E EBITDA CAGR vs 2015E EV/EBITDA Figure 7: 2018E bull EV/EBITDA (x)
IHH
2013-18E CS base case EBITDA CAGR (%) 2015E EV/EBITDA (x)
IHH BGH BH KPJ RFMD SILO Aus US Global
Close to escape velocity
While the macroeconomic fundamentals are undeniable, the biggest challenge for investors in the ASEAN hospitals sector is balancing the apparently stretched valuations with the future growth potential of individual stocks, both on an absolute and relative basis. To avoid being blindsided by near-term valuations, our analysis focusses on potential medium term (2018-19E) scenarios to normalise earnings and pick potential stock winners.
ASEAN healthcare expenditure growth nearing a tipping point
Healthcare expenditure as a percentage of GDP in the OECD countries is almost three times the levels seen in ASEAN. Even with the rapid pace of increase in wealth levels in ASEAN over the past 15 years, the pace of growth in healthcare expenditure continues to lag more developed countries. ASEAN (in most cases excluding Singapore) healthcare expenditure growth is now close to achieving escape velocity and should see acceleration over the medium term (five to ten years) with various underlying drivers now falling in place. In some sense, ASEAN healthcare spending growth is now similar to the US/UK in the 1960s-70s—on the verge of a secular bull cycle. We find Malaysia and Indonesia as the most attractive markets for private healthcare players in ASEAN over the medium term.
Potential medium-term scenarios for 2018-19E earnings
Given the hospital groups in Asia are in various stages of growth, we need to look beyond the near term in gauging relative valuations and implied growth potential. Based on their current expansion plans, we believe ASEAN hospital groups will attain a steady-state earnings base by 2018. Although their networks and earnings base might continue to expand inorganically beyond 2018, organic (same hospital) growth will become a primary driver. We look at various medium-term (2018-19) scenarios for ASEAN hospitals. Siloam, IHH and Bumrungrad clearly offer the most attractive growth stories in ASEAN healthcare. While the base case growth scenarios (15-40% CAGR) themselves are attractive, the earnings upside under our bull case scenarios (18-55% CAGR) are significantly higher.
Picking the leaders: IHH and Siloam stand out
When we use our medium-term earnings scenarios, valuations of ASEAN hospitals appear reasonable both in absolute terms and in the context of global mature peers. If our bull case scenarios play out, some of them look like outright bargains. While strong underlying demand growth should lift all stocks, we shortlist three winners:
IHH Healthcare (Upgrade to OUTPERFORM): IHH has probably hit the sweet spot in terms of targeting both the right geographies and customer segments, along with a lot of optionality (in India and China). We are now increasingly convinced of its execution capability. IHH, in our view, offers the best risk-reward profile in the region—among the best growth profile, boosted by better execution track record and lower margin risk due to positioning in the premium segment. We upgrade rating to OUTPERFORM from Neutral. Siloam (Reinstate coverage with OUTPERFORM): Siloam stands out in terms of being the dominant player in the most attractive market in the region. While we appreciate that the market needs more convincing in terms of execution capability, we believe Siloam could prove to be one of the best growth stories over the medium term. We reinstate coverage on the stock (it is just out of restriction) with an OUTPERFORM rating and a TP of Rp13,000 and we also significantly increase our FY14/15 EPS estimates by 36%/19%. Bumrungrad: One of the best managed hospitals in ASEAN with the highest ROE of 27.5% (2013). BH has maintained its leadership in Thailand's premium healthcare market over the years, and with its second campus expansion, the leadership gap is likely to widen. While the stock has already outperformed over the past few months, its valuation relative to sector peers remains attractive.
Our heatmap shows Indonesia and Malaysia to lead health expenditure growth in ASEAN
Siloam, IHH and
Bumrungrad offer the most attractive growth stories
Sector valuation snapshot
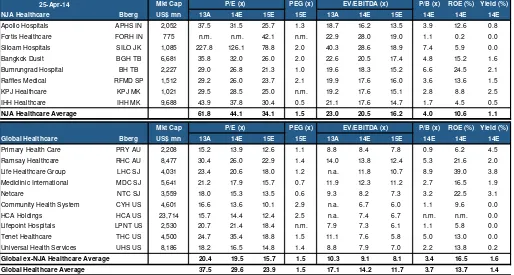
Figure 8: Global healthcare valuation summary25-Apr-14 Mkt Cap PEG (x) P/B (x) ROE (%) Yield (%)
NJA Healthcare Bberg US$ mn 13A 14E 15E 15E 13A 14E 15E 14E 14E 14E
Apollo Hospitals APHS IN 2,052 37.5 31.5 25.7 1.3 18.7 16.2 13.5 3.9 12.6 0.8
Fortis Healthcare FORH IN 775 n.m. n.m. 42.1 n.m. 22.9 28.0 19.0 1.1 0.2 0.0
Siloam Hospitals SILO JK 1,085 227.8 126.1 78.8 2.0 40.3 28.6 18.9 7.4 5.9 0.0
Bangkok Dusit BGH TB 6,681 35.8 32.0 26.0 2.0 22.6 20.5 17.4 4.8 15.2 1.6
Bumrungrad Hospital BH TB 2,227 29.0 26.8 21.3 1.0 19.6 18.3 15.2 6.6 24.5 2.1
Raffles Medical RFMD SP 1,512 29.2 26.0 23.7 2.1 19.9 17.6 16.0 3.6 13.6 1.5
KPJ Healthcare KPJ MK 1,021 29.5 28.5 25.0 n.m. 19.2 17.6 15.1 2.8 8.8 2.5
IHH Healthcare IHH MK 9,688 43.9 37.8 30.4 0.5 21.1 17.6 14.7 1.7 4.5 0.5
NJA Healthcare Average 61.8 44.1 34.1 1.5 23.0 20.5 16.2 4.0 10.6 1.1
Mkt Cap PEG (x) P/B (x) ROE (%) Yield (%)
Global Healthcare Bberg US$ mn 13A 14E 15E 15E 13A 14E 15E 14E 14E 14E
Primary Health Care PRY AU 2,208 15.2 13.9 12.6 1.1 8.8 8.4 7.8 0.9 6.2 4.5
Ramsay Healthcare RHC AU 8,477 30.4 26.0 22.9 1.4 14.0 13.8 12.4 5.3 21.6 2.0
Life Healthcare Group LHC SJ 4,031 23.4 20.6 18.0 1.2 n.a. 11.8 10.7 8.9 39.0 3.8 Mediclinic International MDC SJ 5,641 21.2 17.9 15.7 0.7 11.9 12.3 11.2 2.7 16.5 1.9
Netcare NTC SJ 3,559 18.0 15.3 13.5 0.6 9.3 8.2 7.3 3.2 22.5 3.1
Community Health System CYH US 4,601 16.6 13.6 10.1 2.9 n.a. 6.7 6.0 1.1 9.6 0.0
HCA Holdings HCA US 23,714 15.7 14.4 12.4 2.5 n.a. 7.4 6.7 n.m. n.m. 0.0
Lifepoint Hospitals LPNT US 2,530 20.7 21.4 18.4 n.m. 7.9 7.3 6.1 1.1 5.8 0.0
Tenet Healthcare THC US 4,500 24.7 35.4 18.8 1.5 11.1 7.6 5.8 5.0 13.0 0.0
Universal Health Services UHS US 8,186 18.2 16.5 14.8 1.4 8.8 7.9 7.0 2.2 13.8 0.2
Global ex-NJA Healthcare Average 20.4 19.5 15.7 1.5 10.3 9.1 8.1 3.4 16.5 1.6
Global Healthcare Average 37.5 29.6 23.9 1.5 17.1 14.2 11.7 3.7 13.7 1.4
P/E (x)
P/E (x)
EV/EBITDA (x)
EV/EBITDA (x)
Source: The BLOOMBERG PROFESSIONAL service TM, Credit Suisse estimates
Figure 9: P/E (2015E)
APHS FORH SILO BGH BH RFMD KPJ IHH PRY RHC LHC MDC NTC CYH HCA LPNT THC UHS
India ASEAN Australia S. Africa United States
Figure 10: EV/EBITDA (2015E)
13.5
APHS FORH SILO BGH BH RFMD KPJ IHH PRY RHC LHC MDC NTC CYH HCA LPNT THC UHS
India ASEAN Australia S. Africa United States
ASEAN healthcare expenditure
growth nearing a tipping point
Healthcare expenditure as a percentage of GDP in the OECD countries is almost three times the levels seen in ASEAN. Even with the rapid pace of increase in wealth levels in ASEAN over the past 15 years, the pace of growth in healthcare expenditure continues to lag more developed countries, despite the low base and underpenetration levels. Based on our analysis, the pace of increase in healthcare expenditure reaches escape velocity when certain underlying drivers and economic conditions are in place.
Figure 11: Total healthcare spending as a percentage of GDP
0.0 2.0 4.0 6.0 8.0 10.0 12.0 14.0
'60 '65 '70 '75 '80 '85 '90
US UK AU JP SG MY ID TH PH
ASEAN 1995-2010
Source: OECD, World bank, Credit Suisse research
In this section, we argue that ASEAN (in most cases excluding Singapore) healthcare expenditure growth is now close to achieving escape velocity and should see acceleration over the medium term (five to ten years) with various underlying drivers now falling in place. In some sense, ASEAN healthcare spending growth is now on the verge of a secular bull cycle, similar to the US/UK in the 1960s-70s.
Gauging the drivers of private healthcare spending in
ASEAN and lessons from OECD
In order to estimate the potential upside to healthcare spending in the region and identify relative outperformers, we chart an ASEAN healthcare heatmap with a set of key healthcare spending growth drivers:
■ Population growth and ageing (key determinant of healthcare expenditure growth with a non-linear relationship).
■ Income growth/per capita GDP (key determinant of healthcare expenditure growth with a non-linear relationship).
■ Penetration levels: the demand supply gap (drives potential increase in private healthcare investments and profitability).
■ Government healthcare spending/regulations (sets up the regulatory backdrop for private healthcare spending and growth).
■ Insurance coverage levels (drives healthcare expenditure growth and profitability).
Healthcare expenditure as a percentage of GDP in the OECD countries is almost three times that of ASEAN
■ Medical tourism (as a booster to healthcare investment and spending). Demographics: Slower population growth to be more than offset by ageing
When looking at demographics in the context of healthcare spending, while the longer-term potential for growth is driven by overall population growth, the near-to-medium longer-term trends are more correlated to the age of the population. While life expectancy continues to increase across the board, healthcare-related spending tends to increase with ageing, especially in the 65+ years age group.
Figure 12: Population (mn) Figure 13: Population growth CAGR (%)
5.1
Source: UN Population database
Singapore: While Singapore has the smallest population base among ASEAN, it is probably ageing the fastest and the pace of ageing is likely to accelerate over the foreseeable future. By 2020, the median age of Singaporeans is likely to be the highest in ASEAN at 43 years, and about 15% of the population is likely to be above 65 years of age. Malaysia: Population growth during this decade is likely to be the highest at 1.5% CAGR, but Malaysia's population is likely to remain mostly young in 2020, with a median age of 29 years and only 7% of the population above 65 years of age.
Indonesia: The population is likely to both grow (0.9% CAGR) and age steadily through this decade with the median age around 31 years by 2020.
Thailand: After Singapore, Thailand's population is likely to age the most by 2020. The median age is likely to increase to 38 years by 2020 with roughly 12% of the population above 65 years of age.
The Philippines: With strong population growth in ASEAN for the next few decades,
Figure 14: Median age (x) Figure 15: Percentage of population above 65 years
Source: UN Population database
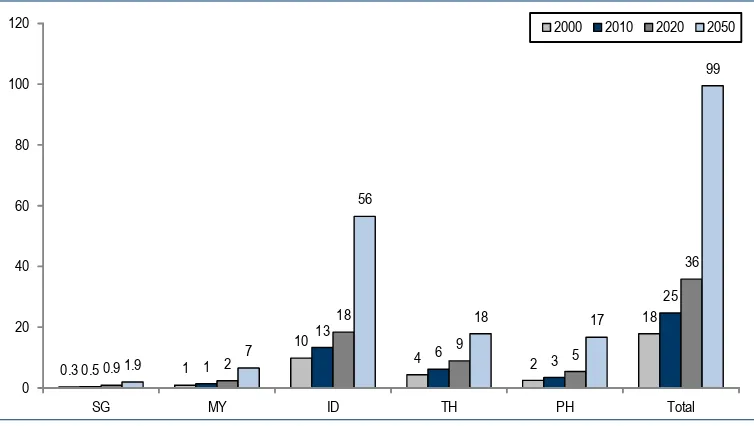
By 2020, the aged population (above 65 years of age) in ASEAN could hit 36 mn from 25 mn in 2010. Indonesia will most likely be the major contributor to this increase. By 2050, it could hit 100 mn with Indonesia home to more than half the aged in the region. Interestingly, given better population growth in the Philippines, the number of aged could reach the same level as Thailand, despite a much younger population.
Figure 16: Population above 65 years of age (mn)
0.3 1
Source: UN Population database
Income growth/per capita GDP: Excluding Singapore, others should continue to grow steadily from a low base
Income growth and per capita GDP are probably the most important factors driving private healthcare expenditure spend, especially for economies crossing over certain per capita GDP thresholds. Empirically, as per capita GDP increases and the middle class has higher disposable income with basic needs more than satisfied, both the absolute and the share of income spent on healthcare needs tend to show a non-linear increase. Except probably Singapore, ASEAN countries are expected to see their overall income levels continue to grow faster and potentially spend more on healthcare needs.
ASEAN's aged population could hit almost 100 mn by 2050, with Indonesia home to more than half the aged in the region
Figure 17: Per capita GDP (PPP US$)
1980 1990 2000 2010 2018F
Source: World Bank
Singapore: An outlier in the ASEAN context with income levels already at developed country levels. However, slower potential growth in income levels could be offset by a rapidly ageing population and potential growth in influx of medical tourists.
Malaysia—Malaysia's per capita GDP level is probably the closest to threshold levels where healthcare spend as a percentage of income sees a non-linear jump.
Indonesia: Has seen exceptional per capita income growth over the past decade and is likely to again see the best growth over the near-to-medium term. With both absolute and relative healthcare penetration levels being the lowest for Indonesia, it holds the most potential to see a sustained acceleration in healthcare expenditure growth in ASEAN. Thailand: While the country's per capita income level is almost half of Malaysia's, Thailand's per capita GDP growth level is expected to be similar to that of Malaysia. The Philippines: An interesting case where income levels are at par with Indonesia, but healthcare penetration is already above ASEAN averages. Philippines' potential medium-term income growth levels are expected to be only similar to Malaysia/Thailand.
Figure 18: Per capita GDP (base 1990 = 100) Figure 19: Per capita GDP; CAGR (%)
As the chart below illustrates, Indonesia provides an ideal combination of a big population base, low penetration levels and faster expected income growth over the medium term. At the other end of the spectrum, Singapore has the least population and is expected to see lowest income growth over the medium term.
Figure 20: ASEAN—per capita GDP (US$ PPP) vs 2010-18F CAGR (%)
0.0
0 10,000 20,000 30,000 40,000 50,000 60,000
Per capita GDP (US$) Per capita GDP growth 2010-18F (%)
SG ID
PH
TH
MY
Note: Size of the bubble indicates the size of the population. Source: World Bank, Credit Suisse research
Penetration levels: Demand-supply gap
Clearly the underlying supply of healthcare services in ASEAN tends to lag the West by a wide margin due to a multitude of factors. With the expected increase in healthcare
Figure 21: Total healthcare expenditure as a percentage of GDP
1.5
Indonesia provides an ideal combination for a sustained acceleration in healthcare expenditure growth
Singapore: Interestingly, while Singapore's income levels are close to those of developed markets, healthcare expenditure as a percentage of GDP is only slightly higher than ASEAN's, and lags the developed markets' by a wide margin. This is partly reflective of the better efficiency of the Singaporean healthcare system and better preventive healthcare services. Looking at it in the context of a rapidly ageing population, there appears to be a lot of potential to increase its healthcare expenditure levels.
Malaysia: Health expenditure as a percentage of GDP is lower than the ASEAN average and is higher than only Indonesia.
Indonesia: Indonesia healthcare expenditure penetration is probably among the least in the world and is clearly the least penetrated among the most populated countries.
Thailand/Philippines: Ex-Singapore, Thailand and Philippines have relatively better healthcare expenditure penetration levels in ASEAN.
Looking at the supply side of the equation will help us better gauge the potential for near to medium term growth in healthcare revenue pool, future requisite investments in the healthcare sector, and more importantly, pricing power of private healthcare players. The intent and capacity of governments/regulators would be the final determinant of the potential for private healthcare players to grow their revenue pool and increase profitability levels.
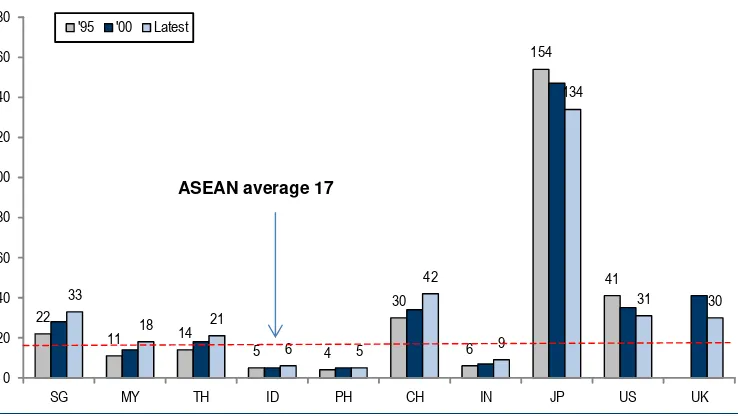
Supply of doctors: The ASEAN average of one physician per 1,000 people is less than half of that of OECD. Within ASEAN, Thailand and Indonesia have the least number of doctors per capita. The higher per capita availability of doctors in Singapore might be partly to serve the medical tourism industry.
Figure 22: Number of physicians per 1,000 people
1.4
0.6
0.2
0.1
0.4
0.9
0.4
1.9
2.2
1.8 1.9
1.2
0.6
0.2
1.3
1.5
0.7
2.2
2.5
2.8
0.0 0.5 1.0 1.5 2.0 2.5 3.0
SG MY TH ID PH CH IN JP US UK
'95 '00 Latest
ASEAN average 1.0
Source: WHO
Figure 23: Number of hospital beds per 10,000 people involvement like in China. In other words, most economies tend to build healthcare supply in line with the increase in demand, albeit with a lag. While in Indonesia, both demand and supply have a lot of catching up to do, Malaysia/Thailand can potentially meet more incremental demand with the current supply.
Figure 24: Total health expenditure as a percentage of GDP vs hospital beds per capita
SG
Source: WHO, World Bank, Credit Suisse research
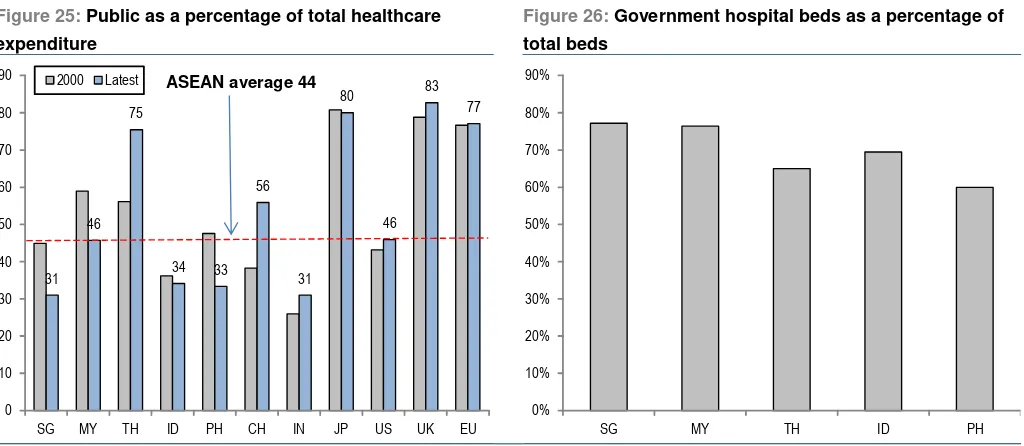
Government healthcare spending: How to fund it?
Healthcare is a double-edged sword for governments, especially the ones with fiscal deficits. While increasing public expenditure on healthcare could win more votes, it could also prove to be a big strain on government budgets given the upfront capital investment required and steady commitment to capex on an ongoing basis.
The easier option for governments is to encourage private investments in the sector. While eventually governments tend to restrict the profitability of private healthcare businesses, the sector's profitability has to be high enough to attract private capital investment in the early stages of the cycle. As a result, we expect regulations in the healthcare space to
remain conducive to private healthcare players over the next ten to twenty years—a sweet spot for them in terms of both growing rapidly and improving profitability.
Figure 25: Public as a percentage of total healthcare expenditure
Figure 26: Government hospital beds as a percentage of total beds
31 46
75
34 33 56
31 80
46 83
77
0 10 20 30 40 50 60 70 80 90
SG MY TH ID PH CH IN JP US UK EU
2000 Latest ASEAN average 44
0% 10% 20% 30% 40% 50% 60% 70% 80% 90%
SG MY TH ID PH
Source: World Bank, Government websites, Credit Suisse research
Singapore: Singapore's government is probably in the best position among ASEAN countries to increase public spending on healthcare. The Singapore government's primary focus over the medium term remains to make healthcare more accessible to its ageing population. While we expect a sustained increase in public expenditure on healthcare, we do not foresee crowding out of private healthcare spending. Private healthcare players could continue to see growth as well as increased pricing power, driven by increasing wealth levels, private insurance penetration, a sizeable wealthy migrant population, and most importantly, Singapore's positioning as a medical tourism hub.
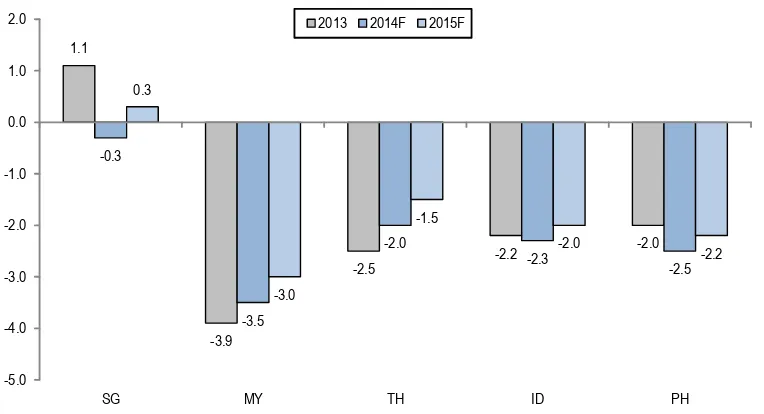
Malaysia: Malaysia probably has the least legroom among ASEAN countries to see a big increase in public healthcare expenditure, with the government fiscal deficit the highest among ASEAN at 3-4% of GDP. With the government's healthcare-related commitments already high—70-80% of the total beds in government hospitals and the government spending 46% of the total budget on healthcare—we expect its share of total healthcare expenditure to remain at best flat or close to current levels. Nonetheless, we expect a relatively favourable investment climate for healthcare players, not least to help achieve the government's aim of promoting Malaysia as a medical tourism hub. However, we do believe the government could do more by relaxing some of the land zoning laws and restrictions on medical bill sizes to further accelerate private investment.
Indonesia: We rank Indonesia as the most conducive to local private healthcare players, but the most restrictive for foreign investments (given restrictions on foreign investments and rules restricting foreign doctors). Given the underpenetration level and expected growth in healthcare needs, this provides a great opportunity for local players to expand aggressively, but the private healthcare space remains extremely fragmented. The government's ambitious plans to achieve universal health insurance coverage could further expand the target market for private players.
Figure 27: Government fiscal balance (percentage of GDP)
1.1
-3.9
-2.5 -2.2
-2.0 -0.3
-3.5
-2.0
-2.3
-2.5 0.3
-3.0
-1.5
-2.0
-2.2
-5.0 -4.0 -3.0 -2.0 -1.0 0.0 1.0 2.0
SG MY TH ID PH
2013 2014F 2015F
Figure 28: ASEAN—key government initiatives/focus on the healthcare sector Country Comments
Singapore Healthcare 2020 Masterplan: Released in 2012, contains various measures to enhance the accessibility, affordability and
quality of healthcare to be implemented
Highlights of the masterplan include the addition of 1,900 acute beds and 1,800 community beds through to 2020, with the latest target raised to 4,100
Healthcare to be the main driver of higher social spending over the next 10 to 15 years
Funding will be balanced between tax-funded subsidies, collective risk-pooling, individual co-payments and safety nets for the needy, with a focus also on managing healthcare cost inflation
Healthy Living Masterplan to encourage a healthy lifestyle through healthier eating and initiatives to encourage exercise, such as the "One Million Kg Challenge"
Key budget 2014 initiatives:
o Government's direct spending on healthcare to increase to S$7.5 bn in FY14, from S$4 bn in FY11, with the government's share of national healthcare expenditure increasing from 33% in FY12 to 40% or more o Enhancement of Medishield to Medishield Life, to provide universal coverage
o Lifetime healthcare support for the Pioneer Generation, including additional subsidies for primary care and specialist outpatient services
o Medisave top-up for older Singaporeans, and increase in CPF contribution rates for older workers
o Increase in Tobacco Excise Duties by 10% to $388 per kg
Malaysia 10th Malaysia Plan (2011-15) aims to chart Malaysia's development into a high income nation, envisioned in Vision 2020
"Transforming Delivery of the Healthcare System" as part of the plan involves restructuring the national health system, with three key initiatives:
o Streamlining regulatory and service provision roles: MOH will focus mainly on governance and enforcement o Reviewing legislations and regulations: A review of existing legislation and the introduction of new regulations to
emphasise enforcement of accreditation, credentialing and privileging
o Reviewing financing options:. A review of financing options also includes the introduction of cost sharing options
Other key thrusts include increasing capacity of healthcare infrastructure across primary, secondary and tertiary care services, shifting towards wellness and disease prevention and increasing the doctor:population ratio from 1:1,380 in 2005 to 1:597 in 2015, and the nurse-population from 1:592 to 1:200
Budget 2014 also saw the abolishment of the sugar subsidy of 34 sen
Indonesia National Health Strategic Plan (2010-2014) prioritised healthcare access and delivery
Shift of governmental focus towards a community-centric healthcare system since 2004
Objective for the government is to attain universal (100%) public health insurance in the next 3-5 years, for a population of about 263 mn
As of 2012, approximately 60% of the total population was insured under various public and private insurance schemes
Effective 1 Jan 2014, a universal social security system has been implemented, based on Law No. 24/2011 regarding Social Security Administrators, which builds on Law No. 40/2004 regarding the National Social Security System
The new system is intended to cover all employees and residents (including foreign residents) under a single healthcare system by 2019 and a single employment benefit system by 2029
BPJS Health Care (BPJS Kesehatan) will administer healthcare benefits, and BPJS Employment (BPJS
Ketenagakarjaan) will administer employment benefits, which include old-age, pension, workplace accident and death benefits
The four state-owned insurance companies, PT Askes, PT Jamsostek, PT Taspen, and PT Asabri—will be transformed into non-profit public companies under the presidential jurisdiction for more stringent operational control and the adoption of public health insurance will be made mandatory
Thailand Early adopter of Universal Healthcare, with implementation since 2002
In 2006, then Public Health Minister, Mongkol Na Songkhla, abolished the 30 baht co-payment and made the Universal Healthcare Scheme free
Thailand has also recently reaffirmed its commitment to Universal Healthcare in the "Bangkok Statement on Universal Health Coverage" in January 2012
Under the 11th National Economic and Social Development Plan (2012-2016), it was noted that public health expenditure will increase at the expense of other investments, with targeted improvements in public health services, redistribution of health personnel and the development of a national health database
Insurance coverage levels: Increasing penetration levels could boost health expenditure
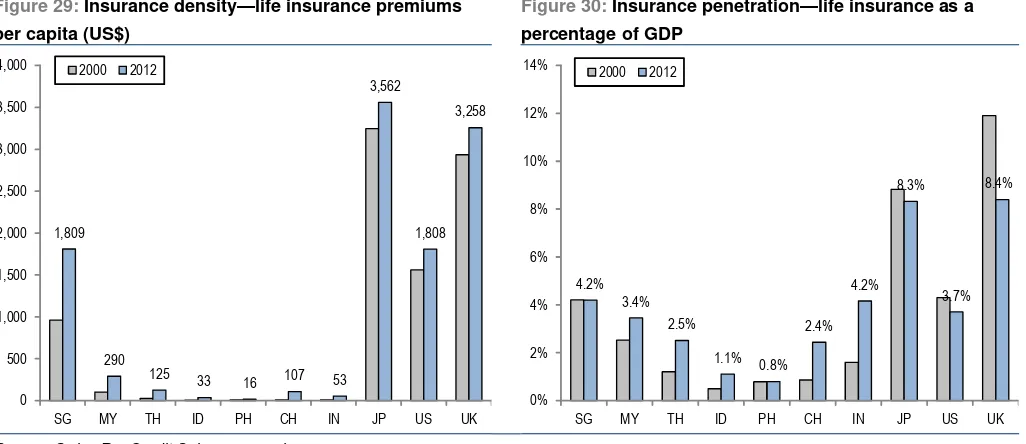
Except probably Singapore, the life insurance density and penetration levels in ASEAN continue to remain very low. While data on medical insurance plans are sparse, it continues to be low. However, medical insurance penetration, partly enabled by government initiatives and increasing income levels, is increasing from very low levels. This could potentially provide an additional boost to healthcare spending in the economy, albeit exerting some influence on the pricing power of hospital operators.
Figure 29: Insurance density—life insurance premiums per capita (US$)
Figure 30: Insurance penetration—life insurance as a percentage of GDP
1,809
290
125 33
16 107 53
3,562
1,808 3,258
0 500 1,000 1,500 2,000 2,500 3,000 3,500 4,000
SG MY TH ID PH CH IN JP US UK
2000 2012
4.2% 3.4%
2.5%
1.1% 0.8% 2.4%
4.2% 8.3%
3.7% 8.4%
0% 2% 4% 6% 8% 10% 12% 14%
SG MY TH ID PH CH IN JP US UK
2000 2012
Source: Swiss Re, Credit Suisse research
WHO and UN consider universal coverage as key priorities
The World Health Organisation (WHO) in its report, Health systems financing: The path to universal health coverage, has detailed its plan of action towards achieving universal health coverage among countries globally. While specific budgets are still being developed and discussed internally, the general objective is to support countries to modify their health financing systems in order to move more rapidly towards universal coverage. Through specific actions and policy assistance at the global and country levels, it is intended that by end-2015, there would be increased coverage with needed health services, a reduction in the proportion of out-of-pocket payments and a reduction in the proportion of the population facing financial impoverishment as a result of out-of-pocket payments.
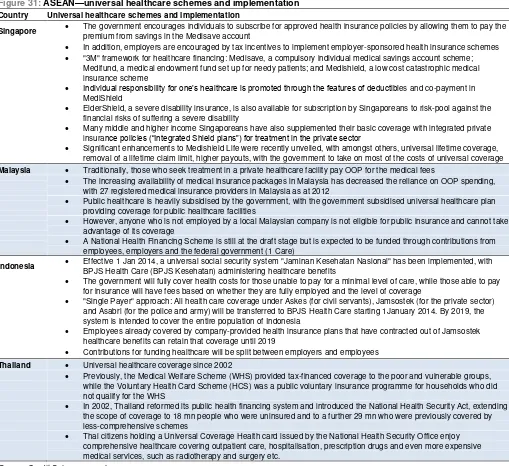
Figure 31: ASEAN—universal healthcare schemes and implementation Country Universal healthcare schemes and implementation
Singapore The government encourages individuals to subscribe for approved health insurance policies by allowing them to pay the
premium from savings in the Medisave account
In addition, employers are encouraged by tax incentives to implement employer-sponsored health insurance schemes
"3M" framework for healthcare financing: Medisave, a compulsory individual medical savings account scheme; Medifund, a medical endowment fund set up for needy patients; and Medishield, a low cost catastrophic medical insurance scheme
Individual responsibility for one’s healthcare is promoted through the features of deductibles and co-payment in MediShield
ElderShield, a severe disability insurance, is also available for subscription by Singaporeans to risk-pool against the financial risks of suffering a severe disability
Many middle and higher income Singaporeans have also supplemented their basic coverage with integrated private insurance policies (“Integrated Shield plans”) for treatment in the private sector
Significant enhancements to Medishield Life were recently unveiled, with amongst others, universal lifetime coverage, removal of a lifetime claim limit, higher payouts, with the government to take on most of the costs of universal coverage
Malaysia Traditionally, those who seek treatment in a private healthcare facility pay OOP for the medical fees
The increasing availability of medical insurance packages in Malaysia has decreased the reliance on OOP spending, with 27 registered medical insurance providers in Malaysia as at 2012
Public healthcare is heavily subsidised by the government, with the government subsidised universal healthcare plan providing coverage for public healthcare facilities
However, anyone who is not employed by a local Malaysian company is not eligible for public insurance and cannot take advantage of its coverage
A National Health Financing Scheme is still at the draft stage but is expected to be funded through contributions from employees, employers and the federal government (1 Care)
Indonesia Effective 1 Jan 2014, a universal social security system "Jaminan Kesehatan Nasional" has been implemented, with
BPJS Health Care (BPJS Kesehatan) administering healthcare benefits
The government will fully cover health costs for those unable to pay for a minimal level of care, while those able to pay for insurance will have fees based on whether they are fully employed and the level of coverage
"Single Payer" approach: All health care coverage under Askes (for civil servants), Jamsostek (for the private sector) and Asabri (for the police and army) will be transferred to BPJS Health Care starting 1January 2014. By 2019, the system is intended to cover the entire population of Indonesia
Employees already covered by company-provided health insurance plans that have contracted out of Jamsostek healthcare benefits can retain that coverage until 2019
Contributions for funding healthcare will be split between employers and employees
Thailand Universal healthcare coverage since 2002
Previously, the Medical Welfare Scheme (WHS) provided tax-financed coverage to the poor and vulnerable groups, while the Voluntary Health Card Scheme (HCS) was a public voluntary insurance programme for households who did not qualify for the WHS
In 2002, Thailand reformed its public health financing system and introduced the National Health Security Act, extending the scope of coverage to 18 mn people who were uninsured and to a further 29 mn who were previously covered by less-comprehensive schemes
Thai citizens holding a Universal Coverage Health card issued by the National Health Security Office enjoy comprehensive healthcare covering outpatient care, hospitalisation, prescription drugs and even more expensive medical services, such as radiotherapy and surgery etc.
Source: Credit Suisse research
Medical tourism: ASEAN countries striving to find their niche
ASEAN is shaping up to be an increasingly dynamic hub for global medical tourism offering world-class healthcare infrastructure, professionals and service at a fraction of the potential cost in more developed countries. Rather than competing with each other for market share, the countries in ASEAN are strategically positioning themselves to target different segments of demand for medical tourism.
Singapore: With its superior infrastructure and premium quality healthcare specialists, Singapore strives to maintain its cutting edge of medical services and offerings. Its competitive advantage is mostly driven by its cost disadvantages—with a higher cost structure, Singapore is least capable of competing on costs in the ASEAN context. Some of the specialised areas in which Singapore has a relative advantage include complex procedures such as organ transplant, cardiovascular surgery, reconstructive surgery and hematopoietic stem cell transplantation. For example, Mount Elizabeth Hospital noted that it performs the largest number of cardiac surgeries and neurosurgeries in the private sector in the region. Pioneering procedures and adopting new technologies are also a
niche offering by Singapore hospitals, such as the use of robot-assisted surgical systems and keyhole surgeries, thus promising better patient turnout and recovery rates.
Malaysia: It is fast emerging as the dark horse in the ASEAN medical tourism space, not helped by a supportive government focussed on positioning Malaysia as a global medical tourism hub. Malaysia's medical tourism potential is bolstered by its focussed investment in improving healthcare infrastructure, ample supply of healthcare professionals and geographical positioning/connectivity to its key target markets of Indonesia and the Middle East. Over the medium term, its cost advantage and improving quality of medical professionals could pose a serious threat to Singapore's medical tourism positioning. Indonesia: Continues to be a net supplier of medical tourism dollars to neighbouring ASEAN countries due to the perceived quality of medical specialists in the country. While in theory, Indonesia's increasing tourist volumes could be potentially a rich source for medical tourism (especially at tourist destinations such as Bali), it might be years before Indonesia poses a threat to its neighbours.
Thailand: Only BH and BGH are active players in medical tourism in Thailand, with the key advantage being relatively cheap pricing and a very strong general tourism sector (this is important given that some medical tourists combine their health check-up with their annual vacation). With growing economic integration among ASEAN countries, Thailand should see strong growth.
Back to the future: ASEAN healthcare sector close to
a tipping point à la OECD in the 1970s
To summarise and conclude our thesis on ASEAN healthcare spending, we look at the commonalities in terms of macroeconomic drivers between ASEAN and OECD countries. Per capita GDP and ageing population are probably the most observable and clear drivers across countries and time periods. In both cases, ASEAN now resembles OECD in the early 1970s which was the starting point of the secular growth story of OECD healthcare spending.
ASEAN per capita GDP: Following a similar pattern as OECD countries
As the following charts illustrate, absolute level of per capita GDP shows a good correlation with the share of healthcare expenditure across countries through decades. Figure 32: Per capita GDP vs health expenditure as a percentage of GDP
US'70
0 5,000 10,000 15,000 20,000 25,000 30,000 Per capita GDP (US$)
1,000 1,500 2,000 2,500 3,000 3,500 4,000 4,500 5,000 Per capita GDP (US$) Health expenditure as % of GDP
Source: World bank, Credit Suisse research
Growth in per capita GDP in ASEAN in 2010 quite resembles that of OECD countries when they were bunched together in the early 1970s. Interestingly, there is a bit of
Malaysia: A genuine competitive threat to Singapore and Thailand
divergence in the pace of increase in healthcare expenditure driven by factors such as ageing, lifestyle, regulation etc., though the overall direction of change is quite similar. Figure 33: Per capital GDP (US$, PPP)
0 500 1000 1500 2000 2500 3000
'60 '65 '70 '75 '80 '85 '90
US UK AU JP MY ID TH PH
ASEAN 1995-2010
Source: World Bank, Credit Suisse research
As illustrated in the table below, healthcare spending decisions and their importance have a non-linear relationship with per capita GDP. The first real jump in allocations to healthcare happens when per capita GDP moves above the US$5,000 level, and then further improves to becoming one of the most important spending categories once per capital GDP moves beyond the US$10,000 level. Notably, Indonesia, Thailand and Philippines are on the verge of moving to the US$5,000-plus per capita GDP bucket, while Malaysia could move comfortably into the US$10,000 bucket over the next few years. Figure 34: Consumer product categories (typical growth stages)—future growth potential at various levels of GDP per capita
High M edium Low
Below $2,000 Cereals Stimulants Beverages
Two Wheelers Apparel Appliances
M eat Health Care Education Consumer Credit Cars PC/Laptops Beauty Products Tourism/Travel
$2,000-$5,000 M eat Beverages Health Care
Apparel Appliances Consumer Credit
Stimulants Cars Tourism/Travel
Two Wheelers Cereals PC/Laptops Beauty Products Education
$5,000-$10,000 Beverages M eat Cereals
Cars Apparel Two Wheelers
Appliances Health Care PC/Laptops Consumer Credit Beauty Products Tourism/Travel Education Stimulants
$10,000-$20,000 Education Cars Cereals
Healthcare PC/Laptops Two Wheelers
Consumer Credit Beverages Appliances
Beauty Products M eat
Tourism/Travel Apparel
Stimulants
Source: World Bank, Credit Suisse estimates
ASEAN in 2010 quite resembles OECD countries' per capita GDP growth when they were bunched together in the early 1970s
Ageing population: ASEAN's silver age just beginning
While research across time periods shows that ageing in itself is not a big driver of healthcare spending, combined with an increase in wealth levels it could result in higher healthcare spending allocations. To some extent, there is a correlation between higher per capita GDP and slowing birth rates, resulting in an ageing population.
Figure 35: Percentage of aged population (65 years+) vs health expenditure as a percentage of GDP
US'70 UK'70
AU'70 JP'70
US'80 UK'80
AU'80 JP'80
US'90
UK'90
AU'90 JP'90
0.0 2.0 4.0 6.0 8.0 10.0 12.0 14.0 16.0 18.0
0 5,000 10,000 15,000 20,000 25,000 30,000 % of aged population Health expenditure as
% of GDP
ASEAN'00
ASEAN'05
ASEAN'10
3.0 3.5 4.0 4.5 5.0 5.5 6.0
1,000 1,500 2,000 2,500 3,000 3,500 4,000 4,500 5,000 % of aged population Health expenditure as % of GDP
Source: World Bank, Credit Suisse research
Historically, there appears to be a good correlation between overall ageing and healthcare spending allocation. ASEAN countries with a couple of decades of steady economic growth do not have populations as young as before, and will probably continue to age over the next few decades. Again, in this respect, ASEAN countries quite resemble the OECD countries in the early 1970s.
Figure 36: Percentage of aged population (65 years+)
0.0 2.0 4.0 6.0 8.0 10.0 12.0 14.0 16.0 18.0
'60 '65 '70 '75 '80 '85 '90
US UK AU JP SG MY ID TH PH
ASEAN 1995-2010
ASEAN heatmap: Picking the medium-term winners in
ASEAN healthcare
To summarise our analysis, we present a heatmap looking at the relative attractiveness of various ASEAN countries for private healthcare players in terms of medium-term growth and profitability. Overall, we find Malaysia and Indonesia to be the most attractive markets for private healthcare players in ASEAN.
Figure 37: ASEAN—country attractiveness to private healthcare spending over the medium term
Population growth Aging Income growth Penetration Regulations Medical tourism
Overall relative attractiveness
Singapore Neutral Attractive Neutral Unattractive Neutral Attractive Medium to high
Malaysia Attractive Neutral Neutral Neutral Attractive Attractive Very high
Indonesia Attractive Neutral Attractive Attractive Attractive Neutral Very high
Thailand Neutral Attractive Neutral Neutral Neutral Attractive Medium to high
Philippines Attractive Neutral Attractive Neutral Neutral Neutral Medium to high
Note: This heatmap depicts the attractiveness of various drivers to growth in private healthcare spending over the medium term (five years). Source: Credit Suisse research
Singapore: Singapore continues to provide an attractive growth market with increasing wealth levels, a fast ageing population and growing importance as a global medical tourism hub. However, its small local population, already high penetration level and increasing regulatory focus on local healthcare services are possible risks to growth potential over the medium term.
Malaysia: Malaysia ranks high on attractiveness driven by increasing income levels, a very supportive regulatory environment and increasing importance as a medical tourism hub. Malaysia is also relatively better placed in terms of supply of healthcare infrastructure. We expect the aggressive investments in the private healthcare sector to continue over the next few years to satisfy unmet demand and aid growth of private healthcare revenue pool with minimal pressure on profitability.
Indonesia: Indonesia ticks almost all boxes in terms of attractiveness for private healthcare players—huge unmet demand for quality healthcare, biggest and growing population base in ASEAN, growing income levels and a largely supportive regulatory environment. We believe the Indonesia healthcare sector is all set to embark on a sustained multi-year growth cycle. It is clearly the most attractive market for private healthcare players in ASEAN over the medium to long term.
Thailand: Thailand's healthcare spending should continue to benefit from its ageing population, low healthcare penetration and attractive medical tourism market. Shortage of doctors and nurses imply supply growth would continue to be limited and the huge gap in facilities between the leading players (such as BH and BGH) and the rest would remain high.
Potential medium-term scenarios
for 2018-19E earnings
Given the hospital groups in Asia are in various stages of growth, one of the major challenges for investors has been to figure out the medium-term growth potential and compare valuations on a normalised basis. On a relative basis, based on current expansion plans, we believe ASEAN hospital groups will attain a steady state earnings base by 2018. Although their networks and earnings base might continue to expand inorganically beyond 2018, organic (same hospital) growth will become a primary driver. The purpose of this exercise is to assess the implied valuation of ASEAN hospital stocks under various medium-term scenarios. Valuation metrics based on near-term earnings are misleading as they do not completely reflect a stable earnings base and is also dragged down by loss-making new hospitals. Looking at earnings circa 2018, we are better placed to assess the relative valuation metrics, especially in the context of global peers, which are already in a more mature stage of growth.
Figure 38: Snapshot of key Asian peers
Key Current Medium-term P/E EV/EBITDA PEG
geographical Target No. of bed target bed (x) (x) (x) focus segments hospitals capacity capacity (2015E) (2015E) (2015E)
Siloam Indonesia All 12 3,436 10,000 78.6 18.9 2.0
IHH Healthcare Singapore,
Malaysia, Turkey
Premium/Medical tourism 33 5,000+ 8,700+ 30.8 14.8 0.5
Bangkok Dusit (BGH) Thailand All 30 4,300 7,000 26.5 17.8 2.1
KPJ Healthcare Malaysia Mass to premium 24 2,800+ 3,800+ 25.1 15.1 n.m.
Raffles Medical Singapore Mass to premium 1 380 380 23.4 15.7 2.1
Bumrungrad Hospital (BH) Thailand Premium/Medical tourism 1 480 790 21.1 15.0 0.9
Source: Company presentations and annual reports, Credit Suisse estimates
In this section, we look at various medium-term (2018) scenarios for ASEAN hospitals under coverage based on their announced pipeline and our assumptions on ramp up, profitability and execution. We look at three potential scenarios for each group:
2018 base case: This scenario assumes that the hospital groups deliver their expected pipeline, almost as promised, with some expected delays. The ramp up periods in terms of margin and earnings contribution are close to historical experience, without giving them any benefit of doubt for learning curve and future improvements in execution capability. 2018 bear case: This scenario assumes some delays in execution/delivery of expansion pipeline as well as slower-than-expected ramp up periods (slower-than-expected top-line growth and/or margin improvements). The breakeven time periods are longer than historical run rates.
2018 bull case: This is not a blue sky scenario, but assumes on-time delivery of the expansion pipeline and an optimistic breakeven time period. This scenario still does not factor in other potential upside to earnings from inorganic opportunities.
Valuation metrics based on near-term earnings are misleading
IHH Healthcare
Figure 39: CS 2018E scenario analysis
2012 2013 2014E 2015E 2018E '13-18E CAGR
(RM mn) Bear Base Bull Bear Base Bull
Revenues 5,906 6,919 8,205 9,747 13,158 16,832 20,647 13.7 19.5 24.4
Operating expenses -4,623 -5,233 -6,211 -7,361
CS EBITDA 1,304 1,661 1,994 2,387 2,763 4,208 5,988 10.7 20.4 29.2
Net profit 363 639 843 1,069 1,316 2,053 2,932 15.5 26.3 35.6
Key assumptions
No. of hospitals 31 31 34 40 44 46 48
No. of operational beds 4,668 4,830 5,330 6,210 7,500 8,500 10,000 9.2 12.0 15.7
Avg Occupancy rate 67% 69% 66% 71% 65% 70% 70%
Key ratios (%)
EBITDA margin 22.1% 24.0% 24.3% 24.5% 21% 25% 29%
Net margin 6.2% 9.2% 10.3% 11.0% 10% 12% 14%
ROE 5.6 3.6 4.6 5.5
Source: Credit Suisse estimates
Summary of management targets by 2018 and key risks
From the current 4,500-5,000 operational bed capacity mainly across Singapore, Malaysia and Turkey, IHH aims to expand to close to 10,000 beds by 2018 (including a new 500-bed hospital in Hong Kong to be operational by 2017). By 2018, the bulk of IHH's expansion plans in the current core markets (Singapore, Malaysia, Turkey) should largely have been delivered and a majority of its hospitals entering maturity. We expect IHH to also start executing its expansion plans for Mainland China by this time, but by 2018, this will still be in its early stages—so does not figure in our 2018 estimates. We would also expect IHH to become more active in India looking at both brownfield and greenfield opportunities. Potential opportunities in China and India could provide further upside to IHH earnings looking beyond the next few years.
CS 2018E scenario analysis: Base case
We assume IHH delivers on its expansion pipeline core markets and the ramp-up periods of new hospitals are in line with historical run rates. We expect minimal profit contribution from Hong Kong by 2018. We expect overall group margins to remain at current levels—a conservative assumption given much of the new hospitals are expected to be operational by 2015-16 and should be margin accretive by 2018.
CS 2018E scenario analysis: Bear case
The bear case mainly assumes longer-than-expected ramp-up periods for new hospitals going operational during 2015-16. This could mean either delays in expanding bed capacity and/or longer-than-expected breakeven periods.
CS 2018E scenario analysis: Bull case
The bull case assumes that everything in the expansion plan goes according to plan and new hospitals start contribution positively to margins within the expected breakeven timelines. This is not a blue sky scenario: we do not factor in potential upside for inorganic opportunities and/or gains from expansion plans in India/China (which in theory could be significant and remains one of the key priorities for management).
Summary view: Still in the early stages of a multi-year growth opportunity
Addressing concerns about Turkey exposure
There have been increasing concerns about IHH's exposure to Turkey given the macro uncertainties. We believe the risks are limited given:
■ Acibadem is focussed on the premium segment, which continues to be very resilient despite the recent political and macro uncertainties. Acibadem sees a very low percentage of patients under the government subsidy scheme.
■ Less than 10% of revenues coming from medical tourists acts as a natural cash flow hedge. While the patients are billed in Lyra, many overseas patients pay using foreign currency bills, which is retained by Acibadem. Along with the US$95 mn cash in USD, the ongoing medical tourism payments should help Acibadem service the semi-annual debt amortisations.
■ Given the high core inflation, hospitals have been able to pass on the higher costs through price increases (especially in the non-elastic premium segment).
■ Given the ramp up of new hospitals and underlying demand growth, the underlying revenue growth has been strong enough to offset the translation impact of a weaker Lyra at the group level.
Figure 40: IHH—hospital expansion pipeline
Hospital Type Beds capacity Construction Target completion
Malaysia
Pantai Hospital Kuala Lumpur Expansion 120 In progress 4Q14
Pantai Hospital Manjung Greenfield 100 Completed Completed
Pantai Hospital Klang Expansion 80 Planning 2015
Gleneagles Kota Kinabalu Greenfield 250 In progress Early 2015
Gleneagles Kuala Lumpur Expansion 100 In progress End 2014
Gleneagles Medini Greenfield 150 In progress Early 2015
Turkey
Acibadem Bodrum Expansion 110 In progress Late 2014
Acibadem Sistina Skopje Expansion 81 In progress 2014
Acibadem Maslak Expansion 200 2014 2015
Acibadem Taksim Brownfield In progress 2015
Acibadem Altunizade Greenfield 2014 2015
Acibadem Atakent Brownfield 278 Completed Opened 2nd Jan 14
Acibadem Avanos Medical Cener Expansion 10 Completed Apr-13
Acibadem Kartal Greenfield 120 Planning TBA
Acibadem Atasehir Greenfield 180 Planning TBA
International
Shanghai international Medical Zone Consultancy, HMA 450 Completed Late 2014
City International Hospital Ho Chi Minh Consultancy, HMA 320 Completed Completed
Appollo Gleneagles Kolkata Expansion JV 85 Upgrading TBA
Gleneagles Khubchandani Mumbai Greenfield JV (50%) 450 In progress End 2014
GM Modi New Delhi Consultancy 300 Planning TBA
Danat Al Emarat Hospital Consultancy, HMA 127 In progress 2H14
Gleneagles Hong Kong Hospital Greenfield subsi (60%) 500 Planning Late 2016
Bangkok Dusit Medical Services
Figure 41: CS 2018E scenario analysis
2012 2013 2014E 2015E 2018E '13-18E CAGR
(Bt mn) Bear Base Bull Bear Base Bull
Revenues 45,478 50,615 56,328 64,947 82,133 88,671 95,809 10.2 11.9 13.6
Operating expenses 35,257 40,281 44,910 51,512 64,547 68,125 72,262 9.9 11.1 12.4
CS EBITDA 10,221 10,334 11,418 13,435 17,586 20,546 23,547 11.2 14.7 17.9
Net profit 5,754 6,002 6,732 8,290 11,739 14,027 16,346 14.4 18.5 22.2
Key assumptions
No of hospitals 29 32 38 43 45 45 45
No. of operational beds 4,285 4,652 5,015 5,604 6,649 6,649 6,649
Utilization rate (%) 69% 66% 66% 66% 63% 67% 71%
Key ratios (%)
EBITDA margin 22.5% 20.4% 20.3% 20.7% 21% 23% 25%
Net margin 17.3% 12.4% 12.0% 12.8% 14% 16% 17%
ROE 16.7 15.5 15.8 17.7 17.9 21.0 24.1
Source: Credit Suisse estimates
Summary of management targets by 2018 and key risks
At the beginning of 2013, BGH management announced a very ambitious plan to raise the number of hospitals in its portfolio to 50 by 2015 (from 29 then) through both M&A and greenfield projects. It has since announced 12 new projects, which should take number of hospitals to over 40 when all are launched by 2015. Given the higher-than-expected cost pressure associated with aggressive expansion, however, BGH has announced it would scale back the pace of the expansion and focus on improving margin.
CS 2018E scenario analysis: Base case
We thus forecast BGH would likely add another four hospitals, taking the number of hospitals to 45 (rather than 50). This would raise BGH’s number of operation beds from 4,285 in 2012 to 6,649 by 2018. A less aggressive expansion pace should allow BGH to lower cost pressure and gradually bring the margin back to 23.2% by 2018 from 20.4% in 2013 (the highest EBITDA margin achieved since 2000 was 23.1% in 2006). The expansion should allow BGH to generate an attractive five-year profit CAGR of 18.5% and improve its ROE from 15.5% in 2013 to 21% by 2018.
CS 2018E scenario analysis: Bear case
We believe the greatest risk is on utilisation rate and margin. Should demand growth be slower than expected, BGH will achieve only 62.8% bed utilisation rate in 2018 compared with 66.6% under our base case. This also implies risk to margin due to high fixed cost of hospital operation. We see risk of EBITDA margin falling to 21.4% (base case 23.2%), driving net profit 16% below our base case estimate.
CS 2018E scenario analysis: Bull case
In a positive case, where demand turns out to be higher than our forecast, we see potential that bed utilisation could rise to 71%, thereby expanding EBITDA margin to 24.6% due to greater economy of scales. In this scenario, net profit could rise 17% above our base case forecast.
Summary view: Attractive investment in the long-term
Bumrungrad Hospital
Figure 42: CS 2018E scenario analysis
2012 2013 2014E 2015E 2019E '13-19E CAGR
(Bt mn) Bear Base Bull Bear Base Bull
Revenues 12,983 14,346 15,538 17,846 29,503 31,906 34,109 12.8 14.3 15.5
Operating expenses 9,828 10,481 11,416 12,857 21,741 22,921 23,977 12.9 13.9 14.8
CS EBITDA 3,155 3,865 4,122 4,990 7,762 8,985 10,131 12.3 15.1 17.4
Net profit 1,840 2,477 2,678 3,363 5,156 6,145 7,071 13.0 16.3 19.1
Key assumptions
No of hospitals 1 1 1 1 2 2 2
No. of operational beds 484 505 560 560 810 810 810
Utilization rate 78% 73% 68% 73% 65% 69% 73%
Key ratios (%)
EBITDA margin 24.3% 26.9% 26.5% 28.0% 26% 28% 30%
Net margin 14.2% 17.3% 17.2% 18.8% 17% 19% 21%
ROE 24.3 27.5 26.1 28.3 25.0 29.1 32.7
Source: Credit Suisse estimates
Summary of management targets by 2019 and key risks
BH is a more conservative company compared with BGH. Its strategy is to focus on Bangkok’s high-end healthcare market where it commands a leadership. It plans to build the second campus not far away from the existing hospital. The completion is scheduled for 2017. This together with debottlenecking at the existing campus would raise the number of operational beds to 810 in 2019 from 484 in 2012. We do not see any
significant risk for the expansion given the land has been acquired and construction design completed (BH is now waiting for EIA approval, which should be granted within 2Q14). CS 2019E scenario analysis: Base case
Given the limited competition in the high-end healthcare market (due to shortage of doctors) and steady demand growth in medical tourism, we forecast BH to achieve bed utilisation of 69% by 2019 (the third year of the new campus). With improved bargaining power over suppliers (medical equipment, drugs) and greater economies of scale, we forecast its EBITDA margin to rise to 28.2% by 2019 from 26.9% in 2013, driving a six-year profit CAGR of 16% and lifting ROE to 29.1% (from 27.5% in 2013).
CS 2019E scenario analysis: Bear case
In our view, the highest risk to BH is in the medical tourism business which accounts for around 20-25% of total revenue. If Thailand lost market share to other countries such as India or the Philippines which offer much cheaper costs, we do see risk of bed utilisation rate falling to 65% (from 69% under our base case). This would drive 2019E profit 16% below our forecast, with EBITDA margin falling by 2%.
CS 2019E scenario analysis: Bull case
In the positive scenario, we see bed utilisation rate increase to 73.4% by 2019, expanding EIBTDA margin by 1.5% and driving our 2019E profit 15% above our base case forecast. Faster increase in affluence in Bangkok could materialise this scenario.
Summary view: Our top pick in the Thai healthcare sector
Raffles Medical Group
Figure 43: CS 2018E scenario analysis
2012 2013 2014E 2015E 2018E '13-18E CAGR
(S$ mn) Bear Base Bull Bear Base Bull
Revenues 316 345 381 424 564 645 733 10.3 13.3 16.3
Operating expenses -241 -263 -288 -322
CS EBITDA 74 82 93 103 124 161 198 8.6 14.4 19.2
Net profit 57 65 73 82 96 123 161 8.3 13.7 20.1
Key assumptions
No. of operational beds 200 200 200 200 300 350 0.0 8.4 11.8
Key ratios (%)
EBITDA margin 23.5% 23.8% 24.4% 24.2% 22% 25% 27%
Net margin 18.0% 18.7% 19.2% 19.3% 17% 19% 22%
ROE 15.7 15.0 14.5 14.1
Source: Credit Suisse estimates
Summary of management targets by 2018 and key risks
The company has embarked on multiple growth avenues over the next few years:
■ Raffle Hospital expansion: Expected to be completed by 1H16, the expansion plans provide more than 200,000 sq ft of space to add more beds, new specialities and research facilities.
■ Specialist centres: Apart from the planned Holland Village specialist (expected to be completed by 2016), Raffles continues to be on the lookout for new locations along the Orchard Road belt for new opportunities.
■ China plans: While still in early stages, Raffles could potentially enter into greenfield JV opportunities in China—although the contribution is expected to be small initially. CS 2018E scenario analysis: Base case
We expect the Raffles Hospital expansion and the Holland Village specialist centre to achieve stable state contribution levels by 2018. We expect 100 new beds to be added by 2018. We do not factor in significant contributions from China given the lack of visibility and potentially only a minority stake for Raffles.
CS 2018E scenario analysis: Bear case
Under this scenario, we factor zero new bed additions to the hospital expansion and zero contribution from China. The net incremental growth could be mainly from the rental income from Raffles hospital expansion and the new specialist centre.
CS 2018E scenario analysis: Bull case
Under this scenario we assume 150 new bed additions, better patient mix driven by the specialist centres and decent contribution from the China ventures. This scenario assumes sustained improvement in volumes as well as margins.
Summary view: Solid franchise, but relatively less favourable growth environment
KPJ Healthcare Bhd
Figure 44: CS 2018E scenario analysis
2012 2013 2014E 2015E 2018E '13-18E CAGR
(RM mn) Bear Base Bull Bear Base Bull
Revenues 2,128 2,358 2,610 2,907 3,365 3,869 4,421 7.4 10.4 13.4
Operating expenses -1,880 -2,147 -2,380 -2,638
CS EBITDA 248 210 230 269 337 426 575 9.8 15.1 22.3
Net profit 140 103 109 129 135 193 265 5.6 13.5 20.9
Key assumptions
No. of hospitals 21 23 26 28 30 30 30
No. of operational beds 2,581 2,731 2,931 3,101 3,500 4,000 4,500 5.1 7.9 10.5
Key ratios (%)
EBITDA margin 11.7% 8.9% 8.8% 9.2% 10% 11% 13%
Net margin 6.6% 4.3% 4.2% 4.4% 4% 5% 6%
ROE 14.5 9.6 9.4 10.1
Source: Credit Suisse estimates
Summary of management targets by 2018 and key risks
KPJ plans to add 6-8 new hospitals to its network during FY14-16. 2014 will see three hospitals—Muar and Sabah (greenfield, initially planned for 2013; construction completed, waiting for approvals) and Rawang (brownfield, bought a newly constructed hospital). 2015 will see two new hospitals—Perlis and Pahang (have missed earlier targets due to construction delays). 2016 will see three new hospitals—Klang, Miri and BDO (all three still in planning stage). No new brownfield projects planned near term.
CS 2018E scenario analysis: Base case
We expect KPJ's network to expand to 30 hospitals with roughly 4,000 operational beds, mostly delivering on the promised pipeline. We expect only a slight increase in margin as we factor in a longer breakeven period for greenfield hospitals.
CS 2018E scenario analysis: Bear case
We expect KPJ's network to expand to 30 hospitals with roughly 3,500 operational beds, with KPJ delivering on the expected number of hospitals but the ramp-up taking longer than expected. This will have an adverse impact on both top line growth and margin profile. CS 2018E scenario analysis: Bull case
We expect KPJ's network to expand to 30 hospitals with roughly 4,500 operational beds, delivering on the promised pipeline as well as the ramp-up of new hospitals. This builds in a better top line growth as well as better margins. There is also a potential optionality with new brownfield projects, but is not factored into our estimates.
Summary view: Attractive medium-term growth outlook but management needs to deliver on execution
Figure 45: KPJ—hospital network and pipeline
Licensed Operational
Hospital Location beds beds
Existing network
1 KPJ Tawakkal Specialist KL 191 163
2 Sentosa Medical Centre KL 212 134
3 KPJ Ampang Puteri Specialist Ampang, Selangor 230 210
4 KPJ Damansara Specialist Petaling Jaya, Selangor 155 195
5 KPJ Selangor Specialist Shah Alam, Selangor 180 168
6 KPJ Kajang Specialist Kajang, Selangor 68 132
7 KPJ Klang Specialist Klang, Selangor 220 45
8 KPJ Johor JB, Johor 213 207
9 Puteri Specialist JB, Johor 150 155
10 Kluang Utama Specialist Kluang, Johor 40 45
11 Taiping Medical Centre Taiping, Perak 48 48
12 KPJ Ipoh Ipoh, Perak 260 275
13 Damai Specialist KK, Sabah 48 46
14 Sabah Medical Centre KK, Sabah 178 46
15 Kuching Specialist Kuching, Sarawak 75 67
16 Sibu Specialist Sibu, Sarawak 35 34
17 KPJ Seremban Specialist Seremban, Negeri Semblian 109 134
18 KPJ Perdana Specialist Kota Bharu, Kelantan 83 105
19 KPJ Penang Specialist Bukit Mertajam, Pulau Pinang 136 168
20 Kedah Medical centre Alor Setar, Kedah 106 132
21 Kuantan Specialist Kuantan, Pahang 81 72
22 KPJ Pasir Gudang Specialist Hospital 120 60
Pipeline
1 KPJ Sabah Specialist Hospital Sabah 250 80
2 KPJ Muar Specialist Johor 120 43
3 KPJ Pahang Specialist Hospital Pahang 154 120
4 KPJ Bandar Dato Onn Specialist HospitJohor 390 150
5 KPJ Perlis Specialist Perlis 90 60
6 KPJ Klang Bayu Emas Specialist HospSelangor
7 KPJ Miri Specialist Hospital Sarawak