Module-scale simulation of forward osmosis module-part B:
Modified Spiral-Wound
Muhammad Roil Bilad *
Department of Chemical Engineering, University Teknologi PETRONAS, Bandar Seri Iskandar, Perak 32610, Malaysia.
*Correspondence: [email protected]; Tel.: +605368 7579
A B S T R A C T S A R T I C L E I N F O
Forward osmosis (FO) is an attractive technology that offers advantages especially for treatment of challenging feeds in comparison to other membrane technologies. Substantial developments of membrane material have been shown recently. To support further development of FO process, a larger scale study via membrane module development is required to accurately envisage the most critical factors to be exploited to realize the promises. In this study, we applied a mass-transfer model coupled with the mass conservation and area discretization to simulate the performance of modified spiral-wound (MSW) modules (10 sheets of 1x1m). The study focuses on the spatial flux profile in a full-scale module as function of operational mode: co- vs counter cross current and membrane orientations (active-layer facing feed (ALFS); solution and active layer facing draw solution, (ALDS)). Results show that all modes offer almost similar average flux of about 9-10 L/m2h, but the co-current flows
ha e u h higher flux ra ges ≈ % . The latter is expe ted
to worsen membrane fouling resistant due to mal distribution in hydraulic loading. An operation with counter current and ALFS and counter current flow is then recommended because it offer similar flux but lower spatial flux ranges (7%).
© 2017 Tim Pengembang Journal UPI
Article History:
Received 03 Jul 2017 Revised 30 Jul 2017 Accepted 29 Aug 2017 Available online 01 Sep 2017 ____________________
Keyword:
Forward osmosis, Module design,
Modified spiral wound module, Concentration polarization, Dilution effect.
Indonesian Journal of Science & Technology
1. INTRODUCTION osmotic pressure difference between both solutions. A selectively permeable membrane allows passage of water while rejecting the rests. (Bilad et al., 2016; Bilad et al, 2017; Sulastri & Rahmidar, 2016)
FO is promising technology that offers many advantages. Its fouling propensity is claimed to be modest and highly reversible (Achilli et al., 2009; Lee et al., 2010; Mi et al., 2010). It only requires hydraulic pressure for pumping/circulation thus requires low operational energy. FO has shown effective for isolation of emerging contaminants in wastewater that often bypassing all treatments and eventually accumulate in the water bodies (Cartinella et al., 2006; Cath et al., 2010).
A great deal of research has been directed for FO membrane development aimed for lowering the membrane support structural parameters (S), increasing water permeability coefficient (A). Another aspect of research is on selection of effective draw solute and yet energy efficient for its recovery (Zhao et al., 2012; Cath et al., 2006; Klaysom et al., 2013). These efforts have resulted in improved FO membranes, such as thin film composite FO (Yip et al., 2010) and aquaporin-based biomimetic ( Li, et al., 2015).
Recent focus of FO research has also expands toward module-scale performance analyses (Deshmukh et al., 2015; Bilad, 2016). It is also highlighted that a convenient and consistent methodology to characterize FO membranes is of critical importance (Tiraferri et al. 2013; Bui 2015). To support further progression for FO process development, a larger scale
performance modelling is required. Module-scale assessment clearly demonstrates draw dilution effects that is often ignored in lab-scale assessments.
By taking into account the membrane properties, operational parameters and the occurrence of CPs, many mass-transfer models have been developed (Klaysom et al. 2013). Those models correlate well with coupon-scale experiments, and also have been used simulation of large-scale module performances, (Jung et al., 2011; Gruber et al., 2011; Lee et al.,
2014; Xu et al., 2010; Attarde et al., 2015). However, those studies assume homogeneous flow and concentration of solute of feed and draw solutions, which has proven inaccurate because spatial distribution of flows (Gruber et al., 2011), let alone the complexity of flows in a module. The effect is more pronounced for the modified spiral wound (MSF) module due to the
ature of U-shaped flo i side the e ra e envelope.
As continuation of earlier works (Bilad et al, 2016), this study applies a mass-transfer model coupled with the mass conservation to simulate the performance of large-scale MSW modules. The applied model accounts the effect of the external and internal concentration as well as reverse salt diffusion (Bui, 2015), while the mass conservation accommodates the concentration (of feed stream) and dilution (of draw stream) effects. Different possible operational parameters were simulated: modes (active layer facing feed solution, ALFS; and active layer facing draw solution, ALDS), flow orientations (co-cross-current and counter-cross-current).
2. THEORY
2.1. Mass-transport Model
Water (Jw, L/m2h) and salt fluxes (Js,
g/m2h) in a module were calculated by
characteristics and operational parameters coefficient (L/m2hbar), solute permeability
coefficient (m/s) and structural parameter (m), respectively. Because of the small impact of Js (very low B), its contribution in defining module performance is neglected. This study only considers Jw for judging module performance.
The os oti pressure, ar a d D
(diffusion coefficient, m2/s) are function of
solute concentrations (C, molar). The values of and D was obtained from empirical Eqs. 5 and 6(Phuntsho et al., 2014), when using NaCl as the solute and at constant temperature of 25oC. The equations were
derived using OLI Stream Analyser 3.2. � = . + . + . (5)
= (− . � − ) + . � − (6)
The mass transfer coefficient (k, m/s) can be calculated as
� = �
� (7)
where Sh is Sherwood number (-) and dh
hydraulic diameter (m). For a flat channel, dh
is defined as:
�= �+� (8)
where b is flow channel width (m) and
h flow channel height (m). The flow channel height is equal to spacer thickness.
The Sh for laminar flow is defined as in
2.2 Flow and Membrane Orientations
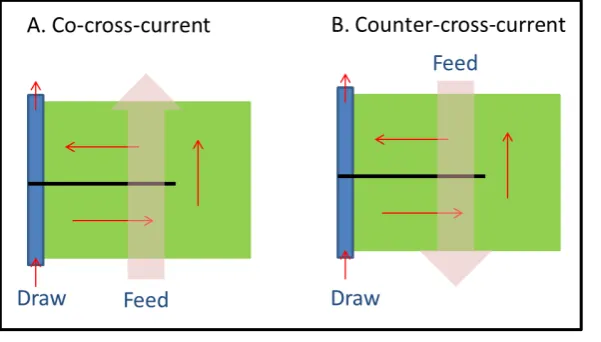
Four possible flow orientations to run and construct MSF module are illustrated in
Figure 1. The FO can be operated in ALFS and ALDS mode, and the flow orientation is defined as relative direction of feed and draw solutions entering the module. Co-cross-current is when feed and draw solutions enter the module from the same side, and vice versa for the counter-cross-current. In our simulation, feed solution always flows outside of the membrane envelope, vice versa because of membrane fouling and membrane cleaning consideration.
2.3 Numerical Modeling of FO Module
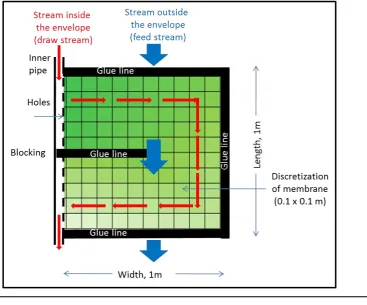
Because of the large area of a module element, the solute concentrations in the feed and draw solution change as a function of location (spatial distribution). Therefore, the draw solute and feed concentration cannot be assumed constant. To solve this situation, area discretization was implemented (Figure 2) by splitting the area into smaller cells. The active membrane surface area of 1 m2 (1 m x 1 m) in a module
was split into a hundred of 0.01 m2 cells (0.1
m x 0.1 m). Within those 0.001 m2 cells, that
the solute concentrations within them are
assumed constant (the effect of draw dilution and feed concentration are neglected). All simulations in this study also assume a static condition in a steady state operation without considering membrane fouling (dynamic condition) or build-up condition (transient).
The concentration of solute over different cells affects each other because the feed and draw stream are coming into the cell either from the inlet or from other cell. To unravel the flow relations between cells, the flow is assumed to have only one dominant direction, either toward length or width, depending on cells locations and flow orientations. One direction flow means that the outlet of the first cell becomes the inlet of the second cell, and so on. Fluid enters from one side and exits through the opposite side of the cell, without spreading to another surrounding cells. The inlet of the first cells row is from the module inlet, the inlet of the next cell is from the outlet of the previous cell, while the outlet of the last cells is directly exit from module (see arrows in
Figure 2). The mass-transport equations in
Eqs. 1-2 or 3-4 were solved simultaneously for each cell, in which the results of one cell become the input for solving the following cells.
Parameters (unit) value
Membrane parameters (HTI)
Pure water permeability coefficient, A (L/m2h bar) 1.02
Salt permeability coefficient, B (L/h) Structural parameters, S (µm)
0.464 400 Module dimensions
Flow channel height (m) 1.14 x 10⁻³
Net length (m) 1 x 10⁻³
Net width (m) 1 x 10⁻³
Membrane sheet 10
Total module area (m2) 10
Feed and draw solution
Feed solute (gNaCl/L) 100
Feed solution flow rate (m3/h) 1
Draw solute (gNaCl/L) 36
Draw solution flow rate (m3/h) 0.34
Figure 2. Schematic diagram of flows and area discretization. The arrows show general directions of the flow. Notice that the flow inside the envelope has three directions: along the module, then crossing the module and reversing
a k to for a U’ shape flow.
2.3 Simulation Parameters
The geometry of module was assumed to be 1x1 m stacked in 10 sheets per element with the default flow channel height of 1.14 mm (equal to the spacer thickness). The applied membrane properties and operational parameters are summarized in
Table 1.
The membrane sheet was arranged in combined flow mode in which a stream of feed is in contact with two membrane sheets. The same is applied to the stream of the draw inside the envelope. The simulation was only performed for the middle sheet in the 10-sheets module, because the two last channels under this module arrangement only in contact with one membrane sheet.
3. PARAMETERS IN MEMBRANE PROCESS
3.1 Effect membrane orientation: ALFS vs ALDS
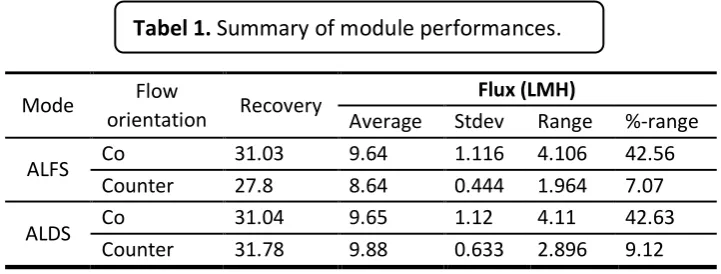
ALDS mode shows slightly higher average flux than the ALFS one (Figure 3 and 4 and Table 2). The flux values are inline with the results of the water recovery. A clear
advantage is shown by the counter-cross-current flow orientation. However, the magnitude of flux advantage is not as high as reported elsewhere (Jung et al., 2011; Phuntsho et al., 2014; Gu et al., 2011; Bilad, 2016). For the corresponding flow orientation, the spatial flux ranges are about the same.
A mall effect of membrane orientation found in this study suggests that high flux offered by ALDS-mode under coupon size test is depleted by the draw dilution and feed concentration effect when evaluated in a full scale module. A module recovery of about 30% means that at the last cells, the concentration of solute in the draw remains only 53 g/L (as opposed to 100 g/L in the entrance), and the solute concentration in outlet of the last cell is 51.47 g/L (as opposed to 36 g/L in the entrance). This means that the dilution and concentration effect substantially diminish the driving force of the transport. Under this circumstances, the LADS mode will only give substantial advantages under operation with low recovery, something undesirable because of low productivity.
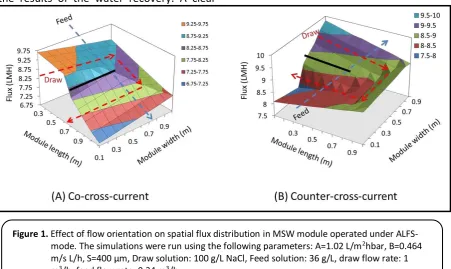
Figure 1. Effect of flow orientation on spatial flux distribution in MSW module operated under ALFS-mode. The simulations were run using the following parameters: A=1.02 L/m2hbar, B=0.464
Mode Flow
3.2 Effect of flow orientation: co- vs counter -cross -current
The co-cross current flow orientation shows higher average flux under ALFS mode but slightly lower under ALDS mode (Table 2). The advantage of co-cross current coming from high flux near the module entrance where the fresh feed and fresh draw solution meet. The area on the module entrance exhibit the highest driving force. However, as in the case of the membrane orientation, the initial advantage of high flux near the module entrance is diminished by the low flow near the module outlet leading to minimum overall average flux advantage.
Remarkable different on the flux range is observed between the two flow orientations. A larger flux span (defined as the difference between maximum and minimum flux) is shown by the co-cross-current flow being about 43 and 7-9% for the co- and counter-cross-current, respectively. A high flux range is less desirable because spatial flux distribution is known to promote membrane fouling (Lee J., 2014).
The large flux-span for the co- originates from the solute concentration of contacting feed and draw solution (notice arrows for feed and draw in Figures 3 and 4. For the co-cross-current, the fresh draw (highest solute concentration) is in contact with the fresh feed (the lowest solute concentration) in within the module entrance. This leads to the highest possible driving forces. Because of draw dilution and the feed concentration
effects, the driving force is reduced toward the outlet of the module resulting in the lowest flux nearby the module exit. For the counter-cross-current, the fresh draw is in indirect contact with the diluted feed leading a relatively lower highest flux in comparison to the co-cross-current.
Despite significant difference on the flux
ra ge ≈ % for ou ter- urre t a d ≈ % for co- and counter-cross-current), the average fluxes of different flow orientations are relatively close, unlike the one reported elsewhere (Phuntsho et al., 2014). The deviation on the finding with the aforecited literature is due to the size of the simulated module surface area. This study only applies 10 m2 area, while they simulated up to 170
m2 Membrane area. Their plot between
module are and the flux also shows no significant different on flux at membrane area of 10 m2. The smaller the module is the
lesser the effect of flow orientation.
3.3 Membrane fouling aspect
Large spatial distribution of fluxes can worsen membrane fouling propensity because of mal-distribution of hydraulic load. Moreover, as widely accepted in literature, ALDS also pose higher membrane fouling propensity than the ALFS. Therefore by considering minimum advantage of ALDS mode and large span of fluxes in the co-cross-current flow orientation, it is recommended o operate the system under ALFS mode and using counter-cross-current flow orientation.
Fouling management can also be done in operational level. To avoid overload of near one particular module entrance, the draw feed solution entrances can be switch periodically to balance the hydraulic between them. This leaves most membrane area experience the same load. The period of switching can further be optimized during the commissioning process to accurately capture fouling propensity of the treated feed. Practically, the switch can be done in between clean-in-place process.
4. CONCLUSIONS
This study explore the impact of membrane and flow orientation on the performance of MSF module through full-scale module simulation. ALDS mode offer slightly higher flux and the small gain of flux was reduced due to draw solute dilution and feed solute concentration effects.
Counter-current flow orientation offers lower spatial flux distribution that is very important, in particular, to distribute filtration loads and thus minimizes its consequence on membrane fouling. Membrane fouling can be managed under operational level by periodically switching draw solution entrance to the module.
5. ACKNOWLEDGMENTS
Author acknowledge Universiti Teknologi PETRONAS for providing facilities for conducting the research activities.
6. AUTHORS’ NOTE
The author(s) declare(s) that there is no conflict of interest regarding the publication of this article. Authors confirmed that the data and the paper are free of plagiarism.
REFERENCES
A hilli, A., Cath, T. Y., Mar ha d, E. A., & Childress, A. E. 9 . The for ard os osis
e ra e iorea tor: a lo fouli g alter ati e to MBR
pro esses.Desalination, 9 - , - .
Attarde, D., Jain, M., Chaudhary, K., & Gupta, S. K. (2015). Osmotically driven membrane processes by using a spiral wound module—Modeling, experimentation and numerical parameter estimation. Desalination, 361, 81-94.
Bilad, M. R. (2016). Module-Scale Simulation of Forward Osmosis Module-Part A: Plate-and-Frame. Indonesian journal of science and technology, 1(2), 249-261.
Bilad, M. R. (2017). Membrane bioreactor for domestic wastewater treatment: principles, challanges and future research directions. Indonesian Journal of Science and Technology, 2(1), 97-123.
Bui, N. N., Arena, J. T., & McCutcheon, J. R. (2015). Proper accounting of mass transfer resistances in forward osmosis: Improving the accuracy of model predictions of structural parameter. Journal of membrane science, 492, 289-302.
Cath, T. Y., Childress, A. E., & Elimelech, M. (2006). Forward osmosis: principles, applications, and recent developments. Journal of membrane science, 281(1), 70-87.
Cath, T. Y., Hancock, N. T., Lundin, C. D., Hoppe-Jones, C., & Drewes, J. E. (2010). A multi-barrier osmotic dilution process for simultaneous desalination and purification of impaired water. Journal of Membrane Science, 362(1), 417-426.
Deshmukh, A., Yip, N. Y., Lin, S., & Elimelech, M. (2015). Desalination by forward osmosis: Identifying performance limiting parameters through module-scale modeling. Journal of membrane science, 491, 159-167.
Gruber, M. F., Johnson, C. J., Tang, C. Y., Jensen, M. H., Yde, L., & Hélix-Nielsen, C. (2011). Computational fluid dynamics simulations of flow and concentration polarization in forward osmosis membrane systems. Journal of membrane science, 379(1), 488-495.
Gu, B., Kim, D. Y., Kim, J. H., & Yang, D. R. (2011). Mathematical model of flat sheet membrane modules for FO process: Plate-and-frame module and spiral-wound module. Journal of membrane science, 379(1), 403-415.
Jung, D. H., Lee, J., Lee, Y. G., Park, M., Lee, S., Yang, D. R., & Kim, J. H. (2011). Simulation of forward osmosis membrane process: Effect of membrane orientation and flow direction of feed and draw solutions. Desalination, 277(1), 83-91.
Klaysom, C., Cath, T. Y., Depuydt, T., & Vankelecom, I. F. (2013). Forward and pressure retarded osmosis: potential solutions for global challenges in energy and water supply. Chemical society reviews, 42(16), 6959-6989.
Lee, J., Kim, B., & Hong, S. (2014). Fouling distribution in forward osmosis membrane process. Journal of environmental sciences, 26(6), 1348-1354.
Lee, S., Boo, C., Elimelech, M., & Hong, S. (2010). Comparison of fouling behavior in forward osmosis (FO) and reverse osmosis (RO). Journal of Membrane Science, 365(1), 34-39.
Li, X., Chou, S., Wang, R., Shi, L., Fang, W., Chaitra, G., ... & Fane, A. G. (2015). Nature gives the best solution for desalination: Aquaporin-based hollow fiber composite membrane with superior performance. Journal of Membrane Science, 494, 68-77.
Mi, B., & Elimelech, M. (2010). Organic fouling of forward osmosis membranes: fouling reversibility and cleaning without chemical reagents. Journal of membrane science, 348(1), 337-345.
Phuntsho, S., Hong, S., Elimelech, M., & Shon, H. K. (2014). Osmotic equilibrium in the forward osmosis process: modelling, experiments and implications for process performance. Journal of membrane science, 453, 240-252.
DOI: http://dx.doi.org/10.17509/ijost.v1i2
DOI: http://dx.doi.org/10.17509/ijost.v2i2
p- ISSN 2528-1410 e- ISSN 2527-8045
Tiraferri, A., Yip, N. Y., Straub, A. P., Castrillon, S. R. V., & Elimelech, M. (2013). A method for the simultaneous determination of transport and structural parameters of forward osmosis membranes. Journal of membrane science, 444, 523-538.
Xu, Y., Peng, X., Tang, C. Y., Fu, Q. S., & Nie, S. (2010). Effect of draw solution concentration and operating conditions on forward osmosis and pressure retarded osmosis performance in a spiral wound module. Journal of Membrane Science, 348(1), 298-309.
Yip, N. Y., Tiraferri, A., Phillip, W. A., Schiffman, J. D., & Elimelech, M. (2010). High performance thin-film composite forward osmosis membrane. Environmental science and technology, 44(10), 3812-3818.