75
Aceh International Journal of Science and Technology
ISSN: 2088-9860 eISSN: 2503-2348Journal homepage: http://jurnal.unsyiah.ac.id/aijst
Analysis of Soil Quality for Hydrological Disaster Mitigation in
Sub-Watershed of Krueng Jreue, Aceh Besar Regency-Indonesia
Helmi
1,2*, Hairul Basri
3, Sufardi
4, Helmi
51Doctoral Study Program of Agricultural Sciences Unsyiah, Tgk. Chik Pante Kulu Street, Darussalam,
Banda Aceh 23111 (Indonesia)
2College of Forestry Tengku Chik Pante Kulu, 23111 Darussalam Banda Aceh (Indonesia) 3,4,5 Faculty of Agriculture of Syiah Kuala University, Tgk. Hasan Krueng Kalee Street No. 3 Darussalam,
Banda Aceh 23111 (Indonesia) * Corresponding Author: [email protected]
Received : December 14, 2016 Accepted : August 29, 2017
Online : August 29, 2017
Abstract – Land conversion of forest to non-forest has led to a reduction in soil fertility, exhibited by a lower soil quality index value (SQI) in the Sub-Watershed of Krueng Jreue. This study aimed to determine soil quality associated with various land uses using the SQI value approach. SQI is calculated based on the criteria proposed by Mausbach & Seybold (1998), which is suitable for field conditions using analysis of Minimum Data Set (MDS). The parameters analyzed include rooting depth, soil texture, bulk density, total porosity, pH of the soil, C-organic, N-total, P-available, K-exchangeable and soil respiration. The result showed that the quality criteria of the soil in the study area consists of three classes, namely: low, medium and high, which have soil quality index values of 0.27, 0.52, and 0.64 respectively. Based on the study’s soil quality criteria, the area of research was mapped accordingly by class: (1) high, covering an area of 14016.98 ha (60.38%); (2) medium, covering an area of 8542,90 ha (36.79%); and low, covering an area of 658,18 ha (2.83%). Types of land use categorized as having high quality, were primary forest, secondary forest and residential area with respective values of 0.66; 0.64, and 0.63. Open land, grassland, moor, rice field and shrubs were of medium quality, with respective values of 0.47; 0.48; 0.52; 0.51 and 0.55. The main and additional components affecting the hydrological disaster vulnerability on soil quality parameters are land use change, and soil properties. The findings of this research have implications structural efforts to mitigate hydrological disasters (dams, catchment wells, biopori, tillage conservation, terracing), and non-structural efforts (maps of soil quality, agroforestry, cover crops, materials of soil conditioner, organic matter). These efforts are necessary to improve and maintain soil quality longitudinally.
Keyword: Soil quality, Soil quality index, Land use, Hydrological disaster mitigation, Sub-Watershed of Krueng Jreue.
Introduction
Human activity has put great stress on the Sub-Watershed of Krueng Jreue of the Krueng Aceh Watershed. The high rate of population growth and the increase of land-based activities has led to changes in land use in the Sub-Watershed of Krueng Jreue. According to Ministerial Decree No. 328/2009, Krueng Aceh was a critical watershed and designated as a priority watershed.
76
from 0.24 to 3.22 m sec-1, while the total amount of water demand for agriculture and households ranges
from 0.18 to 6.44 m sec-1 (Isnin et al., 2012).
The resources of the Sub-Watershed of Krueng Jreue should be managed sustainably by identifying the links between land issues and hydrology and the relationship between the upstream-downstream regions which interconnected and affect the unit watershed ecosystem. One approach to improve the management and land use systems in the region is through the evaluation of soil quality (Rahmanipour et al., 2014). Soil quality can determine the productivity of plants, animals and the quality of the environment over a long period (Wander et al., 2002). The evaluation of soil quality is important to optimize the production and conservation of natural resources (Shahab et al., 2013) and can serve as a tool for agricultural managers and policymakers to gain a better understanding of how the agricultural system can affect soil resources (Dong et al., 2013).
Land and water resources relate to the hydrologic cycle. Climate change has influenced changing in the hydrologic cycle (Tallaksen et al., 2009), such as floods and drought as a hydrological disaster. Hydrologic disasters cannot be avoided, but with the development of science and technologically supported, accurate data, they can be anticipated to minimize associated losses and environmental damage. Early warning, a non-structural tool implemented in developing countries (Jayawardena, 2015), is a major factor in disaster risk reduction and it is necessary in order to anticipate the occurrence of a hydrological disaster and thus minimize losses with disaster preparedness (Bokal et al., 2014; Irham, 2016).
In order to prepare for potential disaster, it is important to understand the characteristics of the region and its response to changes in the hydrological cycle due to climate change (Van Huijgevoort et al., 2014). Including Sub-Watershed of Krueng Jreue, it is an important information in planning, territory management and early anticipation of the negative effects and the risk of damage in a hydrological disaster, both in the short and long term.
According to the above problems, it is necessary to carry out research to analyze the causes of the disaster that may occur in the sub-watershed based on biophysical aspects. This study aimed to analyze the quality of the soil with an soil quality index (SQI) approach based on the criteria of Mausbach and Seybold, 1998 (Sanchez-Navarro et al., 2015), which reveal the changes in land characteristics affecting the SQI Krueng Jreue Sub-Watershed. This research suggests mitigation efforts of hydrological disasters in the Sub-Watershed of Krueng Jreue, so that the negative impacts and risks of flood and drought damage can be minimized.
Materials and Methods
The research was conducted in Watershed of Krueng Aceh, in the Sub-Watershed of Krueng Jreue. Administratively, it is part of the Aceh Besar Regency, with coordinates of 5o 12'-5o 28' N and 95o 20'-
95o32' E and an area of 23218.06 ha. This research was conducted from November 2015 to January 2016.
The materials used include administrative maps, maps of soil type, slope maps, land use maps, soil map units with a scale of 1:50.000, and chemical compounds for analysis of physical and chemical properties. The tools used were a GPS unit, altimeter, ground drill, Munsell Soil Color Chart, meter, pH meter, digital camera, bag and ring samples, hoes, spades, knives, and tools for analysis of physical and chemical properties.
The research was conducted using a descriptive method, field survey, and analysis in the laboratory. The results were obtained by performing several analysis stages, including: (1) the analysis of soil properties as indicators of soil; (2) analysis of soil quality index based on criteria from Mausbach and Seybold (1998); and (3) the analysis of soil quality based on land quality index values of each unit of land mapping unit (LMU) and land use.
Soil analysis includes: (1) physical properties of the soil: soil texture, bulk density, and total porosity; (2) chemical properties of the soil: pH, C-organic, N-total, P-available and K-exchangeable; and (3) biological properties of soil: soil respiration. Components, parameters, and methods of soil analysis are shown in Table 1.
The results of the soil analysis were arranged in a matrix and calculated based on the criteria of Mausbach and Seybold (1998), which was modified in accordance with the conditions of the land. Modifications were carried out on some aspects, namely:
(1) The indicator of C-total is replaced by C-organic, with consideration of levels of C-organic soil that were not significantly different than levels of C-total, because the soil does not contain CaCO3 as a
77
(2) The indicator of aggregate stability was approximated by the percentage of dust + clay. The percentage of dust + clay will determine the stability of the aggregate that plays a role in the regulatory function of humidity and as a filter and land buffer.
(3) The weight of some soil indicators were adjusted to the proficiency of soil indicators in order to improve the quality of soil in which the research took place.
(4) The upper and lower limits of several soil indicators were raised or lowered, according to land conditions and assessment criteria of physical, chemical and biological soil.
Table 1. Components, Parameters, and Methods of Soil Analysis
No. Component Parameter Unit Analysis Method
1 Physical Properties of Soil
Texture of Soil Bulk Density Total Porosity
% g cm-3
%
Pipette (Stokes Law) Ring Sample (Core Method) Gravimetry
2 Chemical
Properties of Soil
pH C-organic N-total P-available K-exchangeable
- % % mg kg-1
cmol kg-1
Electrometric 1 : 2,5 Walkley & Black Kjeldahl
Bray II
1 N NH4OAc pH 7 3 Biological
Properties of Soil
Soil Respiration mg.C
CO2kg-1
Verstraete, 1981
Source: Laboratory of Soil and Plant and Laboratory of Biological Soil, Faculty of Agriculture (2016)
The modification of the soil indicator, the weight index, and the functioning scale assessment are presented in Table 2.
Measurement steps in the calculation of soil quality index are:
(1) The weighted index is calculated by multiplying the weight of soil use which is the weight I (No. 2) with a weight II (No. 4) with a weight III (No. 5). For example, the weighted index of rooting depth is obtained by multiplying 0.4 (weight I) to 0.33 (weighted II) to 0.60 (weighted III), and the result is equal to 0.079.
(2) Scores are calculated by comparing observational data of soil indicators and function of assessment (7-10). Scores range from 0 (low condition) to 1 (high condition). Scoring through interpolation in accordance with the range specified by the data obtained.
(3) The soil quality index is calculated by multiplying the weighted index (number 6) and soil indicator score.
The determination of soil quality index (SQI) is done by referring the formula by Liu et al. (2014), as follows:
SQI = !! �����
!!
Where:
SQI
= Soil quality index
Si
= Determined indicator score
78
Table 2. The Modification of Land Indicator, The Weight Index, and Functioning Assessment Scale
Soil Function Weight
I Soil Indicator
Weight II
Weight III
Weight Index
Assessment Function Lower
Limit
Upper Limit X1 Y1 X2 Y2
1 2 3 4 5 6 7 8 9 10
Preservation of Biological Activity
0.4 Rooting Medium 0.33
Rooting Depth (cm) 0.6 0.079 5 0 180 1
Bulk Density (g cm-3) 0.4 0.053 2.1 0 1.3 1
Humidity 0.33
Total Porosity (%) 0.2 0.026 20 0 80 1
C-organic (%) 0.4 0.053 0.2 0 3 1
Dust + Clay (%) 0.4 0.053 0 0 100 1
Nutrients 0.33
pH 0.1 0.013 4 0 8 1
P-available (mg kg-1) 0.2 0.026 2.5 0 50 1
K-exchangeable
(cmol kg-1) 0.2 0.026 0.2 0 100 1
C-organic (%) 0.3 0.040 0.2 0 3 1 N-total (%) 0.2 0.026 0.2 0 5.2 1 Arrangement
and Distribution of Water
Dust + Clay (%) 0.60 0.18 0 0 100 1
0.3 Total Porosity (%) 0.20 0.06 20 0 80 1
Bulk Density (g cm-3) 0.20 0.06 2.1 0 1.3 1
Filter and Buffer
Dust + Clay (%) 0.60 0.18 0 0 100 1
0.3 Total Porosity (%) 0.10 0.03 20 0 80 1
Microbiological Process 0.30
C-organic (%) 0.33 0.030 0.2 0 3 1
N-total (%) 0.33 0.030 0.2 0 5.2 1
Soil Respiration(mgC-CO2kg-1) 0.33 0.030 0 0 20 1
Total 1.0
Source: Modification of Mausbach and Seybold (1998)
SQI data are compared to the criteria of soil quality based on the value of SQI to distinguish five classes: (1) very low, (2) low, (3) medium, (4) high, and (5) very high, shown in Table 3.
Table 3. Soil Quality Criteria Based on The SQI Value
No. SQI Value Soil Quality Criteria
1 2 3 4 5
0.00 – 0.19 0.20 – 0.39 0.40 – 0.59 0.60 – 0.79 0.80 – 1.00
Very Low Low Medium High Very High
79
Results and Discussion
Assessment of the Quality Index for Soil Functions Preservation of Biological Activity
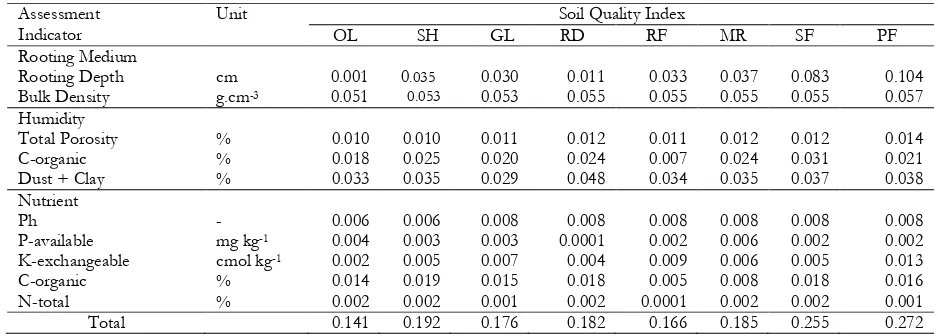
Several soil indicators support the functions of biological activity including rooting medium, humidity, and nutrients. The results of indicator analysis across the parameters of rooting medium, humidity, and nutrients show significant fluctuations. The calculation of SQI data based on the function of soil for the preservation of biological activity is listed in Table 4.
Table 4. Results of SQI Calculation Based on The Function of Land for The Preservation of Biological Activity
OL= Open Land, SH= Shrubs, GL= Grassland, RD=Residential, RF= Rice Field, MR= Moor, SF= Secondary Forest, PF= Primary Forest
Table 4 shows that the highest SQI based on preservation of biological activity is contained in the primary forest (0.272) while the lowest is found in the rice fields and in open land, with values of 0.166 and 0.141 respectively. Primary forests have high soil quality and SQI due to the content of organic matter and higher water retention when compared to other land uses (Karam et al., 2013), such as plantations and rice fields.
Arrangement and Distribution of Water
Soil as the setting for the distribution of water was assessed using the parameters clay + dust percentage, total porosity and bulk density. Indicators on some land use assessments show that the value of the difference was not significant, with a difference in clay + dust of 0.085; total porosity of 0.028; and bulk density of 0.011. The results of SQI calculations based on soil functions as regulation and distribution of water are shown in Table 5.
Table 5. The Results of SQI Calculations Based on Soil Functions as Arrangement and Distribution of Water
OL= Open Land, SH= Shrubs, GL= Grassland, RD=Residential, RF= Rice Field, MR= Moor, SF= Secondary Forest, PF= Primary Forest
80
terms of the proportion of particles in a soil mass. It can also be defined as soil texture. Soil porosity refers to the existence of spaces (connected or not) between soil particles, consisting of either water or air. Texture and bulk density have significant impacts on the rate of infiltration. The physical properties determine how much water can flow into the pore spaces in the soil surface so as to increase the rate of water infiltration. Coarse soil texture has a higher degree of infiltration, so that the capacity of sand-soil infiltration is much larger than the clay (Foth, 1990).
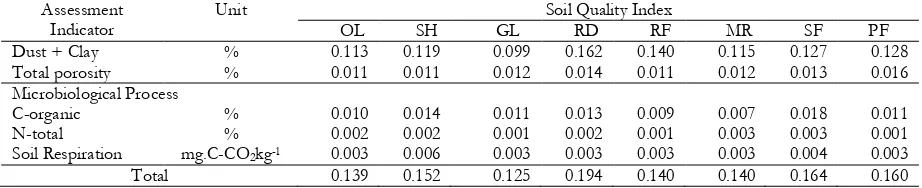
Filter and Buffer
The filter and buffer capacity of a soil can be defined by the percentage of dust + clay, total porosity, C-organic, N-total and soil respiration. Assessment indicators in some land use categories show no significant variation in the values, with a dust + clay differential of 0.063; total porosity of 0.005; C-organic of 0.014; N-total of 0.003 and soil respiration of 0.003. Results of the SQI calculation based on the function of soil as a filter and buffer are shown in Table 6.
Table 6. Results of SQI Calculation Based Soil Functions as a Filter and Buffer
Assessment
OL= Open Land. SH= Shrubs. GL= Grassland. RD=Residential. RF= Rice Field. MR= Moor. SF= Secondary Forest. PF= Primary Forest
Table 6 shows that there are no significant changes in SQI for the clay + dust indicator across the land use categories of open land, shrubs, rice field, moor, secondary forest and primary forest. However, there is a greater SQI value on grassland. The total porosity assessment indicator does not show any significant differences among each land use category. The only SQI values that exhibit change are in the C-organic and soil respiration parameters. The role of porosity is a filter in the management of soil quality. Soil porosity is controlled by soil texture, structure, and content of organic matter. Buckman and Brady (1990), the movement of water and air in the soil is determined by the parameters of soil porosity. The size of the soil porosity is determined and described by the state of the soil structure. Granular soil structure can provide adequate porosity for infiltration. C-organic and N-total play roles as a nutrient buffers. Giving of organic matter into the soil affecting soil microbes work down into energy to produce nutrients that plants need. The process of decomposition of organic material by microbes is measured by C-organic and N-total levels. Organic matter is necessary to provide nutrients and improve the cation exchange capacity (CEC) (Jien and Wang, 2013). Increased soil CEC via fertilizers can reduce the loss of nutrients, so as to improve the efficiency of fertilization (Aprile, 2012).
Soil Quality Index (SQI)
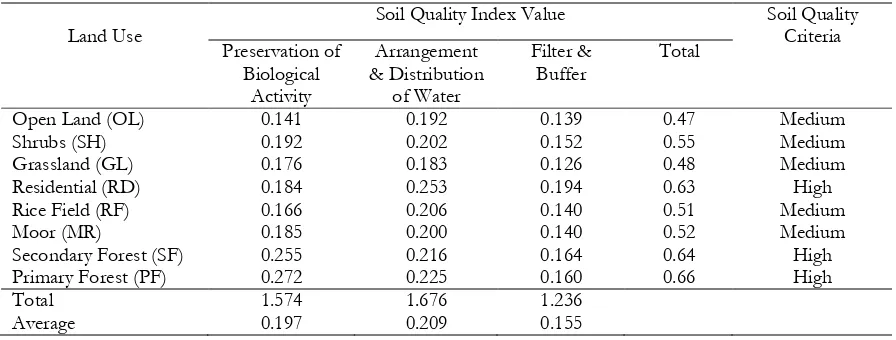
The SQI calculation is obtained by multiplying the weighted index value with the soil indicator value. Soil qualy index is further based on SQI index. The SQI value ranges from 0 to 1. As the value approaches 1, it indicates better soil quality. Soil criteria of several lands use categories at Sub-watershed Krueng Jreue are illustrated in Table 7.
81
Table 7. Soil Quality Criteria in Several Lands UsesLand Use
Soil Quality Index Value Soil Quality
Criteria
The results of SQI analysis of several lands use areas shows significant fluctuation. The highest SQI value is located in the secondary forest (0.64) and primary forest (0.66) while the lowest is in the grassland and open land with values of 0.48 and 0.47. Land openness in open land and grassland areas causes the rate of runoff, erosion, and sedimentation, as well as a decrease in soil fertility. The change in the rate of runoff is caused by the decrease of soil infiltration capacity and poor vegetation to cover the land (Dunne et al., 1991; Bergkamp, 1998). Changes in cover vegetation density causes surface runoff and erosion to increase by decreasing the soil’s resistance towards surface runoff and infiltration (Abraham et al., 1995). It is understood that the use and misuse of land determines the significance of surface runoff and soil erosion (Dunjo et al., 2004). The most significant impact is the degradation indicated by the decrease of soil quality characteristic so that it cannot be used for agricultural use.
The soil quality of forestry areas is high and needs to be kept in a well-maintained condition. Such condition is the result of dense forest with large amount of leaf litter. The surface of forest mineral soil is rich in organic material (Kaiser et al., 2016) and has better soil quality compared to grassland and vegetation (Nuria et al., 2003). Even though forestry land consists of much organic material, only a limited amount is absorbed into the soil due to the slow speed of the decaying progress of material. However, the organic material of soil is the main controlling factor of soil fertility for agriculture with low external inputs (Sitompul et al., 2000). The organic material accumulates at the soil surface and then it forms a tight layer consisting of leaf litter. This process is influenced by the micro environment in the forest, especially at the level of the soil surface. The tree canopy can limit the amount of sunlight, which in turn can discourage microbial activity in the organic recycling process. Microbial activity is an indicator of soil quality. Plants depend on organisms living beneath the soil surface in order to produce organic mineral nutrition for its growth and development (Chen et al., 2003). The forestry area is regarded as the land which has the highest soil quality due to minimum human contact.
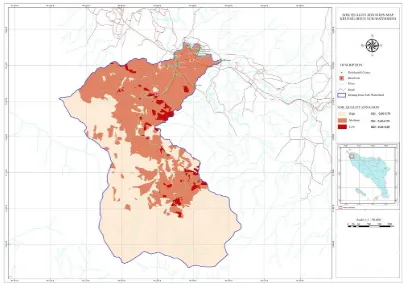
Soil Quality Zonation Map of Research Territory
The criteria of soil quality based on SQI in the research territory is divided into three classes i.e. low, medium, and high. Table 8 displays soil quality based on average value of SQI as follows.
Table 8. Soil Quality Criteria Based on Average Value of SQI
Land Mapping Unit Average Value of SQI Criteria
8
82
criteria (SQI value = 0.00-0.19) and very high criteria (SQI value = 0.80-1.00) are also found in the research spot. Detailed illustration of the three soil quality zones in the research territory is displayed in Figure 1.
Figure 1. Soil Quality Zonation Map of Krueng Jreue Sub-Watershed
Figure 1 describes the dominant soil quality criteria in the research territory including high, medium, and low zone classes. The territory which has high soil quality is found in the western and southern area of study which is dominated by residential, secondary and primary forest area. The northern and eastern part of the research territory, the soil quality is in medium category with the majority of use was for rice field, shrubs, and moor. Meanwhile, the low soil quality zones are dominated by open land and grassland. Soil quality criteria based on the territorial size of research location is presented in Table 9.
Table 9. Soil Quality Criteria Based on Research Territory
Criteria SQI Value Territorial Area
( ha) (%) Low
Medium High
0.27 0.52 0.64
658.18 8542.90 14016.98
2.83 36.79 60.38
Total 1.43 23218.06 100.00
Average 0.48
83
Components and Hydrological Disaster Mitigation Measures
The main components and additional soil quality against hydrological disaster vulnerability in Krueng Jreue Sub-Watershed, are influenced by land use change, and soil properties. Land use as biophysical element of watershed, consist of biological element in the form of vegetation and physical element of land in the form of soil type and land slope. The watershed biology element is dynamic so it is easy to change, including climate and agricultural cultivation, resulting in mismatch and land capability causing watershed degradation. Impacts of watershed degradation, among others, floods and droughts that are increasingly larger and increasing frequency can threaten the sustainability of agricultural development.
Changes in land use from forest to non-forest can condense the soil surface (soil permeability) to decrease infiltration rate and increase run-off. Open land has the lowest soil quality (average of SQI = 0.47) compared to all other land uses. This oxidized soil has a poor land cover, has shallow root depth (14-15 cm), low dust + clay (62%), total porosity is less good (42%), and high bulk density (1.33 g cm-3) .
While grassland, rice field, moor and shrub have medium grade criterion (average of SQI = 0.52), have medium root (58-75 cm), dust + clay rather low (63%), total porosity is less good (43%), and bulk density is rather high (1.29 g cm3). The higher the percentage of dust + clay, the lower the permeability of the soil.
Generally the addition of total porosity will be followed by the addition of soil permeability. Bulk density can be used to demonstrate soil boundary values in limiting root capability for soil penetration, and for root growth (Pearson et al., 1995). Bulk density is a soil characteristic that describes the level of soil congestion. High-density soils may complicate the development of plant roots, limited macro pores and inhibited water penetration (Sudaryanto, 2010). Open land is not protected from raindrops and easily transported by run-off when rainfall intensity is high enough. Therefore, this open condition causes the land vulnerable to flood and drought hazards.
While residential in Krueng Jreue Sub-Watersheds that have farm yard and rare population, secondary forest and primary forest have good quality (average of SQI = 0.64). These three fields have deep root depths (150-156 cm), high dust + clay (77%), good total porosity (51%), and low bulk density (1.25 g cm-3). The hydrological disaster vulnerability rate is relatively low, if rooting deepens, the
percentage of dust + clay and porosity is higher and the bulk density is low. Texture and total porosity are one unity. The smaller the texture size of a soil the larger the porosity. The soil contains a lot of clay, its porosity is bigger than the sandy soil. Thus, the smoother the soil, the greater the porosity.
Furthermore, the slope of the land is also a major component of the vulnerability of hydrological disasters, especially floods and landslides. The greater the slope of the land, the greater the occurrence of floods and landslides, especially the slopes of 15- <25% and 25- <40% in open land, grasslands and shrubs. The slope of the land is closely related to land management factors, flood and landslide hazards. In line with land-use change from forest to non-forest, it can decrease soil function, causing ecosystem damage and degradation of soil quality, thus increasing critical land area in Krueng Jreue Sub-Watershed. If the analysis of soil properties is good, the degree of hydrological disaster is not so high. Thus, the higher the quality of the soil, the less likely the occurrence of hydrological disasters.
To minimize the negative impacts and low quality of soil quality in Krueng Jreue Sub-Watershed, so on low land quality criteria (open land) and medium (grassland, rice field, moor and shrub), hydrological disaster mitigation should be done in a structural way and non-structural. Structurally by maintaining conservation areas as natural reservoirs, increasing infiltration and soil percolation by making absorption wells or combining with biopori (infiltration well). Conservation land processing, minimizing soil treatment, contour soil treatment, contour and contour drilling. Conducting soil conservation mechanically, especially on land that has a rather steep topography (15- <25%) and steep (25- <40%) with terracing system. Non-structural hydrological disaster reduction can be done by maintaining the area of primary and secondary forest at minimum 30% of the watershed area. Forests have a very important role in holding off run-off, which significantly reduces the occurrence of floods and droughts. In forest development in watershed areas, the socio-economic conditions of forest communities are a very important factor to consider, so that agroforestry is the right choice (Masto et al., 2008).
Conditions of population growth has made people hard to maintain the condition of the forest as before. Farmers own national land ownership of only 0.25 ha of farmers-1, so farmers cannot plant their
84
cliff, thereby reducing the vulnerability to landslides; and (3) soil structure and water content, increase in organic matter and nutrient availability, increasing activity and diversity, solum formation (Atmojo, 2008).
In addition to agroforestry, the application of conservation farming models to suit soil characteristics, or with local or site-specific agro-ecosystem conditions. Crop rotation, increase diversification of vegetation and create cultivation pattern by combining high strata (annual crops) with middle strata plant (plantation) and low strata (horticulture/food). Planting plant species that can withstand soil stability and high canopy density. Using cover crops of the legume family and immersing mulch residue crops and crop residues.
The use of soil fertilizer, fertilization, calcification, addition of organic material by returning litter of crops and increasing the amount of organic residue in the form of litter of vegetation with a variety of types. Integrated management system by combining artificial fertilizer (Urea, SP-36) and organic fertilizer (manure, green manure, straw, compost). Organic farming programs can be prioritized on lands with high P, K content and very low to low organic content. Implementation of integrated conservation farming on slopes, planting by adjusting contour and planting in strips according to contour.
Conclusions
(1) The soil criteria in the research territory consists of three classes i.e. low, medium, and high, with soil quality index values of 0.27; 0.52; and 0.64.
(2) Soil quality based on the territorial size of the research area is dominated by (1) high class, 14016.98 ha (60.38%); (2) medium, 8542.90 ha (36.79%); and low, 658.18 ha (2.83%).
(3) Types of land use with high quality soil include a primary forest, secondary forest and residential area each with a value of 0.66, 0.64 and 0.63. In contrast, open land, grassland, rice field, shrubs and moor were dominated by medium quality soil, each with a value of 0.47; 0.48; 0.52; 0.51 and 0.55.
(4) Main components and additional soil quality against hydrological disaster vulnerability, affected by land use change, and soil properties. Hydrological disaster mitigation measures in land quality zones with low criteria are carried out in a structural and non-structural way.
References
Abrahams, A.D., Parsons, A.J. and Wainwright, J. 1995. Effects of vegetation change on interrill runoff and erosion, Walnut Gulch, southern Arizona, Geomorphology. 13(1-4): 37-48.
Aprile, F. 2012. Evaluation of cation exchange capacity (CEC) in tropical soils using four different analytical methods, Journal of Agricultural Science, 4(6): 278-289.
Atmojo, S. W. 2008. The role of agroforestry in tackling floods and landslides. National Seminar on Agroforestry Education as a Strategy Facing Global Warming. Faculty of Agriculture, University of Sebelas Maret. Surakarta- Indonesia, 15.
Bergkamp, G. 1998. A hierarchical view of the interactions of runoff and infiltration with vegetation and microtopography in semiarid shrublands, Catena. 33(3-4): 201-220.
Bokal, S., Grobicki, A., Kindler, J. and Thalmeinerova, D. 2014. From national to regional plans–the Integrated Drought Management Programme of the Global Water Partnership for Central and Eastern Europe. Weather and Climate Extremes, 3: 37-46.
Buckman, H.O. and Brady, N.C. 1990. The Nature and Properties of Soils. 10th Ed. Maxwell Macmillan
International, New York. 621 p.
Cambardella, C.A. and Elliott, E.T. 1992. Particulate Soil Organic-Matter Changes Across a Grassland Cultivation Sequence. Soil Science Society of America Journal, 56: 77-83.
Chen, G., Zhu, H. and Zhang, Y. 2003. Soil microbial activities and carbon and nitrogen fixation. Research in Microbiology, 154(6): 393-398
Dong, C.Y., Yan, W.H., Min, Z.J., Lu, X., Shu, Z.B., Chun, Z.Y. and Qin, C.X. 2013. Minimum data set for assessing soil quality in Farmland of Northeast China. Pedosphere, 23 (5): 564-576.
Dunjo, G., Pardini, G. and Gispert, M. 2004. The role of land use–land cover on runoff generation and sediment yield at a microplot scale, in a small Mediterranean catchment. Journal of Arid Environments.57(2): 239-256.
Dunne, T., Zhang, W. and Aubry, B.F. 1991. Effects of Rainfall, Vegetation, and Microtopography on Infiltration and Runoff. Water Resources Research, 27(9): 2271-2285.
85
Irham, M. 2016. The spatial distribution of bed sediment on fluvial system: A mini review of the Aceh meandering river. Aceh International Journal of Science and Technology, 5(2):82-87.
Isnin, M., Basri, H. and Ramano. 2012. The Economic Value of Water Availability in Krueng Jreue Sub-Watershed, Great Aceh. Land Resources Management Journal, 1(2): 184-193.
Jayawardena, A.W. 2015. Hydro-meteorological disasters: Causes, effects and mitigation measures with special reference to early warning with data driven approaches of forecasting, Procedia IUTAM. 17: 3-12.
Jien, S.H. and Wang, C.S. 2013. Effects of biochar on soil properties and erosion potential in a highly weathered soil, Catena. 110: 225-233.
Kaiser, M., Zederer, D.P., Ellerbrock, R.H., Sommer, M. and Ludwig, B. 2016. Effect of mineral characteristics on content, composition, and stability of organic matter fractions separated from seven forest topsoil of different pedogenesis, Geoderma. 263: 1-7.
Karam, D.S., Abdu, A., Radziah, O., Shamshuddin, J., Husni, M.H.A., Hamid, A.H. and Seema, T. 2013. Changes in the physic chemical properties of soils under rehabilitated lowland dipterocarps forest at Chikus Forest Reserve, Perak, Malaysia. The Journal of MacroTrends in Applied Science, 1(1): 42-57.
Lima, A.C.R., Hoogmoed, W.B., Brussaard, L. and Dos Anjos, F.S. 2011. Farmers’ assessment of soil quality in rice production systems. NJAS-Wageningen Journal of Life Sciences, 58 (1-2): 31-38. Liu, Z., Zhou W., Jian-bo, S., Shu-tian, L., Guo-qing, L., Xiu-bin, W., Jing-wen, S. and Chao, A.
2014. Soil quality assessment of acid sulfate paddy soils with different productivities in Guangdong Province, China. Journal of Integrative Agriculture, 13 (1): 177-186.
Masto, R.E., Chhonkar, P.K., Singh, D. and Patra, A.K. 2008. Alternative soil quality indices for evaluating the effect of intensive cropping, fertilization and manuring for 31 years in the semi-arid soils of India. Environmental Monitoring and Assessment, 136 (1): 419-435.
Mausbach, M. J. and Seybold, C. A. 1998. Assessment of Soil Quality. In Soil Quality and Agricultural Sustainability. Ann Arbor Press. Chelsea, Michigan. pp. 33-34.
Nuria, R., Jerome, M., Leonide, C., Christine, R., Gerard, H., Etienne, I. and Patrick, L. 2011. IBWS: A syntetic index of soil quality based on soil macro-invertebrate community. Soil Biology and Biochemistry, 43 (10): 2032-2045.
Partoyo. 2005. Agricultural soil quality index analysis in Samas beach sandy land. Journal of Agricultural Sciences, 12 (2): 140-151.
Rahmanipour, F., Arzaioli, R., Bahrami, H.A. and Fereidouni, Z. 2014. Assesment of soil quality in agricultural lands of Qazvin Province, Iran. J. Ecological Indicator, 40: 19-26.
Regional Development Planning Agency Aceh. 2013. Land cover map of Krueng Jreue sub-watershed in 2009 and 2012. Citra Spot 5. National Institute of Aeronautics and Space. Banda Aceh-Indonesia.
Sanchez-Navarro, A., Gil-Vázquez, J.M., Delgado-Iniesta, M.J., Marín-Sanleandro, P., Blanco-Bernardeau, A. and Ortiz-Silla, R. 2015. Establishing an index and identification of limiting parameters for characterizing soil quality in Mediterranean ecosystems. Catena, 131: 35-45.
Shahab, H., Emami, H., Haghnia, G.H. and Karimi, A. 2013. Pore size distribution as a soil physical quality index for agriculture and pasture soil in Northeastern Iran. Pedosphere, 23(3): 312-320. Sitompul, S.M., Hairiah, K., Cadisch, G. and Noordwijk, M.V. 2000. Dynamics of density fractions of
macro-organic matter after forest conversion to sugarcane and woodlots, accounted for in a modified century model. NJAS-Wageningen Journal of Life Sciences, 48(1): 61-73.
Sudaryanto, R. 2010. Analysis of agricultural land use in Samin River Basin for landslide and flood mitigation. Soil Science-Journal of Soil Science and Agroclimatology, 7(1): 41-49.
Tallaksen, L.M., Hisdal, H. and Lanan, H.A.J.V. 2009. Space-time modellling of catchment scale drought characteristic. Journal of Hydrology, 375 (3-4): 363-372.
Van Huijgevoort, M.H.J., Van-Lanen, H.A.J., Teuling, A.J. and Uijlenhoet, R. 2014. Identification of changes in hydrological drought characteristics from a multi-GCM driven ensemble constrained by observed discharge. Journal of Hydrology, 512: 421-434.
Wander, M.M., Walter, G.L., Nissen, T.M., Bollero, G.A., Andrews, S.S. and Cavanaugh-Grant, D.A. 2002. Soil Quality: Science and Process. Agron, J, 94 (1): 23-32.