TIME SERIES OF IMAGES TO IMPROVE TREE SPECIES CLASSIFICATION
G. T. Miyoshi1,*, N. N. Imai1,2, M. V. A. de Moraes2, A. M. G. Tommaselli1,2, R. Näsi3
1 Post Graduate Program in Cartographic Science, São Paulo State University (UNESP), Presidente Prudente-SP, Brazil - [email protected]
2 Dept. of Cartography, São Paulo State University (UNESP), Presidente Prudente-SP, Brazil - (nnimai, tomaseli)@fct.unesp.br, [email protected]
3 Finnish Geospatial Research Institute FGI, Geodeetinrinne 2, P.O. Box 15, FI-02431 Masala, Finland - [email protected]
Commission III, WG III/4
KEY WORDS: Tree species classification, Hyperspectral image, Time series, UAV, Random Forest, SAM, SID
ABSTRACT:
Tree species classification provides valuable information to forest monitoring and management. The high floristic variation of the tree species appears as a challenging issue in the tree species classification because the vegetation characteristics changes according to the season. To help to monitor this complex environment, the imaging spectroscopy has been largely applied since the development of miniaturized sensors attached to Unmanned Aerial Vehicles (UAV). Considering the seasonal changes in forests and the higher spectral and spatial resolution acquired with sensors attached to UAV, we present the use of time series of images to classify four tree species. The study area is an Atlantic Forest area located in the western part of São Paulo State. Images were acquired in August 2015 and August 2016, generating three data sets of images: only with the image spectra of 2015; only with the image spectra of 2016; with the layer stacking of images from 2015 and 2016. Four tree species were classified using Spectral angle mapper (SAM), Spectral information divergence (SID) and Random Forest (RF). The results showed that SAM and SID caused an overfitting of the data whereas RF showed better results and the use of the layer stacking improved the classification achieving a kappa coefficient of 18.26%.
* Corresponding author
1. INTRODUCTION
Forests cover almost one third of the terrestrial surface and play an important role in biodiversity conservation and mitigation of world’s climate change (Romijn et al., 2015). The identification of species and successional stage of forests helps to monitor this type of vegetation and Remote Sensing measurements appear as a promising alternative, mainly with imaging spectroscopy using hyperspectral sensors (Féret and Asner, 2013; Baldeck et al., 2015; Näsi et al., 2016; Nevalainen et al., 2017).
Miniaturized sensors have been developed to be attached to Unmanned Aerial Vehicles (UAV) for mapping purposes. These systems can acquire images with high spectral and spatial resolution, being able to be applied in classification of tree species. However, it is known that forests have a high floristic diversity with heterogeneous structure, what makes the tree species classification difficult (Féret and Asner, 2013).
Tree species present different behaviour according to the season of the year due to the flowering and appearance of fruit. These different characteristics of trees appear as a promising concept to classify tree species. Key et al. (2001) used multispectral aerial photographs to discriminate four tree species in West Virginia, USA. Somers and Asner (2014) showed the use of four different epochs of Hyperion images to classify tree species in Hawaiian forests using a spectral unmixing strategy and a feature selection process.
Two challenges when working with tropical forests, especially Atlantic Forests, are the forest structure and the spectral variability among tree species, which influence the tree species classification (Ferreira et al., 2016). In this sense, this work has the objective of evaluating the improvement of tree species classification using hyperspectral images acquired over Atlantic Forest in two different years.
1.1 Study area
The study area is a fragment of Atlantic Forest located in the northwest part of the ecological reserve named Ponte Branca (Figure 1), part of the Black Lion Tamarin Ecological Station (ESEC-MLP). The Ponte Branca fragment is a semi deciduous forest located in the western part of São Paulo State (22°24’51”S and 52°30’50”W). It comprises different successional stages, including young and mature forests (Berveglieri et al., 2016).
Starting from the access road nearby, the study area is a
To discriminate the tree species, several steps were performed as follows: i) Image acquisition; ii) Dark current correction and radiometric calibration; iii) Geometric processing with bundle block adjustment; iv) Radiometric block adjustment; v) Tree delimitation and species recognition; vi) Image classification; vii) Results analysis.
2.1 Image acquisition
The Rikola Hyperspectral Camera, a hyperspectral imagery sensor developed by Senop Ltd. (http://senop.fi/) was used for image acquisition. This camera has two complementary metal oxide semiconductor (CMOS) frame sensors based on the record data in W/sr², but relative values.
A characteristic that makes this camera interesting in research applications is its capacity of selecting and acquiring different spectral bands in a range between 500 nm to 900 nm. Regarding the spectral bands acquisition, the FPI makes it possible because each airgap of the interferometer corresponds to one wavelength with specific full width of half maximum (FWHM). The spectral bands are acquired sequentially causing a slightly different spatial position among the spectral bands, which can be corrected applying geometric transformations (Honkavaara et al., 2013).
Two models of this camera were used in this study: the first one was the 2014 model and the second one was the 2015 model. Table 1 shows the spectral settings of the cameras.
Central wavelengths of the 2014 camera (nm): 506.07, 520.00, 535.45, 550.16, 564.71, 580.08, 592.78, 609.79, 619.55, 629.23, 650.28, 660.27, 669.96, 680.06, 689.56, 699.62, 709.71, 719.99, 729.56, 740.45, 749.65, 770.46, 780.16, 790.21, 819.74
FWHM of the 2014 camera (nm): 15.65, 17.51, 16.41, 15.18, 16.60, 15.14, 14.81, 13.77, 14.59, 12.84, 15.85, 24.11, 21.70, 21.00, 21.67, 21.89, 20.78, 20.76, 21.44, 20.64, 19.43, 19.39, 18.25, 18.50, 18.17
Central wavelengths of the 2015 camera (nm): 506.22, 519.94, 535.09, 550.39, 565.10, 580.16, 591.90, 609.00, 620.22, 628.73, 650.96, 659.72, 669.75, 679.84, 690.28, 700.28, 710.06, 720.17, 729.57, 740.42, 750.16, 769.89, 780.49, 790.30, 819.66
FWHM of the 2015 camera (nm): 12.44, 17.38, 16.84, 16.53, 17.26, 15.95, 16.61, 15.08, 16.26, 15.30, 14.44, 16.83, 19.80, 20.45, 18.87, 18.94, 19.70, 19.31, 19.01, 17.98, 17.97, 18.72, 17.36, 17.39, 17.84
Table 1. Spectral settings of the FPI cameras
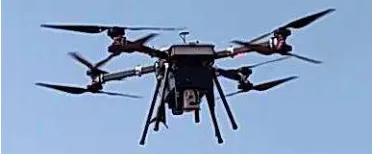
The camera and its accessories were installed in an UAV octocopter, model SX8, developed by Sensormap company (http://www.sensormap.com.br/). This UAV is controlled by the DJI Wookong-M autopilot and is able to fly up to 30 minutes, depending on payload weight and weather conditions.
A Sony NEX A6000 RGB camera, a global navigation satellite system (GNSS) receiver, an inertial navigation system (INS)
Two image data sets were used in this work. The first one was acquired in August 2015 and the second one in August 2016 using the 2014 camera and 2015 camera, respectively. The flight height for both image acquisitions was 160 m above the ground, providing images with Ground Sample Distance (GSD) of approximately 10 cm. Considering the tree tops, with trees average height about 10 m, the flight height was 150 m, providing images with 9.5 cm of GSD on the top of the canopy.
The weather was dry and sunny, without clouds, during both flights and without rain for at least two weeks before the flights. In the 2015 flight, the average Sun zenith and azimuthal angle were 45°45’18” and 322°51’54”, respectively. For the 2016 flight, due to different acquisition times, the average Sun zenith and azimuthal angle were 61°40’48” and 300°26’24”, respectively.
2.2 Image processing
After the image acquisition, it was performed the dark current correction using a dark image acquired before the flight, and the radiometric calibration using a calibration file provided by the manufacturer. The Hyperspectral Imager, software provided by Senop Ltd, was used for both procedures.
To reconstruct the camera geometry, the Interior Orientation Parameters (IOP) were estimated using the on-job calibration, performed with AgiSoft PhotoScan. This software was also used to refine the Exterior Orientation Parameters (EOP) of three reference bands, for image orientation. The reference bands were those centred in 564.71 nm, 680.06 nm and 770.46 nm for the 2014 camera and 565.10 nm, 679.84 nm and 769.89 nm for the 2015 camera. The initial EOP values were determined by the GNSS/INS integrated system and post-processed with the Waypoint Inertial Explorer software (http://www.novatel. com/products/software/inertial-explorer/).
irradiance data from the camera sensor were not used because it gives only relative values of irradiance.
Finally, to acquire physical values in the images, the empirical line method (Smith and Milton, 1999) was applied. Targets measuring 1.40 m by 1.40 m in black, grey and white were placed in the study area to be used as radiometric reference. The mean hemispherical directional reflectance factors (HDRF) of the targets were 72%, 17% and 2% for the white, grey and black targets, respectively. Figure 3 shows the targets in a RGB image composition of the FPI camera (R = 650.96 nm; B = 550.39 nm; B = 506.22 nm).
Figure 3. Radiometric reference targets for the empirical line
2.3 Image classification
After the image processing, polygons of tree crowns were manually delimited to be recognized in field. A native inhabitant of the area identified the polygons, divided into ten different species. However, as the objective of this work is to verify the contribution of temporal image series for classification of tree species, only four species were used in the analysis, because more than one sample tree is available for these species. The species were Copaifera langsdorffii (Cl),
Apuleia leiocarpa (Al), Hymenaea courbaril (Hc) and Helietta
apiculate (Ha). Table 2 shows how many trees were identified
for each species and the average number of pixels of each crown.
Part of the crowns identified in field was selected to compose the training set. The sample selection criteria was to use parts of the trees crowns, which presented colour variation due to shadows or due to leaves moisture. Table 2 shows the number of pixels and polygons identified and used as the training sets. The average spectral response was calculated with the pixels of each polygon, which make up the sample. These average
Table 2. Average number of pixels per tree species, number of trees recognized in field and used for the training set and,
number of pixels used as training set
Three data sets, named DS1, DS2 and DS3, were classified with three classifiers each. The first data set (DS1) consisted of the mosaic from images acquired in August 2015 and all their 25 spectral bands were used for each classification technique. The mosaic obtained from the images of August 2016 compose the second data set (DS2), being used all of their 25 spectral bands for image classification. The last data set (DS3) is a layer stack performed with the mosaics from August 2015 and August 2016, generating 50 spectral bands, used in each classifier. This data set allows the comparison of the classification performance using temporal information against single date. Table 3 shows the information used for each data set.
Data set Images from Spectral bands
DS1 August 2015 25
DS2 August 2016 25
DS3 August 2015 and August 2016 50
Table 3. Variables used in each data set
The classifiers methods applied were the Spectral Angle Mapper (SAM), the Spectral Information Divergence (SID) and the Random Forest (RF). The first two were applied with ENVI version 5.1 (Exelis Visual Information Solutions, Boulder, Colorado) and the RF were applied using the ImageRF (Waske et al., 2012). All the classification results were evaluated using the reference polygons not used as training set, in the EnMAP-Box (van der Linden et al., 2015)
SAM is an algorithm that determines the spectral similarity,
SID was the second classifier method applied, and it measures the discrepancy probabilities among the reference spectra and each pixel (Chang, 1999). The selected threshold for maximum divergence spectra was 0.01, to minimize false positives during the classification, since there are more than 20 species in the study area.
The last classifier applied was the RF, a non-parametric algorithm that uses multiples trees of random subsets of the training data to classify the image (Breiman, 2001). One hundred trees were created using the reference spectra and the Gini Coefficient were chosen as impurity function.
3. RESULTS AND ANALYSIS
Table 4 shows the confusion matrixes for SAM results. For this classifier, the kappa coefficient varied from 1.78% to 14.52% where the highest value was achieved for the DS2 data set. The DS1 obtained a kappa coefficient of 1.78% and the DS3 obtained a kappa coefficient of 7.95%. According to Viera and Garrett (2005), this value of kappa index shows a slight agreement for the classification. These results show that using images from different years did not improve the classification using SAM. Confusion among classes occurred in all data sets, especially with Al and the other classes such as Cl and Hc. These results were expected because the images were acquired in the same month, August, with similar pre-flight weather
Table 4. Confusion matrix for the data sets classified with SAM kappa values can be considered in a slight agreement with the ground truth, following Viera and Garret (2005). In addition,
Table 5. Confusion matrix for the data sets classified with SID
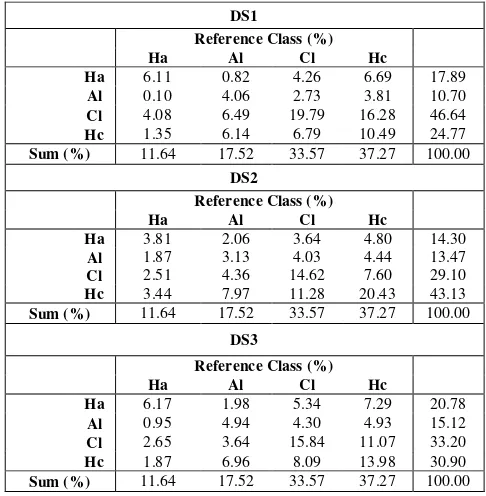
The RF presented highest values of kappa coefficient when compared to SID and SAM. The higher coefficient value was founded for the DS3 dataset. The values for DS1, DS2 and DS3 with RF were, respectively, 16.33%, 17.29% and 18.26%. These values still present a slight degree of agreement (Viera and Garret 2005), but, even though, showed better results. Analysing the results it is possible to observe that the temporal information, layer stacking of images from 2015 and 2016, helped to improve the classification. Even being acquired in the same month, August, classification with these presented a higher value of kappa coefficient in the DS3. This result can be explained because the RF is insensitive to overfitting (Belgiu and Dragut, 2016) and the classification was improved. In order to have a better understanding of the results, the confusion matrixes calculated for each data set classified with RF is presented in Table 6.
Table 6. Confusion matrix for the data sets classified with RF
In addition, even with low kappa coefficient values, it can be remembered that only four species were used in the classification. The use of a higher number of species might help the classification accuracy. Another issue is the number of individuals for each species used in the training set. Cl was the specie most identified in field work, being the specie with higher number of training samples and validation. The more the number of samples are, more accurate is the classification result.
Finally, it was observed that the use of pixel-based classification can affect the classification accuracy. Trees are composed of leaves and branches. In forests, the understory can affect the classification. The use of region-based classification should improve the species classification as well the use of spatial information.
4. CONCLUSION
In this study, we presented the use of time series of images to verify the improvement of tree species classification. The tree species belong to the fragment of Atlantic Forest named Ponte Branca. Hyperspectral images were acquired by using an UAV in 2015 and 2016. The classifiers applied showed the data overfitting, except for RF technique, which achieved an improved classification result. However, it is expected that the use of images acquired in different seasons of the year, such as March or April and November or December could improve the image classification. Images acquired in these seasons can show a higher variance in the spectral responses of trees Conselho Nacional de Desenvolvimento Científico e Tecnológico (CNPq) (grant 153854/2016-2) and Coordenação de Aperfeiçoamento de Pessoal de Nível Superior (CAPES) sensing: A review of applications and future directions. ISPRS
Journal of Photogrammetry and Remote Sensing, 114, pp.
24-31.
Berveglieri, A., Tommaselli, A. M. G., Imai, N. N., Ribeiro, E. A. W., Guimarães, R. B., and Honkavaara, E., 2016. Identification of Successional Stages and Cover Changes of Tropical Forest Based on Digital Surface Model Analysis. IEEE Journal of Selected Topics in Applied Earth
Observations and Remote Sensing, 9(12), pp. 5385-5397.
Breiman, L., 2001. Random Forests. Machine Learning, vol. 45, No. 1, pp. 5-32
Chang, C. I., 1999. Spectral information divergence for hyperspectral image analysis. In: Geoscience and Remote
Sensing Symposium, IGARSS'99 Proceedings. IEEE
International, Vol. 1, pp. 509-511.
Cohen, J., 1960. A coefficient of agreement for nominal scales.
Educational and Psychological Measurement, 20, pp. 37-46.
Ferreira, M. P., Zortea, M., Zanotta, D. C., Shimabukuro, Y. E., and de Souza Filho, C. R., 2016. Mapping tree species in tropical seasonal semi-deciduous forests with hyperspectral and multispectral data. Remote Sensing of Environment, 179, pp. 66-78.
Féret, J. B., and Asner, G. P., 2013. Tree species discrimination in tropical forests using airborne imaging spectroscopy. IEEE Transactions on Geoscience and Remote
Sensing, 51(1), pp. 73-84.
Hakala, T., Honkavaara, E., Saari, H., Mäkynen, J., Kaivosoja, J., Pesonen, L., and Pölönen, I., 2013. Spectral imaging from UAVs under varying illumination conditions. International Archives of the Photogrammetry, Remote Sensing and Spatial
Information Sciences, 2013 UAV-g201, pp. 189-194.
Honkavaara, E., Saari, H., Kaivosoja, J., Pölönen, I., Hakala, T., Litkey, P., Mäkynen, J. and Pesonen, L., 2013. Processing and assessment of spectrometric, stereoscopic imagery collected using a lightweight UAV spectral camera for precision agriculture. Remote Sensing, 5(10), pp. 5006-5039.
Key, T., Warner, T. A., McGraw, J. B., and Fajvan, M. A., 2001. A comparison of multispectral and multitemporal information in high spatial resolution imagery for classification of individual tree species in a temperate hardwood forest.
Remote Sensing of Environment, 75(1), pp. 100-112.
Näsi, R., Honkavaara, E., Tuominen, S., Saari, H., Pölönen, I., Hakala, T., Viljanen N., Soukkamäki, J., Näkki, I., Ojanen, H. and Reinikainen, J., 2016. UAS based tree species identification using the novel FPI based hyperspectral cameras in visible, NIR and SWIR spectral ranges. In: International Archives of the Photogrammetry, Remote Sensing and Spatial
Information Sciences, 2016 ISPRS Congress, pp. 1143-1148.
Nevalainen, O., Honkavaara, E., Tuominen, S., Viljanen, N., Hakala, T., Yu, X., Hyyppä, J., Saari, H., Pölönen, I., Imai, N.N. and Tommaselli, A. M. G., 2017. Individual Tree Detection and Classification with UAV-Based Photogrammetric Point Clouds and Hyperspectral Imaging.
Remote Sensing, 9(3), pp. 185.
Oliveira, R. A., Tommaselli, A. M., and Honkavaara, E., 2016. Geometric Calibration of a Hyperspectral Frame Camera. The
Photogrammetric Record, 31 (155), pp. 325-347.
Smith, G. M. and Milton, E. J., 1999. The use of the empirical line method to calibrate remotely sensed data to reflectance.
International Journal of Remote Sensing, v. 20, p. 2653-2662.
Somers, B., and Asner, G. P., 2014. Tree species mapping in tropical forests using multi-temporal imaging spectroscopy: Wavelength adaptive spectral mixture analysis. International
Journal of Applied Earth Observation and Geoinformation,
31, pp. 57-66.
van der Linden, S., Rabe, A., Held, M.; Jakimow, B., Leitão, P.J., Okujeni, A., Schwieder, M., Suess, S. and Hostert, P., 2015. The EnMAP-Box—A Toolbox and Application Programming Interface for EnMAP Data Processing. Remote
Sensing, 7, pp. 11249-11266.
Viera, A. J., and Garrett, J. M., 2005. Understanding interobserver agreement: the kappa statistic. Fam Med, 37(5), pp. 360-363.
Waske, B., van der Linden, S., Oldenburg, C., Jakimow, B., Rabe, A. and Hostert, P., 2012. ImageRF–A user-oriented implementation for remote sensing image analysis with Random Forests. Environmental modelling & software, 35, pp. 192-193.
Yuhas, R. H., Goetz, A. F. H., Boardman, J. W. and Green, R. O., 1992. Discrimination among semiarid landscape endmembers using the Spectral Angle Mapper (SAM) algorithm. Summaries 3rd Annu. JPL Airborne Geoscience