A PROBABILITY MODEL FOR DROUGHT PREDICTION USING FUSION OF
MARKOV CHAIN AND SAX METHODS
Y. Jouybari-Moghaddam, M. R. Saradjian, A.M. Forati,
Faculty of Surveying and Geospatial Engineering, College of Engineering, University of Tehran, Tehran, Iran (y.joibari, sarajian, forati) @ut.ac.ir
KEY WORDS: SAX, Markov Chain, Drought, Remote Sensing.
ABSTRACT:
Drought is one of the most powerful natural disasters which are affected on different aspects of the environment. Most of the time this phenomenon is immense in the arid and semi-arid area. Monitoring and prediction the severity of the drought can be useful in the management of the natural disaster caused by drought. Many indices were used in predicting droughts such as SPI, VCI, and TVX. In this paper, based on three data sets (rainfall, NDVI, and land surface temperature) which are acquired from MODIS satellite imagery, time series of SPI, VCI, and TVX in time limited between winters 2000 to summer 2015 for the east region of Isfahan province were created. Using these indices and fusion of symbolic aggregation approximation and hidden Markov chain drought was predicted for fall 2015. For this purpose, at first, each time series was transformed into the set of quality data based on the state of drought (5 group) by using SAX algorithm then the probability matrix for the future state was created by using Markov hidden chain.
The fall drought severity was predicted by fusion the probability matrix and state of drought severity in summer 2015. The prediction based on the likelihood for each state of drought includes severe drought, middle drought, normal drought, severe wet and middle wet. The analysis and experimental result from proposed algorithm show that the product of this algorithm is acceptable and the proposed algorithm is appropriate and efficient for predicting drought using remote sensor data.
1. INTRODUCTION
Drought is such natural disasters that usually covers a large area and also have long term effects. Due to the impact of this phenomenon on weather, agriculture, water and socio - economic issues it can have an infrastructural and destructive effect on the environment. In general, due to drought dependence on multiple parameters and its complexity, a definition for this phenomenon is no easy task (S. Javanmard et al 2000). Commonly researchers from different professional perspectives investigate this phenomenon. Accordingly, drought can be divided into three general categories: meteorological, agricultural and hydrological (Heim Jr 2002; Coco 2007)
Drought forecasting can have a useful role in mitigation of this phenomenon's damages which depends on the exact definition of drought and linking drought with a series of associated indices. Several parameters have been defined on this basis to be modeled during the period of drought forecasting.
Based on studies in the field, these indicators can be divided into two general categories meteorological indicators and satellite remote sensing indicators (Soleimani 2010). The most common weather indices are Standardized Precipitation Index (SPI) and the Palmer Drought Severity Index (PDSI), and generally, satellite indices are vegetation index (VI) and land surface temperature (LST) and its derivatives (Mahmodi 2011)
Currently, the analysis of time series of drought indicators used to predict drought which is forecast the absolute numerical value based on an extrapolation of the function fitted to the time series (Khosravi, Jouybari-Moghaddam, and Sarajian 2017)
Firstly, if the drought is a phenomenon with qualitative nature, so even if we express this phenomenon numerically, ultimate results must be expressed qualitatively. Secondly, the nature of the predictions is always probabilistic thus providing a fixed amount is not meaningful. Another problem of existing methods is in determining the communicational interval of any data with previous data. Due to the uncertainty in determining these ranges (delay), an error entered into the prediction process. In this study, prediction carried out in a way that the preceding be considered in it.
Therefore, the use of indicators is to be treated in such a way that all three categories of drought be investigated. Moreover, symbolic approximation method using to analyze drought qualitatively and finally based on probabilistic Markov made a prediction.
In this study, meteorological parameters (standardized precipitation index SPI) and remote sensing indices (VCI vegetation health index and temperature-vegetation index TVX) were used simultaneously. And On its basis monthly time series between winter 2000 and summer 2015 was established for the three indicators and by using symbolic approximation method values of this indices turned to its associated qualitative data (extreme wet, wet, normal, drought, severe drought) and then by the use of Markov chain method a probabilistic model based on qualitative data for the drought obtained.
2. CASE STUDY
This research study area is eastern Isfahan Province where has five sub-regional. The study area has semi-desert climate and is located in the range of latitude N "40 '29 ° 32 and N" 47 '45 ° 32 and The International Archives of the Photogrammetry, Remote Sensing and Spatial Information Sciences, Volume XLII-4/W4, 2017
Tehran's Joint ISPRS Conferences of GI Research, SMPR and EOEC 2017, 7–10 October 2017, Tehran, Iran
This contribution has been peer-reviewed.
longitude E "29 '42 ° 51 to" E52 '59 ° 51. Figure 1 shows the study area.
The data used in this research is land surface temperature (LST), and normal differential vegetation index (NDVI) from MODIS satellite products that are free and downloaded from the NASA Earth Observations (NEO) Other data were also used is precipitation data from TRMM. The data for a period of 16 years from winter 2000 to summer 2015 were downloaded.
Figure 1: study area
3. METHODOLOGY
In this part of the article the methods used in this study were described; in the first section, symbolic aggregate approximation (SAX) and in the second part Markov chain method is explained.
A. Symbolic Aggregate Approximation method
Symbolic Aggregate approximation method is one of the approaches to show time series offered by Lin et al. in 2003. This process took a time series as input and turned it into a set of strings as output (Lin et al. 2003).
By the use of Symbolic Aggregate Approximation method, a time series of arbitrary length n can be converted to an arbitrary string with length w (w <n and commonly w << n). This method is based on the fact that normalized time series follow Gaussian distribution (Larsen and Marx 1986).
Symbolic Aggregate approximation method consists of two main stages. First, convert the Piecewise Aggregation Approximation (PAA) to reduce the time series dimension and second discrete time series obtained from the previous step to convert it to the string.
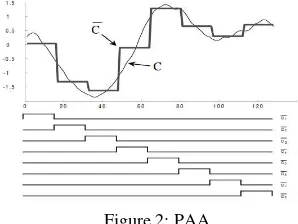
1. Piecewise Aggregation Approximation
Piecewise Aggregation Approximation converts series C of length n into a vector of arbitrary length w. The amount of each component is calculated from the following equation.
(1)
In other words, piecewise aggregation approximation to reduce dimension n to w, firstly original time series divides into w equal parts and calculates the average value for each part.
The sequence obtained from the mean values is the converted piecewise aggregation approximation for the time series. Figure 2 is a demonstration of the conversion.
Figure 2: PAA
2. Discretization
After implementing piecewise aggregation approximation of original time series, another conversion can be applied to obtain a discrete series of time. Therefore, discretization which is based on the production of a series of symbols with similar probability of the original time series is likely to be very useful.
The symbolic aggregation approximation method by using two parameters break point, and word converts transformed time series in the previous step into the discrete case. The word is a collection of strings that are used to convert time series. It means that at any interval between breakpoints substituted with a series of an alternative word. Figure 3 is showing discretization assuming that the breakpoints defined as -47.0 and 47.0, and the word is defined as abc.
Figure 3: discretization
B. Markov Chain
A Markov chain is kind of modeling in which the current state of the system depends on its previous state. Determining the state of the system (projected) by using Markov model needs previous state of the system and the possibility of changing in system state to other possible states, the so-called transition probabilities to be known (Baum and Petrie 1966).
According to the current state of a system, a square matrix P formed and matrix elements Pij has represented the transition probability.
In this matrix, the likelihood of early states in the left column and the possibility of cases where the system passes them along the lines of the matrix are shown.
4. Implementation and results
The International Archives of the Photogrammetry, Remote Sensing and Spatial Information Sciences, Volume XLII-4/W4, 2017 Tehran's Joint ISPRS Conferences of GI Research, SMPR and EOEC 2017, 7–10 October 2017, Tehran, Iran
This contribution has been peer-reviewed.
First, by using data from TRMM sensor and the standardized precipitation index SPI and via Equation 2 for monthly time series of the winter of 2000 until the end of 2015 summer was calculated. (2)
By using time series data, land surface temperature (LST) and the normalized vegetation index (NDVI) for the same period with noticeable in seasons the amount of W considered 63 for the PAA convert to reduce seasonally adjusted time series
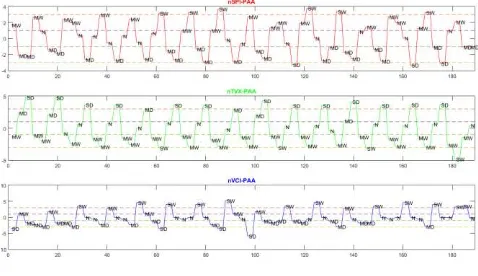
Figure 4 Showing PPA time series of indices used in this research. The next step, assuming a Gaussian distribution for each indicator, and the values of δ and δ3 as breakpoints for SAX method were selected.
These values were based on probability levels. Moreover, strings intended to convert SAX have been chosen as follows:
1- SW: extreme wet drought. Figure 5 showing the transformation for each series of the time.
The horizontal axis represents time, and the vertical axis represents the amount of PAA for each indicator, and the number written on each of intervals represents the new time series value.
In other words, the input time series after SAX conversion converted to a set of strings of qualitative drought values.
After conversion of each time series into qualitative data through the SAX method, in the next stage, the collection of qualitative data by using Markov chain method were prepared to predict the probability of the next state.
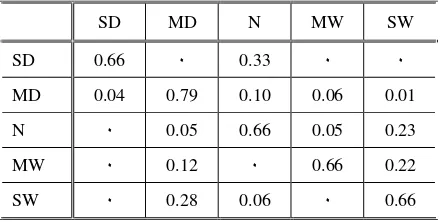
In other words, the transition state matrix for each index was determined. Tables 1 to 3 shows probabilistic values for each index through Markov chain.
Figure 4: PAA presentation for drought index
Figure 5: SAX presentation for drought index
Values in above tables represent the probability of the next state of drought concerning the latest drought.
The correlation coefficient between the values of the likelihood of each index with other indices to evaluate accurately calculated as follows:
1 .The correlation coefficient between SPI and TVX equal to 89 2 .The correlation coefficient between SPI and VCI equal to 95 3. The correlation coefficient between VCI and TVX index equal to 89
High amounts of correlation between the probability values indicate that resulted probability values are acceptable.
In the final step, after calculating the probability values by using the last status of the three indicators, drought conditions for the next month predicted.
The forecast shows that in the fall of 2016 in the Eastern region of Isfahan Province
by the possibility of 2% severe drought, 12% drought, 50% typical situation (normal), 25% wet and 10 % extreme wet will occur.
Table I: Probability model for drought based on SPI index
SW
Table II: Probability model for drought based on VCI index
SW
The International Archives of the Photogrammetry, Remote Sensing and Spatial Information Sciences, Volume XLII-4/W4, 2017 Tehran's Joint ISPRS Conferences of GI Research, SMPR and EOEC 2017, 7–10 October 2017, Tehran, Iran
This contribution has been peer-reviewed.
Table III: Probability model for drought based on TVX index
SW MW
N MD SD
0 0
0.33 0
0.66 SD
0.01 0.06
0.10 0.79
0.04 MD
0.23 0.05
0.66 0.05
0 N
0.22 0.66
0 0.12 0
MW
0.66 0
0.06 0.28
0 SW
5. Conclusion
This study was conducted to investigate, modeling and forecast drought, one of the world’s natural hazards and controversial issue. For this purpose, time series of three indices SPI, VCI, and TVX between winter 2000 and summer 2015 were designed and used, and in this study, it was done by incorporation of SAX and Markov chain. The advantage of using a combination of these methods compared to other methods is it provide a probabilistic qualitative model of drought.
In fact, due to the nature of drought that is qualitative and on the other hand, fuzzy and probabilistic nature of the predictions, this method seems more reasonable than other modeling methods. On the contrary, due to the high correlation between probabilistic models obtained as well as implementing the method for certain modes and the logical outcome of this case, the accuracy of the proposed method was acceptable. The forecast for possible droughts in autumn 2015 shows that approximately 70% will be normal and not a drought.
The authors examining the impact of changes in the value of break points of SAX method on the result of probabilistic model and also determining these values on the basis of conditions of each climate left for the future works. In addition, using an analysis of other rules in order to qualify the indices in SAX method or using another method to display time series can be helpful to advance this research.
REFERENCES
Baum, Leonard E, and Ted Petrie. 1966. 'Statistical inference for probabilistic functions of finite state Markov chains', The
annals of mathematical statistics, 37: 1554-63.
Coco, Musaningabe Rulinda. 2007. 'Mining Drought from Remote Sensing Images', International Institute for Geo-Information Science and Earth Observation, The
Netherlands.
Heim Jr, Richard R. 2002. 'A review of twentieth-century drought indices used in the United States', Bulletin of the
American Meteorological Society, 83: 1149-65.
Javanmard, Sadegh. Badagh, J. Ahmadian and N. Javdani, “Care system for severity and extent of drought based on Palmer index segmentation,” 1st National Conference on Drought Mitigation and Water, Kerman, 1379
Khosravi, Iman, Yaser Jouybari-Moghaddam, and Mohammad Reza Sarajian. 2017. 'The comparison of NN, SVR, LSSVR and ANFIS at modeling meteorological and remotely sensed drought indices over the eastern district of Isfahan, Iran', Natural Hazards: 1-16.
Larsen, Richard J, and Morris L Marx. 1986. An introduction to
mathematical statistics and its applications
(Prentice-Hall Englewood Cliffs, NJ).
Lin, Jessica, Eamonn Keogh, Stefano Lonardi, and Bill Chiu. 2003. "A symbolic representation of time series, with implications for streaming algorithms." In Proceedings of the 8th ACM SIGMOD workshop on Research issues
in data mining and knowledge discovery, 2-11. ACM.
Mahmodi, A. Esmaeli, and M. Hani. 1390.
“study of rainfall effect on Drought using Remote Sensing Index,” Geomatics 90, NCC,
Solimani, 1389
“Analysis of Drought Risk,” MSc thesis, University of Tehran,
The International Archives of the Photogrammetry, Remote Sensing and Spatial Information Sciences, Volume XLII-4/W4, 2017 Tehran's Joint ISPRS Conferences of GI Research, SMPR and EOEC 2017, 7–10 October 2017, Tehran, Iran
This contribution has been peer-reviewed.