18 Tri Monarita Johan
FUNCTIONAL MEMBERSHIP ANALYSIS OF FUZZY INFERENCE SYSTEM SUGENO IN ANEMIA
CLASSIFICATION
19 Henny Yustisia
CURRICULUM ANALYSIS OF PREREQUISITE COURSE AT INDUSTRIAL FIELD PRACTICE (IFP)
(Case Study: Competency Compliance)
20
Suryadimal, Edi Septe,Wenny Martiana, Fahmi Rizal, Nizwardi Jalinus
NEED ANALYSIS APPLICATION ON THE FEASIBILITY STUDY OF THE HYDROELECTRIC POWER SELECTION (CASE IN SOLOK, PESISIR SELATAN AND SIJUNJUNG REGENCY)
15
16
17
21
Nur Hidayati, Muhammad Ridha Ridwan
INTERACTIVE MULTIMEDIA PROGRAM WITH PROBLEM-BASED LEARNING METHOD TO IMPROVE LEARNING OUTCOMES INBIOLOGY SUBJECT
Sukardi, M.Giatman, Remon Lapisa, Purwantono, Refdinal
A MICRO HYDROPOWER GENERATOR AS AN ALTERNATIVE SOLUTION FOR ENERGY PROBLEM SOLVING IN INDONESIAN REMOTE AREA
Nuzul Hidayat, Ahmad Arif, M. Yasep Setiawan
RELATIONDRAG FORCE REDUCTION ON CIRCULAR CYLINDER USING CIRCULAR DISTURBANCE BODY WITH TURBULENCE INTENSITY
22
23
24
25
26 SIMPLE WATER PURIFIER USING MULTILEVEL SYSTEM
Dwiprima Elvanny Myori, Citra Dewi, Erita Astrid, Ilham Juliwardi
Jasman, Nelvi Erizon, Syahrul, Junil Adri, Bulkia Rahim Hendri Nurdin, Hasanuddin, Waskito, Refdinal, Darmawi
IMPLEMENTATION OF CONTEXTUAL TEACHING AND LEARNING ON ANALYZING ELECTRICAL CIRCUITS SUBJECT
Dwi Sudarno Putra, Misra Dandi Utama, Dedi Setiawan, Remon Lapisa, Ambiyar
EVALUATION OF LEARNING PROCESS USING CIPP MODEL
Remon Lapisa, Dwi Sudarno Putra, Ahmad Arif, Syafmi Algifari
EFFECT OF GASOLINE ADDITIVE MATERIALS ON ENGINE PERFORMANCE
Muhammad Luthfi Hamzah, Hamzah, Astri Ayu Purwati
THE ROLE OF INFORMATION TECHNOLOGY IN THE TEACHING LEARNING PROCESS EFFECTIVENESS IN ESA SEJAHTERA SCHOOL PEKANBARU
ASSESSMENT OF PRODUCT PROTOTYPE EXISTENCE AS A MEDIA OF LEARNING TO ACCELERATE THE
Fakultas Tekn ik, Universitas Negeri Padang
RELATIONDRAG FORCE REDUCTION ON CIRCULAR CYLINDER
USING CIRCULARDISTURBANCE BODY WITH TURBULENCE
INTENSITY
Nuzul Hidayat
1Ahmad Arif
2M. Yasep Setiawan
31,2,3
Department of Automotive Engineering, Faculty of Engineering, Universitas Negeri Padang
*
Corresponding author, e-mail:[email protected]
ABSTRACT: Th is experiment will be conducted experimentally on a wind tunnel that has a narrow sectio n with square cross section 125 mm x 125 mm and 26.4% and 36.4% blockage rat io. The specimens used are circular cylinder with diameter 25mm (d / D = 0.16) and 37.5mm (d/D = 0.107) and c ircular cylinder rod with dia meter 4 mm. The cylinder d isturbance body (CBD) a re p laced on the upper and lo wer sides with the position of 0, 300, 400, 500, 600
number based on hydraulic dia meter 11.6 x 10⁴ and 15.6 x10⁴. The results shown that the use of disturbance
body was able to reduce the pressure drop value on the narrow channel with square section. For D = 25mm (d / D = 0, 16) the reduction of the pressure drop value occurs in the disturbance body 0 0,
while for D = 37.5mm (d / D = 107) occurs in the s talking rod position 0 0 0. The increase of
turbulence intensity value can reduce the value o f drag pressure coefficient (Cdp) for circula r cylinder for D =
25mm (d / D = 0.16) for Reynolds number 11, 6 × 10⁴ and 15.6 × 10⁴ happened disturbance body
= 300 0. In the circu lar cylinder D = 37.5mm (d / D = 0.107) the reduction o f drag pressure
coefficient (Cdp) at Reynolds number 11.6 x 10⁴ and 15.6 x10⁴ occurs at the disturbance body position 0, 0 0.
Keywords: turbulence Intensity, disturbance body, circular cylinder
INTRODUCTION
Research on flu id flow across a single circular cylinder was performed [1]. This study ma inly process secondary data obtained fro m previous studies by discussing the interaction between flu id flows with c ircular cylinder. It is concluded that the fluid flo w will transition fro m la minar flo w to turbulent until the flow separation phenomenon occurs. This phenomenon is strongly influenced by several factors, name ly by the speed of free-strea m and flow profile , free -stream turbulence, objects (geometry and orientation toward the flow direction), and the roughness of the surface of the object.
This study was conducted [2]. The configuration used is a circular cylinder tested on Reynolds number 4x10⁴ to 3x10⁵, that the value of
the Cd will decrease as the turbulence intensity
increases on the same Reynolds number. Fro m the above conditions we can conclude the correlation between the turbulence intensity to the Cd value,
which the Cd value will decrease along with the
increase of turbulence intensity on the same Reynolds number.
Refe rence [3] conducted a study with Digital Partic le Image Velocimetry (DPIV) method, he used a circular cylinder test object with a diameter of 20 mm. Th is research was conducted in close
loop free surface water channel with width = 1000 mm, length = 8000 mm and height = 750 mm. Reynolds number based on circular cylinder intensity is 0.2%, when using circular cylinder, it is found that turbulent energy content at certain frequency fluctuates. The largest turbulent energy content at 1.8 Hz frequency is worth 50, it can be seen that the use of circular cy linder can cause an increase in turbulence intensity value this can be seen on the value of turbulent energy content.
Refe rence [4] they also see the influence of Reynolds Nu mbers value to the decrease of drag force. It appears that the effect of Reynolds number significantly on the drag force drop and the optimu m conditions obtained for the reduction of drag coefficient and total drag coeffic ient by using a disturbing rod with dia meter ratio d / D = 0.25, the ratio o f L / D d istance = 2.0 to Re <41000 and the ratio distance L / D 1.75 to Re > 41000. Decrease in CD and CDT values was 73% and 63%.
Refe rence [5] conducted a study to reduce the drag force on a single cylinder by using a bulb rod on the upper side with the direction of cloc kwise and counter-clockwise movement for the lo wer side of the main cylinder circle with smaller dimensions. The movement angle of the interference rods starts from ( 0) to ( 0)
Proceedings of 4th UNP International Conference on Technical and Vocation Education and Training November 09-11, 2017, Padang, Indonesia
Int. J. of GEOMATE, Month, Year, Vol.00, No.00 (Sl. No. 00), pp. 00 -00
4th International Conference on Technical and Vocation Education and Training
Padang : November 9-11, 2017
with constant gap = 0.4mm between the cylinder rod with the ma in cylinder c ircle. Va riations of annoying rods using different diameters (d) (4mm, 5mm and 6mm). While the ma in c ircula r cy linder dia meter D = 49mm. Fro m e xperiment of drag coefficient value on circular cy linder of constant tendency to the gap treatment between cylinder rod with ma in c ircu lar cy linder for d / D_ <0.15, then for further research
Refe rence [5] conducted experiments at position on the drag coefficient (Cd) in the case of
a disturbing rod with a diameter of 4mm, 5mm, and 6 mm.The study was conducted on a la rge rectangular wind tunnel with dimensions (p x l x t) 250 c m x 30 c m x 120 c m at Reynolds number 5.5 x 10⁴. The purpose of this study was to determine
the optima l position of the intruder rod in reducing the drag force on the main circular cylinder.
Fro m e xperiment o f d rag coeffic ient value on circular cy linder of constant tendency to the gap treatment between cylinder rod with main circu lar cylinder for d / D <0.15, then for further research Refe rence [5] conducted experiments at 0.4mm ion on the drag coefficient (Cd) in the case of a disturbing
rod with a dia meter of 4mm, 5mm, and 6 mm, the value of drag coefficient (Cd) by using a disturbing
300, value C
d decreased by
67%. Th is occurs because the wake that is detached from the disturbing rod does not undergo reattachment on the surface of the main circu lar cylinder causing disturbance in the main cylinder border layer. With the disruption of making the flow more turbulent so as to counter the adverse pressure gradient and delayed separation point that
0 for the position of the disturbing 0 and 0distribution of the pressure
coefficient (Cp)
450 600 the drag coeffic ient value (C d) rises
higher than the coeffic ient value of drag (Cd) of
this circula r cylinder due to a separate boundary layer of the main c ircular cylinder forced to disrupt the outer stem of the cylinder (b) The distribution of the pressure coefficient (Cp) shows the
0 indicating
the value of drag coefficient (Cd) is greater because
wake the resulting greater.
Flu id flow ce rtainly requires the media as a channel for the process of flowing. With the e xistence of this channel, the fluid is easier to be directed to the flow rate although channel usage also has an effect on the fluid characteristics. One of them is the coefficient of fluid resistance which becomes higher than without the channel.
By not forgetting the dimensions of the object to be tested (bluff body) in the aisle of th e wind that influences the flow of flu id [6] has e xa mined the effect of the ratio of bluff body dimension to
channel width to fluid ve locity and the coeffic ient of resistance. This influence is known as blockage effect. Th is blockage effect ma kes the free stream speed faster (at the point where the ma ximu m blockage ratio) than its real ve locity due to the narrowing of the flu id able a rea. Fro m [7] research, they also show the results of Allen and Vincenti research that corrected the speed obtained. Allen and Vincenti's formu lation of the free stream speed correction along with correction of the fluid resistance coefficient was obtained from Weidman's (1968) study and the barrier coeffic ient correction graph was obtained from [7]
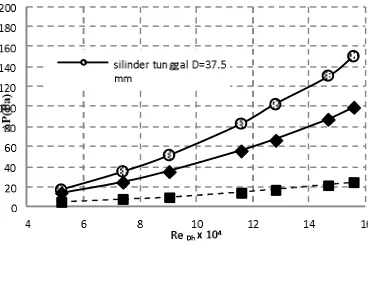
The experiments performed by [8] produced a graph of the 2.16 pressure drop shown in the figure below. Fro m the graph, we can see that the influence of the magnitude of the distance s / D (the distance of the two cylinders), the diameter of the cylinder, the cylinder shape and the Reynolds number to the pressure drop. Seen in the same Reynolds number condition, the lowest pressure drop is in use of distance s / D = 2.5 by using 25mm d ia meter cylinder. This pressure drop value is lower than single cylinder (s / D = 0).
Fro m the above s tudies came the thought to conduct research on the effort to reduce pressure drop on the narrow channel with square section by adding circula r cylindrical d isrupting rods arranged in the upper and lowe r c ircula r cy linders ma in and re lation to the intensity of turbulence produced.
2. METHODOLOGY
Here is a scheme of research to be done. Figure 1 shows the location of the test specimen and the distorting bar in the form of a cylindrica l, plain surface mounted on the upper side and lower side of the ma in circula r cylinder and carried out in a narrow channel with a square section. The disrupting rod will be placed at
to the upstream of the = 0.4mm), with the direction of clockwise shift for upper side and counter-clockwise for the lo wer side of the ma in circula r cylinder. This e xperiment was carried out using a wind tunnel with an open circuit type subsonic wind tunnel. The dimensions of the channels used are square-shaped with dimensions of 125mm x 125mm x 2000mm. Also placed pressure tap on the four sides of the channel. The placement of pressure tap 1 located 600 mm fro m the beginning of the wind aisle. While pressure tap 2 is located at 600mm behind pressure tap 1. 600mm d istance between pressure tap 1 and 2 is the test section area wh ich becomes the pressure measurement area in this experiment.
Int. J. of GEOMATE, Month, Year, Vol.00, No.00 (Sl. No. 00), pp. 00 -00
Fakultas Tekn ik, Universitas Negeri Padang
4th International Conference on Technical and Vocation Education and Training
Padang : November 9-11, 2017
Figure 1. Wind tunnel scheme with the main cylinder circular configuration as well as the
position of the disturbing rod
The specimens used in this experiment are circular cylinders with dia meter D = 25mm and 37.5mm. As well as disturbing cylinder disturbing dia meter d = 4mm with pla in surface. The main cylinder is made of a pvc pipe while fo r the bully cylinder is made of brass rod. The resulting blockage ratio is 26.4% and 36.4%.This e xperiment uses the same Reynolds number as e xperiment,
11.6x10
4and
15.6x10
4.
Determination of Reynolds number is based on wind tunnel hydraulic diameter.
The pressure on the wind tunnel is measured at a pressure tap connected with an Omega PX655 pressure transducer. This pressure tap gives a current reading in the range of 4mA -20mA, data fro m p ressure transducer is read with DA QPRO-5300 Omega acquisition data. Pressure data from the pressure readout results are calibrated to produce accurate data.
3. RESULT AND DISCUSSION
The pressure drop values generated by a single circular cylinder contained in a channel with D = 25mm and 37.5mm d ia meters placed in the test section are a 125mmx125mmx600mm square-shaped cross section. It can be seen that with the addition of a circular cy linder in the channel contributes to the increase in pressure drop.
Figure 2. Pressure drop value Single cylinder and empty channel
The analysis that can be done fro m Figure 2 is the value of pressure drop function of Reynolds Nu mbers. As the Reynolds value increases, the pressure drop values increase both on empty channels and on channels with a single circu lar cylinder. This increase in pressure drop rate is contributed by the speed components contained in the Reynolds number. This means that any increase in Reynolds value will increase the pressure drop and will produce a p ressure drop graph similar to the parabolic graph (quadratic equation).
Drag Pressure Coefficient Analysis (Cdp)
Further analysis that can be e xplained to clarify the phenomenon in the fluid flow contained cylinder configuration is the analysis of drag pressure coefficient (Cdp) obtained by integrating the value of pressure coefficient distribution (Cp) using numerica l method of Simpson rule 1/3 double segment.
At D = 25mm (d / D = 0.16) with Reynolds number 11.6 × 10⁴and 15.6 × 10⁴. Experimental
results can be seen in table 1 with each configuration.
Table 1. Drag Pressure Coefficient (Cdp) Configurat ion ReDh=11.6×10⁴ ReDh=15.6×10⁴
D= 25 mm D= 25 mm
Single Cylinder 1.17 1.25
0
0.80 0.89
0
0.70 0.80
0
1.53 1.60
0
1.82 1.93
0 2.04 2.18
Fro m table 1 we can see how the ability of the use of rods in reducing drag force on the main circular cy linder by looking at the value of d rag pressure coefficient (Cdp)for more details we can see in Figure 3 the best position graph for the reduction of drag force
Int. J. of GEOMATE, Month, Year, Vol.00, No.00 (Sl. No. 00), pp. 00 -00
4th International Conference on Technical and Vocation Education and Training
Padang : November 9-11, 2017
Figure 3. Comparison of drag pressure coefficient (Cdp) in each configuration D = 25mm (d / D = 0.16) with variation of cylinder disturbance body
(CDB)
The first analysis we can do is the value of drag pressure coeffic ient (Cdp) on Reynolds variation 11.6 × 10⁴lowe r when co mpared with
Reynolds number 15.6 × 10⁴. In the condition here
there is an interesting thing that is with the increase of Reynolds number then the value of drag pressure coefficient (Cdp) is also increased, this condition is slightly different if the fluid flow across a cylinder is generally with increasing Reynolds number then the drag force on the circular cy linder will decrease if This phenomenon occurs in channels that have small b lockage ratios. These different conditions we re influenced by the value of blockage ratio. The b lockage rat io that is owned by this configuration is 26.4% so that with the rise of the Reynolds number makes the fluid flow more quic kly distorted due to the interaction of the main circular cylinder with the channel wall. This condition is inseparable from the influence of wall shear layer is released so that it affects the separation point of the circula r cylinder. However, with the use of annoying rods still able to reduce the drag force on the circula r cylinder. Fro m the experimental result, it is found that the most effective position to reduce drag force on circular cy linder at Reynolds number 11.6 × 10⁴
0 equal to
Reynolds number 15.6 × 10⁴with disturbed stem
0 0 of 28.8%.
0 0
600 the use of annoying rods is no longer effective
in reducing the drag force in circular cylinders, it proves by increas ing the value of d rag pressure
coefficient (Cdp) fo r both variations of Reynolds number of stroke use.
At D = 37.5mm (d / D = 0.107) on Reynolds number 11.6 × 10⁴ and 15.6 × 10⁴. The results of
the experiment can be seen in table 2 with each configuration.
Table 2 Drag Pressure Coefficient (Cdp) Configurat ion ReDh=11.6×10⁴ ReDh=15.6×10⁴
D= 37.5 mm D= 37.5 mm
Single cylinder 1.62 1.73
0
1.08 1.16
0
0.88 0.96
0
1.04 1.13
0 2.04 2.13
0
2.51 2.65
The results from table 2 will be digra fikan to ma ke it easier to see the best position of the disturbing rod in reducing the drag force on the circular cylinder, this will be shown in Figure 4.
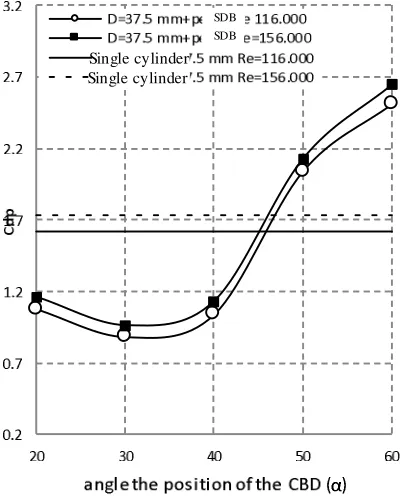
Figure 4 Comparison of drag pressure coefficient (Cdp) in each configuration D = 37.5mm (d / D = 0.107) with variation of cylinder disturbance body
(CDB)
The phenomenon that occurs almost the same as the previous circular cy linder drag pressure coefficient (Cdp) on Reynolds variation 11.6 × 10⁴tends to be lower when co mpared to Reynolds
number 15.6 × 10⁴. Different things that happen
here is a slightly different condition that this configuration has a blockage rat io of 36.4% . This in turn greatly a ffects the ability of the rods in reducing the drag force on the circula r cylinder. By looking at the value of drag pressure coefficient
SDB SDB
Single cy linder Single cy linder
Single cylinder
SDB SDB
Single cylinder
Int. J. of GEOMATE, Month, Year, Vol.00, No.00 (Sl. No. 00), pp. 00 -00
Fakultas Tekn ik, Universitas Negeri Padang
4th International Conference on Technical and Vocation Education and Training
Padang : November 9-11, 2017
(Cdp) the annoying rod is still the ability to reduce the drag force on the circular cy linder to the disturbing stem position 0on both variations
of the Reynolds number. The best inhibition position (Cdp) in Reynolds 11.6 × 10⁴variat ion
occurs in the position of 0of 45,68% position
of 0equal to 35,80% and at position of
200equal to 33,33%. Simila rly, the Reynolds 15.6
× 104variation occurs. The best reduction occurs at
the position of 0of 44.51% and then the
position of 0of 34.68% and at the position of 0of 32.95%.
Turbulence Intensity Analysis
The turbulence intensity data in this study was taken on Reynolds variation o f 11.6 × 10⁴ 4 and
15.6 × 10⁴. Turbulence intensity value in th is study
is obtained from the comparison between fluctuations in velocity and mean veloc ity on the flow behind the specimen. Placement of a disturbed rod on the upper and lower circu lar cylinders is e xpected to accelerate the flow of transition from laminar to turbulent.
Turbulence intensity value obtained by processing the value of fluctuations in speed behind the circular cy linder. The value of veloc ity fluctuation is obtained by convert ing the dyna mic pressure value behind the circular cylinder fro m the Pitot static tube measurement. Pitot static tube is placed 2D behind the test specimen or circu lar cylinder and paralle l to the outer diameter of the circular cylinder. This position was chosen based on the results of research by Tsutsui and Igarashi (2002) that in that position there is no back flow and quite fluctuating speed.
Table 3 Tabulation of Turbulence Intensity Data Collection
Based on the above calculation because the ability of data acquisition in the data retrieval above 2500 per second closest to the number 2500 per second is 4000 data per second. So the author to capture data as much as 4000 data every second.
On a single cylinder
Fluctuations in the flow velocity behind the circular cylinder for va riat ions D = 25mm (d / D = 0.16) and D = 37.5mm (d / D = 0.107) at Reynolds number 11.6 × 10⁴ and 15.6 × 10⁴. The fluctuations
shown by this figure indicate that the presence of circular cylinders and the rise of the Reynolds number can increase the intensity of turbulence behind the cylinder. From this velocity fluctuation obtained standard deviation and average speed at one point which can then be processed into
turbulence intensity.
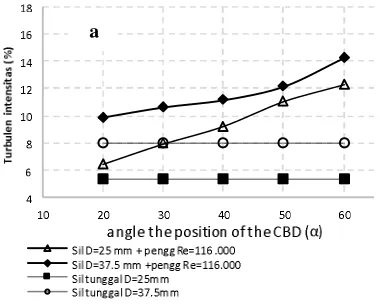
The experimental results of the turbulence intensity value on the confounding stem rod position configuration against the main circular len Table 4. Co mparison of Turbulence Intensity Value in Circula r Cy linder D = 25mm (d / D = 0.16) with cylinder disturbance body (CDB)
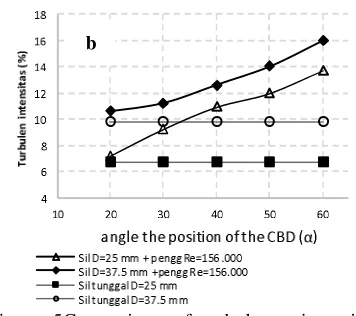
Table 5 Co mparison of Turbulence Intensity Value in Circula r Cy linder D = 37.5mm (d / D = 0.107) with cylinder disturbance body (CDB)
In table 5 for a single circu lar cylinder at D = 25mm with Reynolds number 11.6 × 10⁴ yields a
turbulence intensity value of 5.4% and at D = 25mm with Reynolds number 15.6 × 10⁴turbulence
intensity value of 6.72% done is with the increase of Reynolds number then the intensity value will also increase. In table 5 for D = 37,5mm with Reynolds number 11.6 × 10⁴ yie lds turbulence
intensity 7,95% and Reynolds number 15.6 × 10⁴produces turbulence intensity 9,81% here
turbulence intensity value increases with increasing number of Reynolds. In addition, the analysis that can be done is that the turbulence intensity value is b lockage ratio where in the variation D = 25mm with the blockage ratio of 26.4% turbulence intensity is lower co mpared to D = 37.5 mm with the blockage ratio of 36.4% this is influenced by the speed of fluctuation resulting from the narrowing of the cross.
a
Int. J. of GEOMATE, Month, Year, Vol.00, No.00 (Sl. No. 00), pp. 00 -00
4th International Conference on Technical and Vocation Education and Training
Padang : November 9-11, 2017
Figure 5Co mparison of turbulence intensity graphs (a) on Reynolds number 11.6 × 10⁴ and (b)
Reynolds number 15.6 × 10⁴
The turbulence intensity value is increased. This condition is influenced by several things: the first is the position of the
turbulent value of intensity will also increase due to the wake interaction that is detached from the disturbing rod. The second increase of turbulence intensity is influenced by the increase of Reynolds number, the higher the Rey nolds number, the intensity value will also increase.
This condition occurs at the position of the disturbing stem of variation D = 25mm (d / D =
0 0 and at variation D = 0 0
400 if we corre late the increase of turbulence
intensity value contribute in reducing the coefficient value o f drag pressure (Cdp). Enhance
0
= 500 0 and variation at D = 37.5mm (d /
500 0 if connected
with the value of drag pressure coefficient (Cdp) generated then the increase of turbulence intensity value e xperienced an inverse state that is with the increase of turbulence intensity value also resulted in the increase of drag pressure coefficient (Cdp). 4. CONCLUSION
the use of a distorting rod to reduce the drag force on a c ircula r cy linder is highly e ffective at position 0 300 for circular cy linders
of 25 mm dia meter and position 0 0and 0for circular cylinders 37.5 mm in d ia meter,
while an increase in turbulence intensity value is only effective in the above mentioned positions.
While at 0 0 0 0circu lar
cylinder with 25 mm d ia meter not effective, and also at position = 500 600 for c ircu lar
cylinder diameter 37.5 mm also not effective. 5. REFERENCES
[1] Nie mann, H.J. &Holscher, N., A review of recent experiment on the flow past circula r cylinders, Journal of Wind Eng ineering and Industrial Aerodynamics, Vol. 33, 1990, pp197-209.
[2] Bearman P.W., & Morel T., Effect of Free Stream Tu rbulence on the Flo w Around Bluff Bodies, Depart ment of Aeronautics, Imperia l College, London, UK, 1969.
[3] Ozgoren, M. Flow Structure in the Down Stream of Square and Circular Cy linders, Selcuk Un iversity, Faculty of Engineering and Architecture, Departe ment Mechanical of Engineering, Turkey. 2005
[4] Tsutsui,T., &Igarashi,T., Drag reduction of a circular cylinder in an air-strea m, Journa l of Wind Engineering and Industrial Aerodynamics Vol.90, 2002, pp 527-541. [5] Alam, M .M., Sa ka moto, &H., Moriya,.
circular cy linder and two circular cylinders by using tripping rods, Journal of Wind Engineering and Industrial Aerodynamics, Vol.91, 2003, pp 139-154.
[6] Weidman, P.D., Tesis: Wake Transition and Blockage Effect on Cylinder base Pressure, Ca lifornia Institute of Technology, Pasadena, 1968
[7] Be ll, W.H., Turbulence vs Drag some further consideration, Ocean Engineering, Vol.10, No.1, 1983, pp, 47-63.
[8] Daloglu, A., Pressure drop in a channel with cylinder in tandem arrangement, International Co mmunication in Heat and Mass Transfer, Vol.35,2008.pp. 76-83.
6. BIOGRAPHY
Nuzul Hidayat, born in TigoSuku, January 16, 1987. Bachelor of Education in the Department of
Automotive Engineering FT
UNP 2010. In 2013 has a Masters of Engineering degree ma joring in Mechanical Engineering Graduate Institute of
Institut Teknologi Sepuluh
Nopember (ITS) Surabaya with the fie ld study of
Energy Conversion Engineering. Lecturer at the Department of Automotive Engineering FT UNP since 2013-present. His contact E-mail is [email protected]b