Splunk Operational
Intelligence Cookbook
Over 70 practical recipes to gain operational data
intelligence with Splunk Enterprise
Josh Diakun
Paul R Johnson
Derek Mock
Splunk Operational Intelligence Cookbook
Copyright © 2014 Packt Publishing
All rights reserved. No part of this book may be reproduced, stored in a retrieval system, or transmitted in any form or by any means, without the prior written permission of the publisher, except in the case of brief quotations embedded in critical articles or reviews.
Every effort has been made in the preparation of this book to ensure the accuracy of the information presented. However, the information contained in this book is sold without warranty, either express or implied. Neither the authors, nor Packt Publishing, and its dealers and distributors will be held liable for any damages caused or alleged to be caused directly or indirectly by this book.
Packt Publishing has endeavored to provide trademark information about all of the companies and products mentioned in this book by the appropriate use of capitals. However, Packt Publishing cannot guarantee the accuracy of this information.
First published: October 2014
Production reference: 1241014
Published by Packt Publishing Ltd. Livery Place
35 Livery Street
Birmingham B3 2PB, UK.
ISBN 978-1-84969-784-2
www.packtpub.com
About the Authors
Josh Diakun is an IT operations and security specialist with a focus on creating data-driven
operational processes. He has over 10 years of experience in managing and architecting enterprise grade IT environments. For the past 5 years, he was managing a Splunkdeployment that saw Splunk used as the platform for security and operational intelligence. Most recently, Josh has partnered in setting up a business venture, Discovered Intelligence, which provides data intelligence solutions and services to the marketplace. He is also a cofounder of the Splunk Toronto User Group.
I would first like to thank my co-authors, Derek Mock and Paul R Johnson,
for their support, endless efforts, and those many late nights that led to this book becoming a reality. To my partner, Rachel—an endless thank you for being my biggest supporter and making sure I always remembered to take a break. To my mother, Denyce, and sister, Jessika—thank you for being the two most amazing people in my life and cheering me on as I wrote this book. Finally, to my late father, John, who was always an inspiration and brought the best out of me; without him, I would not be where I am today.
Paul R Johnson has over 10 years of data intelligence experience in the areas
of information security, operations, and compliance. He is a partner at Discovered Intelligence—a company that specializes in data intelligence services and solutions. He previously worked for a Fortune 10 company, leading IT risk intelligence initiatives and managing a global Splunk deployment. Paul cofounded the Splunk Toronto User Group and lives and works in Toronto, Canada.Derek Mock
is a software developer and architect, specializing in unified communicationsand cloud technologies. Derek has over 15 years of experience in developing and operating large enterprise-grade deployments and SaaS applications. For the past 4 years, he has been leveraging Splunk as the core tool to deliver key operational intelligence. Derek is a cofounder of the Splunk Toronto User Group and lives and works in Toronto, Canada.
About the Reviewers
Mika Borner is a management consultant for data analytics at LC Systems based in
Switzerland, Germany, and Austria.Drawing on his years of experience, he provides Splunk consulting in the telecommunications/
ISP, financial, retail, and other industries. During the course of his career, he has held
numerous positions in systems engineering in IT, with service providers, telecommunications/
ISP companies, and financial institutions.
Mika was one of the first Splunk users in Europe and was later running one of the largest
Splunk environments worldwide. He is also a regular speaker at the Splunk User Conference.
Amit Mund has been working on Linux and other technologies on automation and
infrastructure monitoring since 2004. He is currently associated with Akamai Technologies and has previously worked for the website-hosting teams at Amazon and Yahoo!.Jon Webster
has been fascinated with computers since he met his first mainframe atHewlett-Packard at the age of 11 and played chess and Qubic on it.
In his roles from an ERP Developer through APM Product Manager and Splunk Architect, Jon has always sought to apply the maximum leverage that technology offers for his
customers' benefit.
I'd like to thank my parents for encouraging me to explore these strange things they didn't understand, David Kleber and Kennon Ward for helping me learn how to optimize my code and my career, PeopleSoft for the amazing playgrounds and opportunities, Alan Habib for dragging me into
APM (just attend one meeting!), and finally, Splunk for the most amazing
www.PacktPub.com
Support files, eBooks, discount offers, and more
You might want to visit www.PacktPub.com for support files and downloads related to your book.Did you know that Packt offers eBook versions of every book published, with PDF and ePub
files available? You can upgrade to the eBook version at www.PacktPub.com and as a print book customer, you are entitled to a discount on the eBook copy. Get in touch with us at [email protected] for more details.
At www.PacktPub.com, you can also read a collection of free technical articles, sign up for a range of free newsletters and receive exclusive discounts and offers on Packt books and eBooks.
TM
http://PacktLib.PacktPub.com
Do you need instant solutions to your IT questions? PacktLib is Packt's online digital book
library. Here, you can access, read and search across Packt's entire library of books.
Why subscribe?
f Fully searchable across every book published by Packt f Copy and paste, print and bookmark content
f On demand and accessible via web browser
Free access for Packt account holders
Table of Contents
Preface 1
Chapter 1: Play Time – Getting Data In
7
Introduction 7
Indexing files and directories 8
Getting data through network ports 15
Using scripted inputs 19
Using modular inputs 22
Using the Universal Forwarder to gather data 26
Loading the sample data for this book 30
Defining field extractions 33
Defining event types and tags 36
Summary 40
Chapter 2: Diving into Data – Search and Report
41
Introduction 41
Making raw event data readable 45
Finding the most accessed web pages 49
Finding the most used web browsers 52
Identifying the top-referring websites 55
Charting web page response codes 58
Displaying web page response time statistics 60
Listing the top viewed products 64
Charting the application's functional performance 67
Charting the application's memory usage 70
Counting the total number of database connections 72
Table of Contents
Chapter 3: Dashboards and Visualizations – Make Data Shine
75
Introduction 76
Creating an Operational Intelligence dashboard 79
Using a pie chart to show the most accessed web pages 82 Displaying the unique number of visitors 87
Using a gauge to display the number of errors 92
Charting the number of method requests by type and host 96 Creating a timechart of method requests, views, and response times 98 Using a scatter chart to identify discrete requests by size and
response time 102
Creating an area chart of the application's functional statistics 105 Using a bar chart to show the average amount spent by category 108 Creating a line chart of item views and purchases over time 111 Summary 113
Chapter 4: Building an Operational Intelligence Application
115
Introduction 115
Creating an Operational Intelligence application 117
Adding dashboards and reports 121
Organizing the dashboards more efficiently 127
Dynamically drilling down on activity reports 132
Creating a form to search web activities 137
Linking web page activity reports to the form 143
Displaying a geographical map of visitors 148
Scheduling the PDF delivery of a dashboard 152
Summary 156
Chapter 5: Extending Intelligence – Data Models and Pivoting
157
Introduction 157Creating a data model for web access logs 160
Creating a data model for application logs 168
Accelerating data models 173
Pivoting total sales transactions 178
Pivoting purchases by geographical location 184 Pivoting slowest responding web pages 189
Pivot charting top error codes 194
Table of Contents
Chapter 6: Diving Deeper – Advanced Searching
197
Introduction 197
Calculating the average session time on a website 199
Calculating the average execution time for multi-tier web requests 205
Displaying the maximum concurrent checkouts 212
Analyzing the relationship of web requests 217
Predicting website-traffic volumes 222
Finding abnormally sized web requests 227
Identifying potential session spoofing 233
Summary 238
Chapter 7: Enriching Data – Lookups and Workflows
239
Introduction 239
Looking up product code descriptions 241
Flagging suspicious IP addresses 248
Creating a session state table 252
Adding hostnames to IP addresses 257
Searching ARIN for a given IP address 259
Triggering a Google search for a given error 264
Creating a ticket for application errors 269
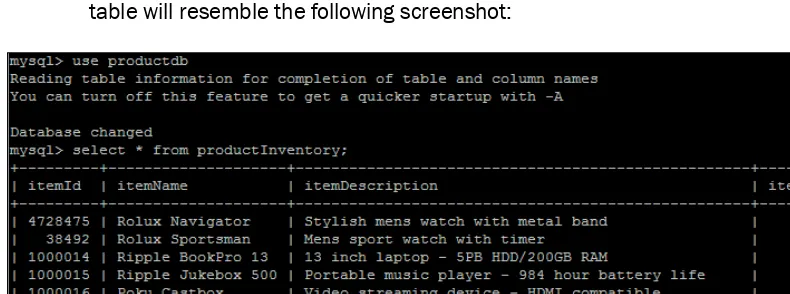
Looking up inventory from an external database 274
Summary 283
Chapter 8: Being Proactive – Creating Alerts
285
Introduction 285
Alerting on abnormal web page response times 289
Alerting on errors during checkout in real time 294
Alerting on abnormal user behavior 303
Alerting on failure and triggering a scripted response 308
Alerting when predicted sales exceed inventory 312
Summary 319
Chapter 9: Speed Up Intelligence – Data Summarization
321
Table of Contents
Chapter 10: Above and Beyond – Customization, Web Framework,
REST API, and SDKs
351
Introduction 351
Customizing the application's navigation 353
Adding a force-directed graph of web hits 358 Adding a calendar heatmap of product purchases 368 Remotely querying Splunk's REST API for unique page views 374 Creating a Python application to return unique IP addresses 377 Creating a custom search command to format product names 382
Summary 388
Preface
In a technology-centric world, where machines generate a vast amount of data at anincredibly high volume, Splunk has come up with its industry-leading big data intelligence platform—Splunk Enterprise. This powerful platform enables anyone to turn machine data into actionable and very valuable intelligence.
Splunk Operational Intelligence Cookbook is a collection of recipes that aim to provide you, the reader, with the guidance and practical knowledge to harness the endless features of Splunk Enterprise 6 for the purpose of deriving extremely powerful and valuable operational intelligence from your data.
Using easy-to-follow, step-by-step recipes, this book will teach you how to effectively gather, analyze, and create a report on the operational data available in your environment. The recipes provided will demonstrate methods to expedite the delivery of intelligent reports and empower you to present data in a meaningful way through dashboards and by applying many of the visualizations available in Splunk Enterprise. By the end of this book, you will have built a powerful Operational Intelligence application and applied many of the key features found in the Splunk Enterprise platform.
This book and its easy-to-follow recipes can also be extended to act as a teaching tool for you as you introduce others to the Splunk Enterprise platform and to your new found ability to provide promotion-worthy operational intelligence.
What this book covers
Chapter 1, Play Time – Getting Data In, introduces you to the many ways in which data can
be put into Splunk, whether it is by collecting data locally from files and directories, through
Chapter 2, Diving into Data – Search and Report, will provide an introduction to the first set of recipes in this book. Leveraging data now available as a result of the previous chapter, the information and recipes provided here will act as a guide, walking you through searching event
data using Splunk's SPL (Search Processing Language); applying field extractions; grouping common events based on field values; and then building basic reports using the table, top,
chart, and stats commands.
Chapter 3, Dashboards and Visualizations – Make Data Shine, acts as a guide to building visualizations based on reports that can now be created as a result of the information and recipes provided in the previous chapter. This chapter will empower you to take your data and reports and bring them to life through the powerful visualizations provided by Splunk. The visualizations that are introduced will include single values, charts (bar, pie, line, and area), scatter charts, and gauges.
Chapter 4, Building an Operational Intelligence Application, builds on the understanding of visualizations that you have gained as a result of the previous chapter and introduces the concept of dashboards. The information and recipes provided in this chapter will outline the purpose of dashboards and teach you how to properly utilize dashboards, use the dashboard editor to build a dashboard, build a form to search event data, and much more.
Chapter 5, Extending Intelligence – Data Models and Pivoting, will take you deeper into the data by introducing transactions, subsearching, concurrency, associations, and more advanced search commands. Through the information and recipes provided in this chapter, you will harness the ability to converge data from different sources and understand how to build relationships between differing event data.
Chapter 6, Diving Deeper – Advanced Searching, will introduce the concept of lookups and
workflow actions for the purpose of augmenting the data being analyzed. The recipes provided
will enable you to apply this core functionality to further enhance your understanding of the data being analyzed.
Chapter 7, Enriching Data – Lookups and Workflows, explains how scheduled or real-time alerts are a key asset to complete operational intelligence and awareness. This chapter will
introduce you to the concepts and benefits of proactive alerts, and provide context for when
these alerts are best applied. The recipes provided will guide you through creating alerts based on the knowledge gained from previous chapters.
Chapter 9, Speed Up Intelligence – Data Summarization, introduces two of the newest and most powerful features released as part of Splunk Enterprise Version 6: data models and the Pivot tool. The recipes provided in this chapter will guide you through the concept of building data models and using the Pivot tool to quickly design intelligent reports based on the constructed models.
Chapter 10, Above and Beyond – Customization, Web Framework, REST API, and SDKs, is
the final chapter of the book and will introduce you to four very powerful features of Splunk.
These features provide the ability to create a very rich and powerful interactive experience with Splunk. The recipes provided will open you up to the possibilities beyond core Splunk Enterprise and a method to make your own Operational Intelligence application that includes powerful D3 visualizations. Beyond this, it will also provide a recipe to query Splunk's REST API and a basic Python application to leverage Splunk's SDK to execute a search.
What you need for this book
To follow along with the recipes provided in this book, you will need an installation of Splunk Enterprise 6 and the sample data that is made available with this book. The recipes are intended to be portable to all Splunk Enterprise environments, but for best results, we suggest that you use the samples provided with this book.
Splunk Enterprise 6 can be downloaded for free for most major platforms from http://www. splunk.com/download.
The samples provided with this book will also be packaged with the Splunk Event Generator tool so that the event data can be refreshed or events can be replayed as new as you work through the recipes.
Who this book is for
This book is intended for all users, beginner or advanced, who are looking to leverage the Splunk Enterprise platform as a valuable Operational Intelligence tool. The recipes provided in this book will appeal to individuals from all facets of a business—IT, security, product, marketing, and many more!
Although the book and its recipes are written so that anyone can follow along, it does progress at a steady pace into concepts or features that might not be common knowledge to a beginner. If there exists the necessity to understand more about a feature, Splunk has produced a vast amount of documentation on all Splunk Enterprise features available at http://docs.splunk.com/Documentation/Splunk.
There might also be sections that utilize regular expressions and introduce recipes that take advantage of the Python and XML languages. Experience with these concepts is not required
Conventions
In this book, you will find a number of styles of text that distinguish between different kinds of
information. Here are some examples of these styles, and an explanation of their meaning.
Code words in text, database table names, folder names, filenames, file extensions, pathnames, dummy URLs, user input, and Twitter handles are shown as follows: "The field
values are displayed in a table using the table command." A block of code is set as follows:
<table>
<searchString>
index=opintel status=404 | stats count by src_ip </searchString>
<title>Report – 404 Errors by Source IP</title>
When we wish to draw your attention to a particular part of a code block, the relevant lines or items are set in bold:
<table>
<searchString>
index=opintel status=404 | stats count by src_ip
</searchString>
<title>Report – 404 Errors by Source IP</title>
Any command-line input or output is written as follows:
./splunk add monitor /var/log/messages –sourcetype linux_messages
New terms and important words are shown in bold. Words that you see on the screen, in menus or dialog boxes for example, appear in the text like this: "Quickly create a report by navigating to Save As | Report above the search bar."
Warnings or important notes appear in a box like this.
Tips and tricks appear like this.
Reader feedback
To send us general feedback, simply send an e-mail to [email protected], and mention the book title via the subject of your message.
If there is a topic that you have expertise in and you are interested in either writing or contributing to a book, see our author guide on www.packtpub.com/authors.
Customer support
Now that you are the proud owner of a Packt book, we have a number of things to help you to get the most from your purchase.
Downloading the example code
You can download the example code files for all Packt books you have purchased from your
account at http://www.packtpub.com. If you purchased this book elsewhere, you can visit http://www.packtpub.com/support and register to have the files e-mailed directly to you.
Errata
Although we have taken every care to ensure the accuracy of our content, mistakes do happen.
If you find a mistake in one of our books—maybe a mistake in the text or the code—we would be
grateful if you would report this to us. By doing so, you can save other readers from frustration
and help us improve subsequent versions of this book. If you find any errata, please report them
by visiting http://www.packtpub.com/submit-errata, selecting your book, clicking on the erratasubmissionform link, and entering the details of your errata. Once your errata are
verified, your submission will be accepted and the errata will be uploaded on our website, or
added to any list of existing errata, under the Errata section of that title. Any existing errata can be viewed by selecting your title from http://www.packtpub.com/support.
Piracy
Piracy of copyright material on the Internet is an ongoing problem across all media. At Packt, we take the protection of our copyright and licenses very seriously. If you come across any illegal copies of our works, in any form, on the Internet, please provide us with the location address or website name immediately so that we can pursue a remedy.
Please contact us at [email protected] with a link to the suspected pirated material. We appreciate your help in protecting our authors, and our ability to bring you valuable content.
Questions
1
Play Time – Getting
Data In
In this chapter, we will cover the basic ways to get data into Splunk. You will learn about:
f Indexing files and directories f Getting data through network ports f Using scripted inputs
f Using modular inputs
f Using the Universal Forwarder to gather data f Loading the sample data for this book f Defining field extractions
f Defining event types and tags
Introduction
The machine data that facilitates operational intelligence comes in many different forms and from many different sources. Splunk is able to collect and index data from many different sources, including logfiles written by web servers or business applications, syslog data streaming in from network devices, or the output of custom developed scripts. Even data that
looks complex at first can be easily collected, indexed, transformed, and presented back to
This chapter will walk you through the basic recipes that will act as the building blocks to get the data you want into Splunk. The chapter will further serve as an introduction to the sample datasets that we will use to build our own Operational Intelligence Splunk app. The datasets will be coming from a hypothetical, three-tier, e-commerce web application and will contain web server logs, application logs, and database logs.
Splunk Enterprise can index any type of data; however, it works best with time-series data (data with timestamps). When Splunk Enterprise indexes data, it breaks it into events, based on timestamps and/or event size, and puts them into indexes. Indexes are data stores that Splunk has engineered to be very fast, searchable, and scalable across a distributed server environment; they are commonly referred to as indexers. This is also why we refer to the data being put into Splunk as being indexed.
All data indexed into Splunk is assigned a source type. The source type helps identify the data format type of the event and where it has come from. Splunk has a number of
preconfigured source types, but you can also specify your own. The example sourcetypes
include access_combined, cisco_syslog, and linux_secure. The source type is
added to the data when the indexer indexes it into Splunk. It is a key field that is used when performing field extractions and in many searches to filter the data being searched.
The Splunk community plays a big part in making it easy to get data into Splunk. The ability to extend Splunk has provided the opportunity for the development of inputs, commands, and applications that can be easily shared. If there is a particular system or application you are looking to index data from, there is most likely someone who has developed and
published relevant configurations and tools that can be easily leveraged by your own Splunk
Enterprise deployment.
Splunk Enterprise is designed to make the collection of data very easy, and it will not take long before you are being asked or you yourself try to get as much data into Splunk as possible—at least as much as your license will allow for!
Indexing files and directories
File- and directory-based inputs are the most commonly used ways of getting data into Splunk.
The primary need for these types of inputs will be to index logfiles. Almost every application or system will produce a logfile, and it is generally full of data that you would want to be able to
search and report on.
Splunk is able to continuously monitor for new data being written to existing files or new files added to a directory, and it is able to index this data in real time. Depending on the type of
This recipe will show you how to configure Splunk to continuously monitor and index the contents of a rolling logfile located on the Splunk server. The recipe specifically shows how to
monitor and index the Linux system's messages logfile (/var/log/messages). However, the
same principle can be applied to a logfile on a Windows system, and a sample file is provided. Do not attempt to index the Windows event logs this way, as Splunk has specific Windows
event inputs for this.
Getting ready
To step through this recipe, you will need a running Splunk Enterprise server and access to read the /var/log/messages file on Linux. There are no other prerequisites. If you are not using Linux and/or do not have access to the /var/log/messages location on your Splunk server, please use the cp01_messages.log file that is provided and upload it to an accessible directory on your Splunk server.
Downloading the example code
You can download the example code files for all Packt books you have
purchased from your account at http://www.packtpub.com. If you purchased this book elsewhere, you can visit http://www.packtpub. com/support and register to have the files e-mailed directly to you.
How to do it...
Follow the steps in the recipe to monitor and index the contents of a file:
1. Log in to your Splunk server.
3. In the Choose a Data Type list, click on A file or directory of files.
4. Click on Next in the Consume any file on this Splunk server option.
6. Select Start a new source type and click on Continue.
7. Assuming that you are using the provided file or the native /var/log/messages
file, the data preview will show the correct line breaking of events and timestamp
recognition. Click on the Continue button.
9. A Sourcetype saved box will appear. Select Create input.
10. In the Source section, select Continuously index data from a file or directory this
Splunk instance can access and fill in the path to your data.
If you are just looking to do a one-time upload of a file, you can select Upload and Index a file instead. This can be useful to index a set of data that you would like to put into Splunk, either to backfill some missing or incomplete data or just to take advantage of its searching and reporting tools.
11. Ignore the other settings for now and simply click on Save. Then, on the next screen, click on Start searching. In the search bar, enter the following search over a time range of All time:
sourcetype=linux_messages
How it works...
When you add a new file or directory data input, you are basically adding a new configuration
stanza into an inputs.conf file behind the scenes. The Splunk server can contain one or more inputs.conf files, and these files are either located in $SPLUNK_HOME/etc/ system/local or in the local directory of a Splunk app.
Splunk uses the monitorinput type and is set to point to either a file or a directory. If you
set the monitor to a directory, all files within that directory will be monitored. When Splunk monitors files, it initially starts by indexing all of the data that it can read from the beginning.
Once complete, Splunk will maintain a record of where it last read data from, and if any new
data comes into the file, it will read this data and advance the record. The process is nearly
identical to using the tail command in Unix-based operating systems. If you are monitoring
a directory, Splunk also provides many additional configuration options such as blacklisting files you don't want Splunk to index.
For more information on Splunk's configuration files, visit http:// docs.splunk.com/Documentation/Splunk/latest/Admin/ Aboutconfigurationfiles.
There's more...
While adding inputs to monitor files and directories can be done through the web interface
of Splunk as outlined in this recipe, there are other approaches to add multiple inputs quickly.
These allow for customization of the many configuration options that Splunk provides.
Adding a file or directory data input via the CLI
Instead of going via the GUI, you could add a file or directory input via the Splunk CLI
(command-line interface). Navigate to your $SPLUNK_HOME/bin directory and execute the following command (replacing the file or directory to be monitored with your own):
For Unix:
./splunk add monitor /var/log/messages –sourcetype linux_messages
For Windows:
splunk add monitor c:\filelocation\cp01_messages.log –sourcetype linux_messages
Adding a file or directory input via inputs.conf
Another common method of adding file and directory inputs is to manually add them to the inputs.conf configuration file directly. This approach is often used for large environments
or when configuring Splunk forwarders to monitor for files or directories on endpoints.
Edit $SPLUNK_HOME/etc/system/local/inputs.conf and add your input. After your inputs are added, Splunk will need to be restarted to recognize these changes:
For Unix:
Editing inputs.conf directly is often a much faster way of adding new
files or directories to monitor when several inputs are needed. When editing
inputs.conf, ensure that the correct syntax is used and remember
that Splunk will need a restart for modifications to take effect. Additionally,
specifying the source type in the inputs.conf file is the best practice to
assign source types.
One-time indexing of data files via the Splunk CLI
Although you can select Upload and Index a file from the Splunk GUI to upload and index
a file, there are a couple of CLI functions that can be used to perform one-time bulk loads of data.
Use the oneshotcommand to tell Splunk where the file is located and which parameters to use, such as the source type:
./splunk add oneshot XXXXXXX
Another way is to place the file you wish to index into the Splunk spool directory, $SPLUNK_ HOME/var/spool/splunk, and then add the file using the spool command:
./splunk spool XXXXXXX
Indexing the Windows event logs
Splunk comes with special inputs.conf configurations for some source types, including monitoring the Windows event logs. Typically, the Splunk Universal Forwarder (UF) would be
installed on a Windows server and configured to forward the Windows events to the Splunk indexer(s). The configurations for inputs.conf to monitor Windows security, application, and system event logs in real time are as follows:
[WinEventLog://Application]
By default, the event data will go into the main index, unless another index is specified.
See also
f The Getting data through network ports recipe f The Using scripted inputs recipe
f The Using modular inputs recipe
Getting data through network ports
Not every machine has the luxury of being able to write logfiles. Sending data over network ports and protocols is still very common. For instance, sending logs via syslog is still the
primary method to capture network device data such as firewalls, routers, and switches.
Sending data to Splunk over network ports doesn't need to be limited to network devices. Applications and scripts can use socket communication to the network ports that Splunk is listening on. This can be a very useful tool in your back pocket, as there can be scenarios
where you need to get data into Splunk but don't necessarily have the ability to write to a file. This recipe will show you how to configure Splunk to receive syslog data on a UDP network port, but it is also applicable to the TCP port configuration.
Getting ready
How to do it...
Follow the steps in the recipe to configure Splunk to receive network UDP data:
1. Log in to your Splunk server.
2. From the home launcher in the top-right corner, click on the Add Data button.
3. In the Or Choose a Data Source list, click on the From a UDP port link.
4. In the Source section, enter 514 in the UDP port field. On Unix/Linux, Splunk must
5. In the Source type section, select From list from the Set sourcetype drop-down list, and then, select syslog from the Select source type from list drop-down list.
6. Click on Save, and on the next screen, click on Start searching. Splunk is
now configured to listen on UDP port 514. Any data sent to this port now will
be assigned the syslog source type. To search for the syslog source type, you can run the following search:
sourcetype=syslog
Understandably, you will not see any data unless you happen to be sending data to your Splunk server IP on UDP port 514.
How it works...
When you add a new network port input, you are basically adding a new configuration stanza into an inputs.conf file behind the scenes. The Splunk server can contain one or more inputs.conf files, and these files are either located in the $SPLUNK_HOME/etc/system/ local or local directory of a Splunk app.
To collect data on a network port, Splunk will set up a socket to listen on the specified TCP
or UDP port and will index any data it receives on that port. For example, in this recipe, you
configured Splunk to listen on port 514 for UDP data. If data was received on that port, then
Splunk would index it and assign a syslog source type to it.
Splunk also provides many configuration options that can be used with network inputs,
such as how to resolve the host value to use on the collected data.
There's more...
While adding inputs to receive data from network ports can be done through the web interface of Splunk as outlined in this recipe, there are other approaches to add multiple inputs quickly; these inputs allow for customization of the many configuration options that Splunk provides.
Adding a network input via the CLI
You can also add a file or directory input via the Splunk CLI. Navigate to your $SPLUNK_HOME/ bin directory and execute the following command (just replace the protocol, port, and source type you wish to use):
For Unix:
./splunk add udp 514 –sourcetype syslog
For Windows:
splunk add udp 514 –sourcetype syslog
There are a number of different parameters that can be passed along with the port. See the Splunk documentation for more on data inputs using the CLI (http://docs.splunk.com/Documentation/Splunk/latest/Data/ MonitorfilesanddirectoriesusingtheCLI).
Adding a network input via inputs.conf
Network inputs can be manually added to the inputs.confconfiguration files. Edit $SPLUNK_HOME/etc/system/local/inputs.conf and add your input. You will need
to restart Splunk after modifying the file.
[udp://514]
sourcetype = syslog
It is best practice to not send syslog data directly to an indexer. Instead, always place a forwarder between the network device and the indexer. The Splunk forwarder would be set up to receive the incoming syslog data (inputs.conf) and will load balance the data across your Splunk indexers (outputs.conf). The forwarder can also be configured to cache
See also
f The Indexing files and directories recipe f The Using scripted inputs recipe f The Using modular inputs recipe
Using scripted inputs
Not all data that is useful for operational intelligence comes from logfiles or network ports. Splunk will happily take the output of a command or script and index it along with all of your other data.
Scripted inputs are a very helpful way to get that hard-to-reach data. For example, if you have third-party-supplied command-line programs that can output data you would like to collect, Splunk can run the command periodically and index the results. Typically scripted inputs are often used to pull data from a source, whereas network inputs await a push of data from a source.
This recipe will show you how to configure Splunk on an interval to execute your command
and direct the output into Splunk.
Getting ready
To step through this recipe, you will need a running Splunk server and the provided scripted input script suited to the environment you are using. For example, if you are using Windows, use the cp01_scripted_input.bat file. This script should be placed in the $SPLUNK_ HOME/bin/scripts directory. There are no other prerequisites.
How to do it...
Follow the steps in the recipe to configure a scripted input:
1. Log in to your Splunk server.
3. In the Or Choose a Data Source list, click on the Run and collect the output of a script link.
4. An Add new screen will be displayed, with a number of input fields. In the Source
section, enter the full path for the command to be run, including any command-line arguments. All scripts must be located in a Splunk bin directory, either in $SPLUNK_ HOME/bin/scripts or an appropriate bin directory in a Splunk app.
5. Enter the value in the Interval field (in seconds) in which the script is to be run;
the default value is 60.0 seconds.
6. In the Source typesection, you have the option to select a predefined source type,
Data will be indexed into Splunk's default index, which is main. To change the destination index, you can check the box labeled More Settings and select the desired index from the drop-down list.
7. Click on Save, and on the next screen, click on Start searching. Splunk is now
configured to execute the scripted input you provided every 60 seconds in accordance with the specified interval. You can search for the data returned by the scripted input
using the following search over All time:
sourcetype=cp01_scripted_input
How it works...
When adding a new scripted input, you are directing Splunk to add a new configuration stanza
into an inputs.conf file behind the scenes. The Splunk server can contain one or more inputs.conf files and these are located either in $SPLUNK_HOME/etc/system/local or the local directory of a Splunk app.
After creating a scripted input, Splunk sets up an internal timer and will execute the command
that you have specified in accordance with the defined interval. It is important to note that
Splunk will only run one instance of the script at a time, so if the script gets blocked for any reason, it will cause the script to not be executed again, until after it has been unblocked.
Since Splunk 4.2, any output of the scripted inputs that are directed to stderr (causing an error) will be captured in the splunkd.log file, which can be useful when attempting to debug the execution of a script. As Splunk indexes its own data by default, you can search for scripted input errors and alert on them if necessary.
For security reasons, Splunk will not execute scripts located outside of the bin directories mentioned earlier. In order to overcome this limitation, you can use a wrapper script
(such as a shell script in Linux or batch file in Windows) to call any other script located
on your machine.
See also
Using modular inputs
Since Splunk 5.0, the ability to extend data input functionality has existed such that custom input types can be created and shared while still allowing minor customizations.
Modular inputs build further upon the scripted input model. Originally, any additional
functionality required by the user had to be contained within a script. However, this presented a challenge, as no customization of this script could occur from within Splunk itself. For example, pulling data from a source for two different usernames might have needed two copies of a script or might have meant playing around with command-line arguments within
your scripted input configuration.
By leveraging the modular input capabilities, developers are now able to encapsulate their
code into a reusable app that exposes parameters in Splunk and allows for configuration
through the processes familiar to Splunk administrators.
This recipe will walk you through how to install the Command Modular Input, which allows for periodic execution of commands and subsequent indexing of the command output. You will
configure the input to collect the data outputted by the vmstat command in Linux and the systeminfo command in Windows.
Getting ready
To step through this recipe, you will need a running Splunk server with a connection to the Internet. There are no other prerequisites.
How to do it...
Follow the steps in this recipe to configure a modular input:
1. Log in to your Splunk server.
2. From the Apps menu in the upper left-hand corner of the home screen, click on
3. In the search field, enter command modular input and click on the magnifying glass icon.
4. In the search results, click on the Install free button for Command Modular Input.
5. Enter your Splunk.com credentials and click on Login. Splunk should return with a message saying that the app was installed successfully.
7. On the Data inputs page, click on the Command link under Type.
8. Then, click on New.
9. In the Mod Input Name field, enter SystemInfo.
If you are using Linux, enter /usr/bin/vmstat in the Command Name field.
If you are using Windows, enter C:\Windows\System32\systeminfo.exe in the Command Name field.
Use a full path if the command to be executed cannot be found on the system PATH.
10. In the Command Arguments field, enter any argument that needs to be passed
to the command listed in the Command Name field. In the Command Execution Interval field, enter a value in seconds for how often the command should
11. In the Source type section, you have the option to select a predefined source type or
select Manual and enter a value. For the purposes of this recipe, select Manual as the sourcetype and enter cp01_modular_input as the value for the sourcetype. 12. Click on Save to save the input. Splunk is now configured to execute the modular
input you provided, every 60 seconds, in accordance with the specified interval. You
can search for the data returned by the scripted input using the following search over
All time:
sourcetype=cp01_modular_input
How it works...
Modular inputs are bundled as Splunk apps and, once installed, contain all the necessary
configuration and code to display them in the Data inputs section of Splunk. In this recipe, you installed a modular input application that allows for periodic execution of commands.
You configured the command to execute every minute and index the results of the command
each time, giving the results a source type of cp01_modular_input.
Modular inputs can be written in a number of languages and need to follow only a set of
interfaces that expose the configuration options and runtime behaviors. Depending on the
design of the input, they will either run persistently or run on an interval and will send data to Splunk as they receive it.
You can find several other modular inputs, including REST API, SNMP, and
There's more...
To learn how to create your own modular input, refer to the Modular Inputs section of the Developing Views and Apps for Splunk Web manual located at http://docs.splunk.com/ Documentation/Splunk/latest/AdvancedDev.
See also
f The Indexing files and directories recipe f The Getting data through network ports recipe f The Using scripted inputs recipe
Using the Universal Forwarder to gather
data
Most IT environments today range from multiple servers in the closet of your office to hundreds of endpoint servers located in multiple geographically distributed data centers.
When the data we want to collect is not located directly on the server where Splunk is installed, the Splunk Universal Forwarder (UF) can be installed on your remote endpoint servers and used to forward data back to Splunk to be indexed.
The Universal Forwarder is similar to the Splunk server in that it has many of the same features, but it does not contain Splunk web and doesn't come bundled with the Python executable and libraries. Additionally, the Universal Forwarder cannot process data in advance, such as performing line breaking and timestamp extraction.
This recipe will guide you through configuring the Splunk Universal Forwarder to forward
data to a Splunk indexer and will show you how to set up the indexer to receive the data.
Getting ready
To step through this recipe, you will need a server with the Splunk Universal Forwarder
installed but not configured. You will also need a running Splunk server. There are no
other prerequisites.
To obtain the Universal Forwarder software, you will need to go to www. splunk.com/download and register for an account if you do not already have one. Then, either download the software directly to your server or download it to your laptop or workstation and upload it to your
How to do it...
Follow the steps in the recipe to configure the Splunk Forwarder to forward data and the Splunk indexer to receive data:
1. On the server with the Universal Forwarder installed, open a command prompt if you are a Windows user or a terminal window if you are a Unix user.
2. Change to the $SPLUNK_HOME/bin directory, where $SPLUNK_HOME is the directory in which the Splunk forwarder was installed.
For Unix, the default installation directory will be /opt/splunkforwarder/bin. For Windows, it will be C:\Program Files\SplunkUniversalForwarder\bin.
If using Windows, omit ./ in front of the Splunk command in the upcoming steps.
3. Start the Splunk forwarder if not already started, using the following command: ./splunk start
4. Accept the license agreement.
5. Enable the Universal Forwarder to autostart, using the following command: ./splunk enable boot-start
6. Set the indexer that this Universal Forwarder will send its data to. Replace the host value with the value of the indexer as well as the username and password for the Universal Forwarder.
./splunk add forward-server <host>:9997 -auth <username>:<password>
The username and password to log in to the forwarder (default is admin:changeme) is <username>:<password>.
Additional receiving indexers can be added in the same way by repeating the command in the previous step with a different indexer host or IP. Splunk will automatically load balance the forwarded data if more than one receiving indexer is specified in this manner. Port
On the receiving Splunk indexer server(s):
1. Log in to your receiving Splunk indexer server. From the home launcher, in the top-right corner click on the Settings menu item and then select the Forwarding and receiving link.
2. Click on the Configure receiving link.
3. Click on New.
4. Enter 9997 in the Listen on this port field.
5. Click on Save and restart Splunk. The Universal Forwarder is installed and configured
How it works...
When you tell the forwarder which server to send data to, you are basically adding a new
configuration stanza into an outputs.conf file behind the scenes. On the Splunk server, an inputs.conf file will contain a [splunktcp] stanza to enable receiving. The outputs. conf file on the Splunk forwarder will be located in $SPLUNK_HOME/etc/system/local, and the inputs.conf file on the Splunk server will be located in the local directory of the
app you were in (the launcher app in this case) when configuring receiving.
Using forwarders to collect and forward data has many advantages. The forwarders
communicate with the indexers on TCP port 9997 by default, which makes for a very simple
set of firewall rules that need to be opened. Forwarders can also be configured to load
balance their data across multiple indexers, increasing search speeds and availability.
Additionally, forwarders can be configured to queue the data they collect if communication
with the indexers is lost. This can be extremely important when collecting data that is not read
from logfiles, such as performance counters or syslog streams, as the data cannot be re-read.
There's more...
While configuring the settings of the Universal Forwarder can be performed via the
command-line interface of Splunk as outlined in this recipe, there are several other methods to update settings quickly and allow for customization of the many configuration options that Splunk provides.
Add the receiving indexer via outputs.conf
The receiving indexers can be directly added to the outputs.conf configuration file on the Universal Forwarder. Edit $SPLUNK_HOME/etc/system/local/outputs.conf, add your input, and then restart the UF. The following example configuration is provided, where two
receiving indexers are specified. The [tcpout-server] stanza can be leveraged to add
output configurations specific to an individual receiving indexer.
If nothing has been configured in inputs.conf on the Universal Forwarder, but outputs.conf is configured with at least one valid receiving indexer,
the Splunk forwarder will only send internal log data to the indexer. It is,
therefore, possible to configure a forwarder correctly and be detected by the
Splunk indexer(s), but not actually send any real data.
Loading the sample data for this book
While most of the data you will index with Splunk will be collected in real time, there might be
instances where you have a set of data that you would like to put into Splunk, either to backfill
some missing or incomplete data, or just to take advantage of its searching and reporting tools.
This recipe will show you how to perform one-time bulk loads of data from files located on
the Splunk server. We will also use this recipe to load the data samples that will be used throughout subsequent chapters as we build our Operational Intelligence app in Splunk.
There are two files that make up our sample data. The first is access_log, which represents
data from our web layer and is modeled on an Apache web server. The second file is
app_log, which represents data from our application layer and is modeled on the log4j application log data.
Getting ready
To step through this recipe, you will need a running Splunk server and should have a copy of the sample data generation app (OpsDataGen.spl) for this book.
How to do it...
Follow the given steps to load the sample data generator on your system:
1. Log in to your Splunk server using your credentials.
2. From the home launcher, select the Apps menu in the top-left corner and click on
3. Select Install App from file.
4. Select the location of the OpsDataGen.spl file on your computer, and then click on the Upload button to install the application.
5. After installation, a message should appear in a blue bar at the top of the screen, letting you know that the app has installed successfully. You should also now see the OpsDataGen app in the list of apps.
7. From the Data inputs screen that follows, select Scripts.
8. On the Scripts screen, locate the OpsDataGen script for your operating system and click on Enable.
For Linux, it will be $SPLUNK_HOME/etc/apps/OpsDataGen/bin/ AppGen.path
For Windows, it will be $SPLUNK_HOME\etc\apps\OpsDataGen\bin\
AppGen-win.path
The following screenshot displays both the Windows and Linux inputs that are available after installing the OpsDataGen app. It also displays where to click to enable the correct one based on the operating system Splunk is installed on.
9. Select the Settings menu from the top-right corner of the screen, select Data inputs, and then select Files & directories.
10. On the Files & directories screen, locate the two OpsDataGen inputs for your operating system and for each click on Enable.
For Linux, it will be:
$SPLUNK_HOME/etc/apps/OpsDataGen/data/access_log $SPLUNK_HOME/etc/apps/OpsDataGen/data/app_log
For Windows, it will be:
$SPLUNK_HOME\etc\apps\OpsDataGen\data\access_log $SPLUNK_HOME\etc\apps\OpsDataGen\data\app_log The following screenshot displays both the Windows and Linux inputs that are available after installing the OpsDataGen app. It also displays where to click to enable the correct one based on the operating system Splunk is installed on.
11. The data will now be generated in real time. You can test this by navigating to the Splunk search screen and running the following search over an All time (real-time)
time range:
After a short while, you should see data from both source types flowing into Splunk, and the
data generation is now working as displayed in the following screenshot:
How it works...
In this case, you installed a Splunk application that leverages a scripted input. The script we wrote generates data for two source types. The access_combined source type contains sample web access logs, and the log4j source type contains application logs. These data sources will be used throughout the recipes in the book. Applications will also be discussed in more detail later on.
See also
f The Indexing files and directories recipe f The Getting data through network ports recipe f The Using scripted inputs recipe
Defining field extractions
Splunk has many built-in features, including knowledge on several common source types,
which lets it automatically know what fields exist within your data. Splunk will, by default, also extract any key-value pairs present within the log data and all fields within JSON-formatted logs. However, often, fields within raw log data cannot be interpreted out of the box, and this knowledge must be provided to Splunk in order to make these fields easily searchable.
The sample data that we will be using in subsequent chapters contains data we wish to
Getting ready
To step through this recipe, you will need a running Splunk server with the operational intelligence sample data loaded. There are no other prerequisites.
How to do it...
Follow the given steps to add a custom field extraction for response:
1. Log in to your Splunk server.
2. In the top-right corner, click on the Settings menu, and then click on the Fields link.
3. Click on the Field extractions link.
4. Click on New.
5. In the Destination appfield, select the search app, and in the Name field, enter
response. Set the Apply to dropdown to sourcetype and the named field to access_ combined. Set the Type dropdown to Inline, and for the Extraction/Transform field,
6. Click on Save.
7. On the Field Extractions listing page, find the recently added extraction, and in
the Sharing column, click on the Permissions link.
9. Navigate to the Splunk search screen and enter the following search over the
Last 60 minutes time range:
index=main sourcetype=access_combined
You should now see a field called response extracted on the left-hand side of the search screen under the Interesting Fields section.
How it works...
All field extractions are maintained in the props.conf and transforms.conf
configuration files. The stanzas in props.conf include an extraction class that leverages regular expressions to extract field names and/or values to be used at search time. The transforms.conf file goes further and can be leveraged for more advanced extractions such as reusing or sharing extractions over multiple sources, source types, or hosts.
See also
f The Loading the sample data for this book recipe f The Defining event types and tags recipe
Defining event types and tags
Event types in Splunk are a way of categorizing common types of events in your data in order to make them easier to search and report on. One advantage of using event types is that they
can assist in applying a common classification to similar events. Event types essentially turn chunks of search criteria into field/value pairs. Tags help you search groups of event data more efficiently and can be assigned to any field/value combination, including event types.
For example, Windows logon events could be given an event type of windows_logon, Unix logon events could be given an event type of unix_logon, and VPN logon events can be given an event type of vpn_logon. We could then tag these three event types with a tag of logon_event. A simple search for tag="logon_event" would then search across the Windows, Unix, and VPN source types and return all the logon events. Alternatively, if we want to search only for Windows logon events, we will search for eventtype=windows_logon. This recipe will show how to define event types and tags for use with the sample data.
For more information on event types and tags in Splunk, please check out:
f http://docs.splunk.com/Documentation/Splunk/ latest/Knowledge/Abouteventtypes
f http://docs.splunk.com/Documentation/Splunk/ latest/Knowledge/Abouttagsandaliases
Getting ready
To step through this recipe, you will need a running Splunk server with the operational intelligence sample data loaded. There are no other prerequisites.
How to do it...
Follow the given steps to define an event type and associated tag:
1. Log in to your Splunk server.
2. From the home launcher in the top-right corner, click on the Settings menu item, and then click on the Event types link.
4. In the Destination App dropdown, select search. Enter HttpRequest-Success in the
Namefield. In the Search string text area, enter sourcetype=access_combined status=2*. In the Tag(s) field, enter webserver, and then click on Save.
5. The event type is now created. To verify that this worked, you should now be able to search by both the event type and the tag that you created. Navigate to the Splunk search screen in the Search & Reporting app and enter the following search over the Last 60 minutes time range to verify that the eventtype is working:
eventtype="HttpRequest-Success"
6. Enter the following search over the Last 60 minutes time range to verify that the tag is working:
tag="webserver"
How it works...
Event types are applied to events at search time and introduce an eventtype field with
user-defined values that can be used to quickly sift through large amounts of data. An event type is
essentially a Splunk search string that is applied against each event to see if there is a match. If the event type search matches the event, the eventtype field is added with the value of the
field being the user-defined name for that event type.
Event types can be added, modified, and deleted at any time without the need to change
or reindex your data, as they are applied at search time.
Event types are stored in eventtypes.conf in either $SPLUNK_HOME/etc/system/ local/ or a custom app directory.
There's more...
While adding event types and tags can be done through the web interface of Splunk as outlined in this recipe, there are other approaches to add them in bulk quickly and allow
for customization of the many configuration options that Splunk provides.
Adding event types and tags via eventtypes.conf and tags.conf
Event types in Splunk can be manually added to the eventtypes.conf configuration files. Edit (or create) $SPLUNK_HOME/etc/system/local/eventtypes.conf and add your event type. You will need to restart Splunk after this.
[HttpRequest-Success] search = status=2*
Tags in Splunk can be manually added to the tags.conf configuration files. Edit (or create) $SPLUNK_HOME/etc/system/local/tags.conf and add your tag. You will need to restart Splunk after this.
[eventtype=HttpRequest-Success] webserver = enabled
In this recipe, you tagged an event type. However, tags do not always
need to be associated with event types. You can tag any field/value
combination found in an event. To create new tags independently, click on the Settings menu and select Tags.
See also
Summary
The key takeaways from this chapter are:
f Splunk can easily monitor individual files or whole directories to collect the many
logfiles you have access to
f Network ports can be used to collect data that is socket based, such as syslog f The Splunk Universal Forwarder can be used to collect data that is not accessible
from your Splunk server but is located remotely
2
Diving into
Data – Search
and Report
In this chapter, we will cover the basic ways to search the data in Splunk. We will learn about:
f Making raw event data readable f Finding the most accessed web pages f Finding the most used web browsers f Identifying the top-referring websites f Charting web page response codes
f Displaying web page response time statistics f Listing the top viewed products
f Charting the application's functional performance f Charting the application's memory usage
f Counting the total number of database connections
Introduction
The ability to search machine data is one of Splunk's core functions, and it should come as no surprise that many other features and functions of Splunk are heavily driven-off searches. Everything from basic reports and dashboards through to data models and fully featured Splunk applications are powered by Splunk searches behind the scenes.
The Search Processing Language (SPL)
Splunk has its own search language known as the Search Processing Language (SPL). This SPL contains hundreds of search commands, most of which also have several functions, arguments, and clauses. While a basic understanding of SPL is required in order to effectively search your data in Splunk, you are not expected to know all of the commands! Even the most seasoned ninjas do not know all the commands and regularly refer to the Splunk manuals, website, or Splunk Answers (http://answers.splunk.com).
To get you on your way with SPL, be sure to check out the search command cheat sheet and download the handy quick reference guide available at
http://docs.splunk.com/Documentation/Splunk/latest/ SearchReference/SearchCheatsheet.
Searching
Searches in Splunk usually start with a base search, followed by a number of commands that are delimited by one or more pipe (|) characters. The result of a command or search to the left of the pipe is used as the input for the next command to the right of the pipe. Multiple
pipes are often found in a Splunk search to continually refine data results as needed. As we
go through this chapter, this concept will become very familiar to you.
Splunk allows you to search for anything that might be found in your log data. For example, the most basic search in Splunk might be a search for a keyword such as error or an IP address such as 10.10.12.150. However, searching for a single word or IP over the terabytes of data
that might potentially be in Splunk is not very efficient. Therefore, we can use the SPL and a number of Splunk commands to really refine our searches. The more refined and granular the
When searching in Splunk, try to filter as much as possible before the first
pipe (|) character, as this will save CPU and disk I/O. Also, pick your time range wisely. Often, it helps to run the search over a small time range when testing it and then extend the range once the search is providing what you need.
Boolean operators
There are three different types of Boolean operators available in Splunk. These are AND, OR, and NOT. Case sensitivity is important here, and these operators must be in uppercase to be recognized by Splunk. The AND operator is implied by default and is not needed, but does no harm if used.
For example, searching for error OR success would return all events that contain either the word error or the word success. Searching for error success would return all events that contain the words error and success. Another way to write this would be error AND success. Searching web access logs for error OR success NOT mozilla would return all events that contain either the word error or success, but not those events that might also contain the word mozilla.
Common commands
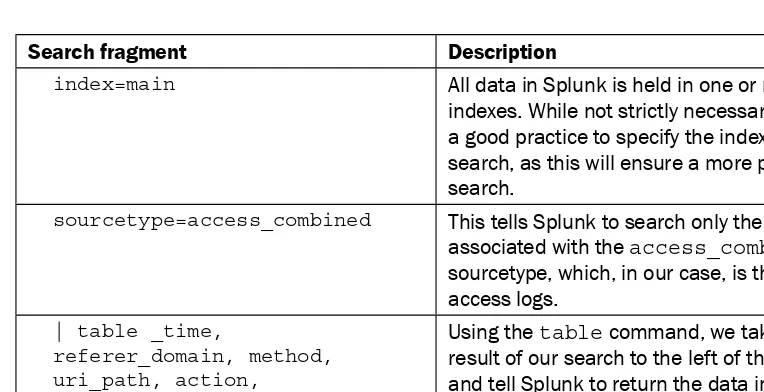
There are many commands in Splunk that you will likely use on a daily basis when searching data within Splunk. These common commands are outlined in the following table:
Command Description
chart /
timechart
This command outputs results in a tabular and/or time-based output for use by Splunk charts.
dedup This command de-duplicates results based upon specified fields, keeping the most recent match.
eval This command evaluates new or existing fields and values. There are many different functions available for eval.
fields This command specifies the fields to keep or remove in search results.
head This command keeps the first X (as specified) rows of results.
lookup This command looks up fields against an external source or list, to return additional field values.
rare This command identifies the least common values of a field.
rename This command renames fields.
replace This command replaces the values of fields with another value.
search This command permits subsequent searching and filtering of results.
Command Description
stats This command performs statistical operations on results. There are many different functions available for stats.
table This command formats results into a tabular output.
tail This command keeps only the last X (as specified) rows of results.
top This command identifies the most common values of a field.
transaction This command merges events into a single event based upon a common transaction identifier.
Time modifiers
The drop-down time range picker in the graphical user interface (GUI) to the right of the Splunk search bar allows users to select from a number of different preset and custom time ranges. However, in addition to using the GUI, you can also specify time ranges directly in your search string using the earliest and latest time modifiers. When a time modifier is used in this way, it will automatically override any time range that might be set in the GUI time range picker.
The earliest and latest time modifiers can accept a number of different time units: seconds (s), minutes (m), hours (h), days (d), weeks (w), months (mon), quarters (q), and years (y). Time modifiers can also make use of the @ symbol to round down and snap to
a specified time.
For example, searching for sourcetype=access_combined earliest=-1d@d latest=-1h will search all access_combined events from midnight, a day ago until an hour ago from now. Note that the snap (@) will round down such that if it were 12 p.m. now, we would be searching from midnight a day and a half ago until 11 a.m. today.
Working with fields
Fields in Splunk can be thought of as keywords that have one or more values. These fields are fully searchable by Splunk. At a minimum, every data source that comes into Splunk will
have source, host, index, and sourcetype fields, but some sources might have hundreds of additional fields. If the raw log data contains key-value pairs or is in a structured format such as JSON or XML, then Splunk will automatically extract the fields and make them searchable. Splunk can also be told how to extract fields from the raw log data in the backend props. conf and transforms.conf configuration files.
Searching for specific field values is simple. For example, sourcetype=access_combined status!=200 will search for events with a sourcetype field value of access_combined that