69
LAMPIRAN I
Tahun Perusahaan Fee_Audit Fee IA ACInd Aset Size BoardSize BoardInd CA
2009 AKR Corporindo 570.000.000 20,16115 4 0,666666667
6.059.070.429.000 29,43258 3 0,333333333 11
2009 Polychem Indonesia 375.000.000 19,74244 8 0,666666667
3.719.872.147.000 28,94471 5 0,4 3
2010 Elnusa 1.730.000.000 21,27139 7 0,6 3.678.566.000.000 28,93354 5 0,4 7
2010 Polychem Indonesia 400.000.000 19,80698 8 0,666666667 3.766.135.060.000 28,95707 5 0,4 3
2010 Timah (Persero) 1.600.000.000 21,19327 19 0,8
5.881.108.000.000 29,40277 6 0,5 13 2011 Bakrie Sumatra Plantations 3.267.100.000 21,90717 7 0,666666667 18.702.295.203.000 30,55967 5 0,6 39 2011 Elnusa 1.923.000.000 21,37715 6 0,666666667 4.389.950.000.000 29,11034 5 0,4 6 2011 Kalbe Farma 2.531.000.000 21,65188 20 0,666666667 8.274.554.112.840 29,74421 6 0,333333333 19
2011
Perusahaan Gas Negara
(Persero) 2.365.000.000 21,58404 23 0,8 30.976.445.812.225 31,06425 5 0,4 6 2011 Polychem Indonesia 450.000.000 19,92476 8 0,666666667 5.247.203.768.000 29,28872 5 0,4 3 2011 Sat Nusa Persada 280.000.000 19,45030 2 0,666666667 756.919.614.745 27,35252 3 0,333333333 2
2011 Semen Gresik 3.600.000.000 22,00420 19 0,333333333
71
Indonesia
2012 Darya Varia Laboratoria 1.196.000.000 20,90225 5 0,666666667 1.074.691.476.000 27,70305 7 0,428571429 4
2012 Elnusa 3.432.850.000 21,95666 6 0,4 4.294.557.000.000 29,08837 5 0,4 5
2012 Indal Aluminium Industry 130.000.000 18,68305 1 0,666666667 612.224.219.835 27,14036 5 0,4 4 2012 Indo Kordsa 588.355.260 20,19284 0 0,666666667 2.299.332.380.000 28,46364 7 0,428571429 2 2012 Indo Tambangraya Megah 939.924.000 20,66131 8 0,666666667 14.420.136.080.000 30,29965 6 0,333333333 5 2012 Kalbe Farma 2.723.000.000 21,72500 19 0,666666667 9.417.957.180.958 29,87364 6 0,333333333 20 2012 Kedawung Setia Industrial 320.000.000 19,58383 1 0,666666667 570.564.051.755 27,06989 4 0,5 1 2012 Medco Energi International 6.623.950.000 22,61396 13 0,4 25.681.979.607.680 30,87681 6 0,333333333 27
2012
Perusahaan Gas Negara
(Persero) 2.510.541.000 21,64376 22 0,8 37.791.929.624.730 31,26312 6 0,333333333 7 2012 Polychem Indonesia 750.000.000 20,43558 8 0,666666667 5.791.473.365.571 29,38741 5 0,4 3 2012 Sat Nusa Persada 285.000.000 19,46800 2 0,666666667 892.027.224.371 27,51676 3 0,333333333 1 2012 Semen Indonesia 3.600.000.000 22,00420 23 0,5 26.579.083.786.000 30,91115 6 0,5 12 2012 Timah (Persero) 1.800.000.000 21,31105 20 0,5 6.101.007.000.000 29,43947 6 0,5 9 2013 AKR Corporindo 1.080.000.000 20,80023 4 0,666666667 14.633.141.381.000 30,31431 3 0,333333333 20 2013 Alakasa Industrindo 161.756.000 18,90160 1 0,666666667 241.912.806.000 26,21184 4 0,5 5 2013 Aneka Tambang 1.280.000.000 20,97013 11 0,666666667 21.865.117.391.000 30,71591 6 0,333333333 16
2013
Argha Karya Prima
2013
Charoen Pokphand
Indonesia 8.400.000.000 22,85150 15 0,6 15.722.197.000.000 30,38609 6 0,333333333 24 2013 Darya Varia Laboratoria 1.571.000.000 21,17498 8 0,5 1.190.054.288.000 27,80502 7 0,428571429 4
2013 Elnusa 3.100.000.000 21,85467 9 0,75 4.370.964.000.000 29,10600 5 0,4 6
2013 Indal Aluminium Industry 154.000.000 18,85246 1 0,666666667 765.881.409.376 27,36429 4 0,5 4 2013 Indo Kordsa 991.237.500 20,71446 1 0,666666667 2.987.854.950.000 28,72558 7 0,428571429 2 2013 Indo Tambangraya Megah 1.232.161.632 20,93204 8 0,666666667 16.968.794.460.000 30,46240 6 0,333333333 7 2013 Kalbe Farma 2.988.000.000 21,81787 18 0,666666667 11.315.061.275.026 30,05716 6 0,333333333 22 2013 Kedawung Setia Industrial 180.000.000 19,00847 1 0,666666667 850.233.842.186 27,46878 4 0,5 1
2013
Keramika Indonesia
Assosiasi 225.000.000 19,23161 1 0,666666667 2.270.904.910.518 28,45120 6 0,333333333 2 2013 Kimia Farma 645.000.000 20,28476 24 0,666666667 2.471.939.548.890 28,53602 5 0,4 4 2013 Medco Energi International 8.536.585.366 22,86763 7 0,666666667 30.874.139.878.049 31,06094 6 0,333333333 29
2013
Perusahaan Gas Negara
(Persero) 1.920.000.000 21,37559 21 0,8 53.182.740.014.055 31,60476 6 0,333333333 14 2013 Polychem Indonesia 500.000.000 20,03012 8 0,666666667 6.838.246.743.902 29,55355 5 0,4 3 2013 Resources Alam Indonesia 781.116.500 20,47623 1 0,333333333 1.293.102.999.678 27,88807 5 0,4 9
2013 Sat Nusa Persada 280.008.293 19,45033 2 0,666666667
73
LAMPIRAN II
Statistik Deskriptif Tahun 2009-2013 Awal
1.
Hasil Pengujian Awal Sebelum Pengobatan Autokorelasi
a.
Hasil Uji Normalitas P-Plot of Regression Standardized Residual
Descriptive Statistics62 18,68 22,87 20,8266 1,06582
62 ,33 ,80 ,6419 ,09962
62 ,00 24,00 9,2903 7,62951
62 25,72 31,60 29,1879 1,40855
62 3,00 7,00 5,1452 1,23934
62 ,33 ,67 ,3953 ,07652
62 1,00 39,00 9,9677 9,77613
62
N Minimum Maximum Mean St d. Dev iation
1.0
75
b.
Hasil Uji Normalitas One-Sampel Kolmogorov-Smirnov Test
c.
Hasil Uji Multikolinearitas
One-Sample Kolmogorov-Smirnov Test
St d. Dev iation Normal Parametersa,b
Kolmogorov -Smirnov Z Asy mp. Sig. (2-tailed)
Unstandardiz ed Residual
Test distribution is Normal. a.
Calculated f rom dat a. b.
Coeffi cientsa
13,376 3,055 4,378 ,000
-1,734 ,836 -,162 -2,073 ,043 ,973 1,027
,027 ,015 ,190 1,740 ,087 ,499 2,002
,262 ,106 ,346 2,478 ,016 ,305 3,282
,155 ,077 ,180 2,011 ,049 ,743 1,346
-1,121 1,164 -,081 -,964 ,339 ,852 1,174
,032 ,011 ,294 2,918 ,005 ,585 1,708
(Constant)
t Sig. Tolerance VI F
Collinearity Statistics
d.
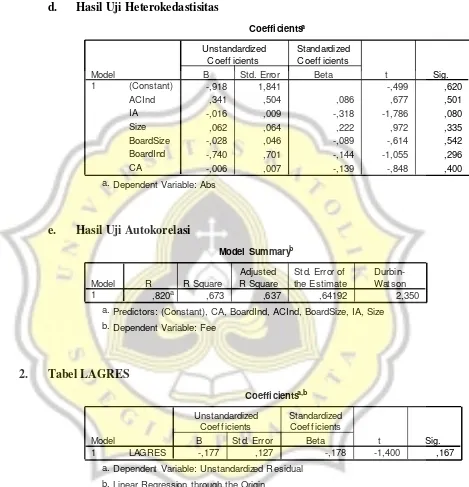
Hasil Uji Heterokedastisitas
e.
Hasil Uji Autokorelasi
2.
Tabel LAGRES
Coeffi ci entsa
-,918 1,841 -,499 ,620
,341 ,504 ,086 ,677 ,501
-,016 ,009 -,318 -1,786 ,080
,062 ,064 ,222 ,972 ,335
-,028 ,046 -,089 -,614 ,542
-,740 ,701 -,144 -1,055 ,296
-,006 ,007 -,139 -,848 ,400
(Constant)
Dependent Variable: Abs a.
Model Summaryb
,820a ,673 ,637 ,64192 2,350
Model
Predictors: (Constant), CA, BoardInd, ACInd, BoardSize, IA, Size a.
Dependent Variable: Fee b.
Coeffi cientsa,b
-,177 ,127 -,178 -1,400 ,167
LAGRES
Dependent Variable: Unstandardized Residual a.
77
3.
Hasil Pengujian Setelah Pengobatan Autokorelasi
a.
Hasil Uji Normalitas P-Plot of Regression Standardized Residual
b.
Hasil Uji Normalitas One-Sampel Kolmogorov-Smirnov Test
1.0
Normal P-P Plot of Regression Standardized Residual
One-Sample Kolmogorov-Smirnov Test
St d. Dev iation Normal Parametersa,b
Kolmogorov -Smirnov Z Asy mp. Sig. (2-tailed)
Unstandardiz ed Residual
Test distribution is Normal. a.
c.
Hasil Uji Multikolinearitas
d.
Hasil Uji Heterokedastisitas
e.
Hasil Uji Autokorelasi
Coeffi cientsa
17,057 3,657 4,665 ,000
-1,812 ,827 -,170 -2,192 ,033 ,979 1,021
,033 ,015 ,244 2,176 ,034 ,469 2,130
,222 ,108 ,290 2,051 ,045 ,294 3,404
,166 ,078 ,185 2,122 ,038 ,775 1,291
-1,290 1,126 -,095 -1,145 ,257 ,848 1,179
,036 ,011 ,337 3,387 ,001 ,595 1,680
(Constant)
t Sig. Tolerance VI F
Collinearity Statistics
Dependent Variable: Fee a.
Coeffi ci entsa
-,694 2,246 -,309 ,759
,120 ,508 ,031 ,237 ,814
-,017 ,009 -,340 -1,819 ,074
,051 ,067 ,179 ,759 ,451
-,028 ,048 -,084 -,577 ,566
-,630 ,692 -,127 -,911 ,366
-,003 ,007 -,070 -,421 ,675
(Constant)
Dependent Variable: Abs a.
Model Summaryb
,826a ,682 ,647 ,63427 2,018
Model
Predictors: (Constant), CA, ACInd, BoardInd, BoardSize, IA, Size a.
79
f.
Hasil Uji Koefisien Determinasi
g.
Hasil Uji F
h.
Hasil Uji T
Model Summary
,826a ,682 ,647 ,63427
Model
Predictors: (Constant), CA, ACInd, BoardInd, BoardSize, I A, Size
a.
ANOVAb
46,590 6 7,765 19,301 ,000a
21,724 54 ,402
Squares df Mean Square F Sig.
Predictors: (Const ant), CA, ACInd, BoardI nd, BoardSize, IA, Size a.
Dependent Variable: Fee b.
17,057 3,657 4,665 ,000
-1,812 ,827 -,170 -2,192 ,033
,033 ,015 ,244 2,176 ,034
,222 ,108 ,290 2,051 ,045
,166 ,078 ,185 2,122 ,038
-1,290 1,126 -,095 -1,145 ,257
,036 ,011 ,337 3,387 ,001
Statistik Deskriptif Tahun 2009-2013 Akhir Setelah Lulus Uji Asumsi Klasik
Descriptive Statistics
61 18,68 22,87 20,8375 1,07117
61 ,33 ,80 ,6415 ,10040
61 ,00 24,00 9,3770 7,66195
61 25,72 31,60 29,1839 1,41989
61 3,00 7,00 5,1803 1,21803
61 ,33 ,67 ,3963 ,07673
61 1,00 39,00 9,9508 9,85635
61 Fee
ACInd IA Size BoardSize BoardI nd CA
Valid N (listwise)