Universitas Muhammadiyah Purwokerto HM 396 ISBN 978,602,14930,0,7
DETERMINATION AND VALIDATION METHOD OF TOTAL FLAVONOID
CONTENT AND TOTAL PHENOLIC CONTENT OF ETHANOLIC EXTRACT OF
MANGOSTEEN (
*
arcinia mangostana L.) LEAVES AS NATURAL
PRESERVATIVES CANDIDATE BY USING SPECTROPHOTOMETRIC METHOD
*Diniatik, Indri Hapsari, Milani Tiara, Ayu Meidyawati, Suhri Nurhidayat
Faculty of PharmacyFakultas Farmasi Muhammadiyah Univercity of Purwokerto
Jalan Raya Dukuhwakuh PO BOX 202, Purwokerto 53182, Jawa Tengah, Indonesia
*E,mail: [email protected]
Abstract
Mangosteen has great potential as a natural preservative, it is necessary to ensure the content of compounds that have the potential levels. This study aimed to determine levels of total flavonoid content and total phenolic content and the validation methods. Determination and validation method used spectrophotometric methods, the methods of hydrolysis on total flavonoid content and the folin ciocalteu reagent method in the determination of phenolic total. Spectrophotometric method can be used for the determination of total flavonoid content with the results of the validation are eligible. The result of determination of total flavonoid content in 50% ethanol extract was 26.80 ± 15.9%. Spectrophotometric method can be used for the determination of total phenolic content with the results of the validation are eligible. The result of determination of total phenolic content in 50% ethanol extract was 71.94 ± 12.37%.
Keywords: ethanolic extract of Garcinia mangostana leaves, spectrophotometri, total flavonoid content, total phenolic content
INTRODUCTION
Currently the plant has many uses by humans, as building materials, food, medicine. The utilization of plants as additional material is limited, natural dyes, natural flavoring, natural smell giver, but as a natural preservative is limited utilization. Natural preservatives from plant could be developed further because of the danger of side effects and limitations of synthetic preservatives when used in large quantities is not good effect. The use of plants as a natural preservative has economic potential, as more people aware the dangers of synthetic preservatives so that people interested in eating organic food and organic processed food.
In processed foods, brown sugar, sodium metabisulfite used as a preservative, which has
some potentially damaging effects of such toxic genes (mutagens) tehadap bacteria have a tendency toward carcinogens, long,term use produces damaging organs (skin allergy, liver, metabolism and urinary system, asthma), toxic to the respiratory tract, skin, eyes, reproductive organs. Toxicity in rat LD50 1131 mg / kg and guinea pig skin LD50> 1000mg/kg. This spurred the possibility that relatively safer preservatives, with long,term continuity of production.
Mangosteen has informed empirically used as a preservative, especially the skin of the fruit. Thus the excavation of the main part of the leaves of this plant which is part of the easy and cheap to produce natural preservative be more likely to meet the needs of sustainable natural preservative. In the research that has been done further examine the skin of the fruit, but the research that has been done by Diniatik and Supaman (2011) reported the antioxidant activity of the leaves better than the skin of the fruit. Continued research and Diniatik Supaman (2011), reported the antibacterial activity was also the leaves better than the skin of the fruit. The first phase of the study showed antioxidant activity, antifungal and antibacterial of 50% ethanol extract of mangosteen leaves have the best potential. So it is very interesting to do further research to the second and third stages. There are three problems of this resears:
1. How validation method and determination total flavonoid conent in the ethanol extract of mangosteen leaves?
2. How validation method and determination total phenol content in the ethanol extract of mangosteen leaves?
3. How determination methods xanthon content in ethanol extract of mangosteen leaves?
METHOD
Variables in The Research
ethanol extract. Dependent variable is the level of standard rutin, gallic acid and alpha mangosteen.
The Way of The Research 1. Plant Determination
Mangosteen (G. mangostana) were used in the research determined in the Laboratory of Biology, Faculty of Education Studies Teacher Training and Education, University of Muhammadiyah Purwokerto. The results of determination convey that the plant specimen is Garcinia mangostana L. plant of the family Clusiaceae. The results of the determination by the book Flora of Java Vol II (Backer & Van Den Brink, 1965).
2. Collection of materials
Crude leaf G. mangostana Leaves of G. mangostana were taken Banyumas regency, Central Java. Drying is done by putting materials that have been washed clean in the winnowing, then covered with a black cloth that is not exposed to direct
Materials used in this study:
Ethanol, ethyl acetate, distilled water. acetone, methanol pa., several standards that rutin, gallic acid and alpha mangosteen.
The equipments were used in this study: Maceration equipment, Bekker Glass (Pyrex) glass and other tools, Rotary Evaporator, electric cooker, separating funnel, UV spectrophotometer, micropipette, filter paper.
3. Preparation of ethanol extract of leaves of *$ mangostana L. and remaceration, macerated for 2 x 24 hours with a comparison between the crude drug with 50% ethanol is 1:5 for the first day, and 1:4 for the second day. The way is as much as 750 grams of powder botanicals are macerated with ethanol 50%
as much as 7.5 liters, then precipitated, poured and squeezed. Dregs obtained macerated again with as much as 3 liters of ethanol.
Extracts of juice were made by using fresh leaves that have been washed and then 3 kg of leaves blended with 3 liters of distilled water until soft portion. Filtered with a flannel cloth.
Extracts of juice and ethanol were evaporated to a thick consistency is obtained which still can be cast and then be weighed. Preparation of ethanol extract of leaves of G. mangostana done at the Laboratory of Pharmaceutical Biology, Muhammadiyah University of Purwokerto.
4. Determination of total flavonoid content and validation method
The principle of this method is that the levels are defined as flavonoid aglycone by hydrolysis method, spectrophotometric measurement at a wavelength of maximum, after reacted with AlCl3 to improve selectivity and added heksanametilentetramin.
Universitas Muhammadiyah Purwokerto HM 398 ISBN 978,602,14930,0,7 will provide complex biru.Lakukan 3 times
repetition so that diperolehhasilnya phenol obtained as mg gallic acid equivalent/g fresh sample (Scrambled, 2006). Validation of a method to determine the linearity, LOD and LOQ.
G. Analysis
Datas were obtained from measurements using a standard curve of linear regression equation on the relationship curve between the absorbance of the extract concentration (Gulluce, et al., 2006).
RESULT AND DISCUSSION Plant Determination
Mangosteen (G. mangostana) were used in the study determined in the Laboratory of Pharmaceutical Sciences Faculty of Pharmacy, Muhammadiyah University of Purwokerto. The purpose of determination to get the truth with a clear identity of the studied plants and avoid mistakes in the collection of primary research materials. The results of determination stating that the plant specimen is really,really plant Garcinia mangostana L. of the family Clusiaceae. The results of the determination by the book Flora of Java Vol II (Backer and Van Den Brink, 1965).
Materials Collection and Crude Preparation of Leaves mangosteen (*$ mangostana)
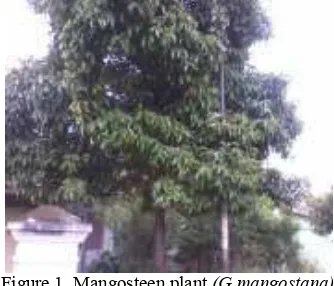
In this study the use of mangosteen (Figure 1) were taken at the District Somagede, Banyumas. Fresh leaves of mangosteen taken in May in the morning. The leaves are plucked fresh mangosteen leaves was being taken from the 30,year,old trees since planting, the leaves taken after post,harvest fruit. The leaves are taken is elderly, because it is expected that the chemical content obtained were optimal (Anonymous, 1985). Decision were done at a certain time and place to avoid wide,range of chemical constituents due to differences in environmental conditions, objec soil, and climate.
Figure 1. Mangosteen plant (G mangostana)
Fresh mangosteen leaves were obtained, washed with running water to remove any dirt or
contaminants in the form of soil, or other materials on the the leaves. Selected the leaves (15 kg) is good for the next aerated. Partially dried mangosteen the leaves in the sun covered with black cloth, for the purpose of extraction with ethanol. During heating, the material is not accumulated and inverted laid,back that evenly heating and drying process takes place quickly. The dried mangosteen leaves on the seventh day. Leaves the rest was made in the form of mangosteen juice (Anonymous, 1985). Drying is done until the moisture content is less than 10% or until the leaves are easy to be destroyed when squeezed. The purpose of drying is to prevent the growth of fungi or microorganisms and the decomposition of active compounds by enzymatic reactions and hydrolysis process because of high water content, so that the resulting crude drug is not easily damaged so it can be stored in a relatively long time. Dried Simplicia were grinded then by using a blender to minimize the surface area that contacts the surface of the particles of crude drugs with greater solvent and dissolving more optimal.
Crude further were sieved using a sieve mesh 20/40 which means as much as 100% dry simplicia passes on 20 mesh sieve, then as much as 40% from 100% dry simplicia 40 mesh sieve, so that 500 grams of dried botanicals mangosteen the leaves and bark as much as 300 grams 20 mesh sieve and sieve as much as 40 grams of 200. In general screening process is important in the extraction process, due to the presence of particle size reduction will expand the contact surface with the powder so penyari maximum and extraction becomes more active substances may be taken optimally.
Making Ethanol Extract of Mangosteen Leaf Dissolution method used is maceration. This method is the simplest method because it is easy to do, inexpensive, does not require sophisticated equipment. Maceration is done by soaking the powder in a liquid botanicals penyari. In this research, to improve the effectiveness of the extraction is done stirring and remaserasi, macerated for 2 x 24 hours with a comparison between the crude drug with 50% ethanol is 1:5 for the first day, and 1:4 for the second day. The trick is as much as 750 grams of powder botanicals are macerated with ethanol 50% as much as 3.75 liters, then dienap,pour and squeezed. Dregs obtained again macerated with ethanol 50% as much as 3 liters.
phenolic compounds, flavonoids, saponins, and other polar compounds contained in mangosteen the leaves, whereas ethanol is ethanol used in the market is technically possible it is recovered when evaporated with a rotary evaporator. Ethanol is more selective, non,toxic, neutral, good absorption,
can prevent the growth of mold and bacteria, the heat required for concentration less. Juice obtained is evaporated over a water bath until a thick consistency. Evaporation is done to eliminate solven solution so as not to affect the next examination as shown in Table 1 below.
Tabel 1. The yield of ethanol extract
Type The weight of wet simplicia
The weight of dry simplicia
Extract
weight Rendemen
ethanol extract 50% 3 kg 750 g 175,41 g 5,647%
Method Validation and Determination of Total Flavonoids Content
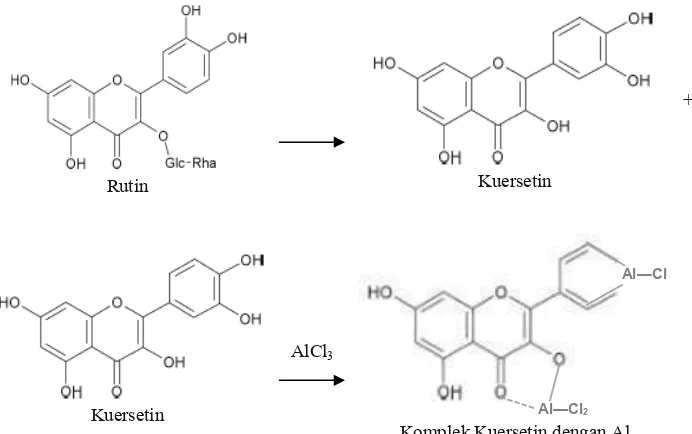
Total flavonoid content of ethanolic leaf extract of mangosteen determined using spectrophotometric methods that have been recommended in the book POM body Sandar Extract Parameters (Anonymous, 2000). The principle of this method is that the levels are defined as flavonoid aglycone by first hydrolyzed and subsequent spectrophotometric measurements by reacting AlCl3 occurs that causes a wavelength
shift to the right, making it more selective. Hydrolysis (reflux) done to change into aglycone flavonoid glycosides flavonoids and glikon. This is done because the flavonoids in ethanolic herbal extracts contained in china patikan glycoside and aglycone form. Determination of total flavonoid levels aims to establish the levels of all flavonoids (total), with hydrolyzed, all will flavonoid aglycone
flavonoids tertetapkan as advantageous because it derived flavonoid levels is certainly more appropriate. Wavelength shift toward longer bathochromic well as OH groups that had been closed off so that the sugar will slide more reactants to form bonds, the maximum wavelength becomes larger, making it more selective. The disadvantage is the long working procedures so that the possibility of error for greater progress, for it is the determination of the total flavonoid content patikan chinese herbs to prior validation of methods including linearity, precision, accuracy, detection limit of the test.
The standard used was rutin, quercetin and ramnoglukosa hydrolyzed form. After the quercetin
was added AlCl3 reagent to form a chelate complex
that become has a larger maximum wavelength (figure 2).
Rutin Kuersetin
+ Ramnoglukosa
Kuersetin
AlCl3
Universitas Muhammadiyah Purwokerto HM 400 ISBN 978,602,14930,0,7 0. Preparation of Standard Curve and
Linearity
Standard curve was obtained by varying the levels that have been hydrolyzed rutin (same method with the sample) was measured at a wavelength of 417 nm maximum. From the data obtained by spectrophotometric absorbance for each concentration (Table 2). The absorbance is plotted with each concentration to make the linear regression equation y = bx + equation a. From the
relationship curve between absorbance and
concentration will be obtained correlation
coefficient (r) as a parameter to determine linearity. The results obtained equation has good linearity, because r count (0.9984) is greater than r table (0.811, for N = 6, 95% confidence level) (Hadi, 1996). Standard curve was obtained Y = 0.00491 x , 0.00726 is used to determine the total flavonoids content, linear regression curve can be seen in Figure 3.
Table 2. Absorbance and standard curve
No. Rutin content(mg/L) Absorbance (A) The result of linear regression
1. 40 0,1938 r = 0,9984
a = ,0,00726 b = 0,00491
2. 80 0,3878
3. 120 0,5515
4. 160 0,8114
5. 200 0,9790
6. 240 1,1642
Figure 3. Standard linear regression curve of rutin that has been hydrolyzed
2. Determination of Limit of Detection
To determine the total flavonoid content in the sample was able to be detected by this method was measured the levels of several standard rutins that have been hydrolyzed. The measurement results can be seen in table 3. Limit concentration of standard solutions that can still be detected by spectrophotometric method is 1.25 mg/L. This
means that the total flavonoid assay with a standard rutin which is hydrolyzed to the sample by spectrophotometric methods measure should be greater than 1.25 mg/L. Figure 4 shows the linear regression curves were created from data from the determination of the minimum limit of detection with a correlation coefficient of r = 0.9979.
Table 3. Absorbance data and results of the minimum limit of detection
No. Rutin content (mg/L) Absorbance Results of the minimum limit of detection
1. 20 0,0933 r = 0,9979
a = ,0,001939 b = 0,004736
2. 10 0,0436
3. 5 0,0249
4. 2,5 0,0065
5. 1,25 0,0027
Figure 4. Linear regression curve assay
3. Determination of Precision
Precision test is done by making six replication of a standard rutin that has been hydrolyzed. The absorbance obtained standard curve were plotted on the Y = 0.00491 x , 0.00726 to obtain calculated content, and then calculated the
average concentration, standard deviation and coefficient of variation (Table 4). The coefficient of variation (CV) was 1.80%, less than 5% indicates that this method has a good precision (Peter & Richard, 2000).
Table 4. Absorbance data and the results of precision test
No. Absorbance Rutin Content (mg/L) The results of precision test
1. 0,5619 115,91 Rata,rata = 113,87 SD = 2,05 CV = 1,80%
2. 0,5508 113,65
3. 0,5482 113,12
4. 0,5649 116,52
5. 0,5374 110,92
6. 0,5482 113,12
4. Accuracy
Test of accuracy (closeness) is done by calculating the recovery rutin standard that has been hydrolyzed. Recovery percentage was calculated by making a comparison between content from the results of analysis with actual content. The absorbance were obtained, were plotted on standard curve to obtain calculated content, and then calculated the average content, standard deviation and recovery (Table 5). Value recovery (recovery)
between 92.43% to 97.10%. These results meet the requirements due to the analyte content 0.01 <x <0.1% in the amount of 90,107%. The coefficient of variation are also eligible ie 1.80% (less than 5.3%) (Yowono & Indrayanto, 2005). This means the method meet the requirements, because especially the precision and accuracy have met the requirements, systematic errors which arise in the analysis can be avoided.
Table 5. The results of accuracy test No. Actual rutin content
(mg/L)
Rutin content
From the result of analysis (mg/L)
The results of accuracy test (%)
1. 120 115,91 96,50
2. 120 113,65 94,70
3. 120 113,12 94,26
4. 120 116,52 97,10
5. 120 110,92 92,43
6. 120 113,12 94,26
5. Determination of Total Flavonoids Content The results of the determination of the total flavonoid content 50% ethanolic extract of mangosteen leaves are calculated as hydrolyzed
Universitas Muhammadiyah Purwokerto HM 402 ISBN 978,602,14930,0,7 Table 6. The results of the assay was calculated as the total flavonoids rutin hydrolyzed
The origin mangosteen
leaf area
Absorbance Total flavonoid content
mg/L
Total flavonoid content%(b/b) In the extract
The average of total flavonoid content%(b/b)
In the extract
Banyumas 0,3251 67,69 42,33 26,80 ± 15,9
0,4261 88,26 27,53
0,1587 33,80 10,55
Mangosteen leaves are extracted with 50% ethanol derived from Banyumas region have relatively high levels of flavonoids, namely 26.80%.
Validation Method and Determination of Total Phenol Content
Total phenolic content of ethanolic leaf extract of mangosteen determined using spectrophotometric method referring to previous studies (Scrambled, 2006). Determination of total phenol content which aims to define all content phenols (total) in the ethanolic leaf extract of mangosteen. Prior to the determination of total phenol content to prior validation of methods including linearity, precision, accuracy, of detection limit of the test. Appellant used are Gallic Acid.
1. Preparation of Standard Curve and Linearity
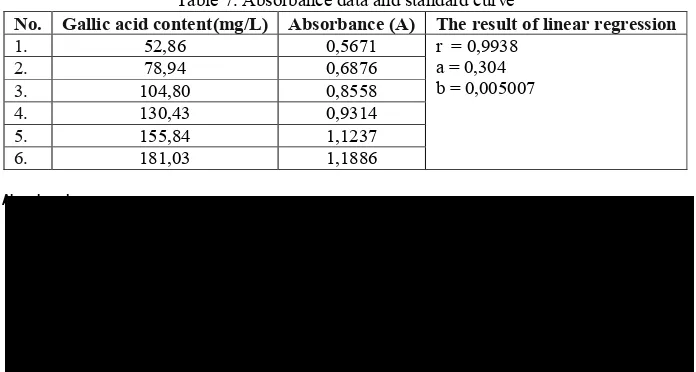
Standard curve was obtained by varying the content that have been hydrolyzed rutin (same method with the sample) was measured at a wavelength of 601 nm maximum. From the data obtained by spectrophotometric absorbance for each concentration (Table 7). The absorbance were plotted with each concentration to make the linear regression equation y = bx + equation a. From the
relationship curve between absorbance and
concentration will be obtained correlation
coefficient (r) as a parameter to determine linearity. The results obtained equation has good linearity, because r count (0.9938) is greater than r table (0.811, for N = 6, 95% confidence level) (Hadi, 1996). Standard curve obtained is Y = 0.005007 x , 0.304 is used to determine content total phenols, linear regression curve can be seen in figure 5.
Table 7. Absorbance data and standard curve
No. Gallic acid content(mg/L) Absorbance (A) The result of linear regression
1. 52,86 0,5671 r = 0,9938
a = 0,304 b = 0,005007
2. 78,94 0,6876
3. 104,80 0,8558
4. 130,43 0,9314
5. 155,84 1,1237
6. 181,03 1,1886
Figure 5. Linear regression standard curve of gallic acid standard
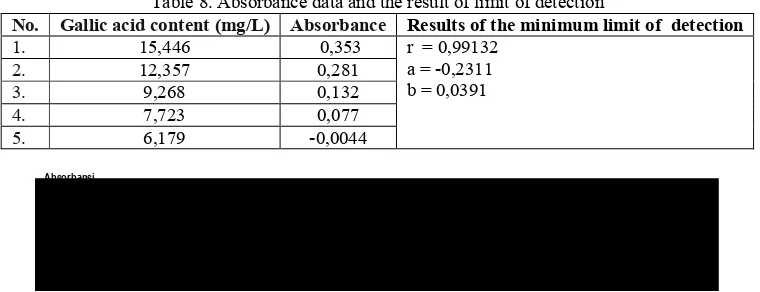
2. Determination of Limit of Detection
To determine the total phenol content in the sample was able to be detected by this method of was measured multiple content gallic acid standard. The measurement results can be seen in the following table. Limit content of standard solutions that can still be detected by spectrophotometric
method is 7,723mg / L. This means that the assay of
phenol with standard gallic acid hydrolyzed in samples with spectrophotometric methods measure
should be greater than 7,723 mg / L. Figure 6 shows
detection with a correlation coefficient of r =
0.99132.
Table 8. Absorbance data and the result of limit of detection
No. Gallic acid content (mg/L) Absorbance Results of the minimum limit of detection
1. 15,446 0,353 r = 0,99132
a = ,0,2311 b = 0,0391
2. 12,357 0,281
3. 9,268 0,132
4. 7,723 0,077
5. 6,179 ,0,0044
Figure 6. Linear regression curve of limit of detection
3. Determination of Precision
Precision test is done by making six replication of standard gallic acid which has been hydrolyzed. The absorbance obtained standard curve were plotted on the Y = 0.005007 x , 0.304 to get calculated content, and then calculated the
average content, standard deviation and coefficient of variation (Table 9). The coefficient of variation (CV) was 1.91%, less than 5% indicates that this method has a good precision (Peter & Richard, 2000).
Table 9. Absorbance data and ther result of precision test
No. Absorbance Gallic acid Content (mg/L) The results of precision test
1. 1,0774 154,46 Rata,rata = 159,192
SD = 3,048 CV = 1,91%
*Tidak dimasukkan karena dianggap alien
2. 1,1063 160,23
3. 1,0975 158,47
4. 1,1056 160,09
5. 1,1187 162,71
6. 1,2373 186,39*
4. Determination of Accuracy
Accuracy test (closeness) is done by calculating the recovery (recovery) rutin standard that has been hydrolyzed. Recovery percentage was calculated by making a comparison between content results of analysis with actual content. The absorbance obtained were plotted on standard curve to obtain calculated content, and then calculated the average content, standard deviation and recovery (Table 10).
Value of recovery (recovery) between
99.114% to 102.81%. These results meet the requirements due to the analyte content 0.01 <x <0.1% in the amount of 90,107%. The coefficient of variation are also eligible ie 1.91% (less than 5.3%) (Yowono & Indrayanto, 2005). This means the method meet the requirements, because especially the precision and accuracy have met the requirements, systematic errors which arise in the analysis can be avoided.
Table 10. The results of accuracy test No. Actual gallic acid content
(mg/L)
Gallic acid content From the result of analysis (mg/L)
The results of accuracy test (%)
1. 155,84 154,46 99,114
2. 155,84 160,23 102,81
3. 155,84 158,47 101,68
4. 155,84 160,09 102,73
Universitas Muhammadiyah Purwokerto HM 404 ISBN 978,602,14930,0,7 5. Determination of Total Phenol Content
The results of the determination of total phenolic content 50% ethanolic extract of mangosteen leaves are calculated as gallic acid can
be seen in the following table. The results of the assay 50% ethanolic extract of mangosteen leaves are 59.23%, 83.96% and 72.64% (w / w).
Table 11. The results of the determination of total phenol content was calculated as gallic acid The origin
mangosteen leaf area
Absorbance Total gallic acid content derived from Banyumas area has a large content of phenol is 71.94%.
Determination of Total Xanthon
Xanthon total concentration on ethanolic leaf extract of mangosteen determined by using the
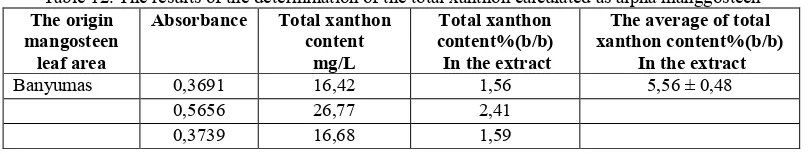
spectrophotometric method is by using a standard curve alpha mangostin. With the data y = 0.019 x +0.057 to 0.999 linearity. The results of the assay xanthon total 50% ethanolic extract of mangosteen leaves was 1.56%, 2.41% and 1.59% (w / w).
Table 12. The results of the determination of the total xanthon calculated as alpha manggosteen The origin ethanol derived from Banyumas has a total xanthon content relative to the average alpha mangostin is 5.56 ± 0.48% w / w%. Spectrophotometric assay method is the same as Aisha et al study (2013) which establishes the fruit skin extracts, and high performance liquid chromatography method on fruit skin extracts on research Yodhnu et al (2009).
Levels of total flavonoids (26.80 ± 15.9% w / w), total phenols (71.94 ± 12.37% w / w) and total xanthon (5.56 ± 0.48% w / w) high in Banyumas because lower temperatures (air temperature ranged from 21.4 to 30.9°C with an average temperature of 26.3°C) and higher light intensity. Mangosteen leaves taken from Somagede located in the mountains away from the surface of the ocean shore or sea wind effect is not so apparent (nonymous,
2006c; nonymous, 2002b). Rainfall in Banyumas district that is located on the slopes of Mount Slamet is quite high, 3,439 mm every year, making the soil fertile, mangosteen leaves in this area the determination of total flavonoid content with the results of the validation are eligible. The results of the determination of the total flavonoid content in the 50% ethanol extract was 26.80 ± 15.9%
b. Spectrophotometric method can be used for determination of total phenolic content with the results of the validation are eligible. The results of the determination of total phenolic content in 50% ethanol extract was 71.94 ± 12.37%
qualify. Xanthon total assay results in 50% ethanol extract was 5.56 ± 0.48%
2. Recommendations
This research is still a weakness, it is necessary to study more about:
determination of the best formulations to be used preservatives disa society.
ACKNOWLEDGEMENTS
This research was conducted as a research grant from the Private Higher Education Coordinating Region VI, the Ministry of Education and Culture, therefore, we say thank you profusely.
References
Aisha, AFA., Abu,Salah, KM., Ismail, Z., Majid, AMSA., 2013, Determination of total xanthones in Garcinia mangostana fruit rind extracts by ultraviolet (UV) spectrophotometry, Journal of Medicinal Plants Research Vol. 7(1), pp. 29,35, 3 January, 2013Anonim, 1994, Farmakope Indonsenesia, Edisi IV, Depkes RI, Jakarta Anonim, 2009, Manggis. Deputi Menegristek
Bidang Pendayagunaan dan Permasyarakatan Ilmu Pengetahuan dan Teknologi. http://www.ristek.go.id.[15 September 2009]. Anonim, 2006a, Data Pokok Pembangunan,
http://www.bantul.go.id/web.php?mod=datapo kok&baca=11tinggi_tempat.
Anonim, 2006b, Geografis,
http://bappeda.slemankab.go.id/downloads/Ke adaan%20Geografis.pdf
BadanPOM, 2011,
http://www.klubpompi.com/files/8.%20penyul uhan%20keamanan%20pangan/6.%20BTP.pd f, diakses 23 Januari 20111.
Badan POM, 2000, Parameter Standar Ekstrak, Depkes RI, Jakarta.
Backer, C. A, dan Van den Brink, Jr. R. C. B. 1968. Flora of Java, Vol. II, Published Under The Auspeces of The Rijkher Barium. Lieden. Bo, T. & Liu, H., 2004, Separation methods for
pharmacologically active xanthones, Journal of Chromatography B, Volume 812, Issues 1– 2, 5 December 2004, Pages 165–174.
Diniatik dan Suparman, 2010, Uji Antioksidan Ekstrak Daun dan Kulit Batang Manggis (Garcinia mangostana L) dengan Metode DPPH, Laporan Penelitian LPPM UMP. Hadi, S., 1996, Statistik 2, Jilid II, Cetakan XVI,
Penerbit Andi Offset, Yogyakarta.
Orak, H.H. 2006, Total Antioxidant Activities, Phenolics, Anthocyanins, Polyphenoloxidase Activities In Red Grape Varieties.Electronic Journal of Polish Agricultural University Food Science andTechnology, Volume 9, Issu – 118 htm.
Peter, C.M and Richard, E.Z., 2000, Statistical Methods in Analytical Chemistry, 2nd Ed., John Wiley and Sons Inc., New York, 9. Suparman dan Diniatik, 2010, Uji Aktivitas
Antibakteri Ekstrak Daun dan Kulit Batang Manggis (Garcinia mangostana L) Terhadap Staphylococcus aureus dan Escherichia coli, Jurnal Pharmacy ISSN 1693,3591.
Yodhnu S., Sirikatitham A., Wattanapiromsakul, C., 2009, Validation of LC for the Determination of α,Mangostin in Mangosteen Peel Extract: A Tool for Quality Assessment of Garcinia mangostana L., Journal of Chromatographic Science, Vol. 47, March 2009.