Full Terms & Conditions of access and use can be found at
http://www.tandfonline.com/action/journalInformation?journalCode=cbie20
Download by: [Universitas Maritim Raja Ali Haji] Date: 18 January 2016, At: 19:28
Bulletin of Indonesian Economic Studies
ISSN: 0007-4918 (Print) 1472-7234 (Online) Journal homepage: http://www.tandfonline.com/loi/cbie20
The village midwife program and infant mortality
in Indonesia
Ranjan Shrestha
To cite this article: Ranjan Shrestha (2010) The village midwife program and infant mortality in Indonesia, Bulletin of Indonesian Economic Studies, 46:2, 193-211, DOI: 10.1080/00074918.2010.486109
To link to this article: http://dx.doi.org/10.1080/00074918.2010.486109
Published online: 27 Jul 2010.
Submit your article to this journal
Article views: 284
View related articles
ISSN 0007-4918 print/ISSN 1472-7234 online/10/020193-19 © 2010 Indonesia Project ANU DOI: 10.1080/00074918.2010.486109
THE VILLAGE MIDWIFE PROGRAM
AND INFANT MORTALITY IN INDONESIA
Ranjan Shrestha
University of Montana, Missoula MT, and Australian National University
Indonesia introduced over 50,000 midwives into villages in the 1990s to provide primary care to women lacking easy access to health facilities. It seems plausi-ble to argue that the signiicant reduction in infant mortality that occurred from about 1993–94 was a consequence of this. The paper estimates the village midwife program’s impact on infant mortality, using data from the Indonesia Family Life Survey. Regressing mortality outcomes against choice of services would lead to bi-ased estimates because of the correlation between service choice and unobserved individual characteristics. Furthermore, non-random placement of midwives could bias estimates of their impact on infant mortality. This study overcomes such endo-geneity problems by aggregating mortality outcomes and program prevalence at district level and taking account of district ixed effects in estimating the program’s impact. Surprisingly, the results do not support the hypothesis that the midwife program was responsible for the observed decline in infant mortality.
INTRODUCTION
Following the Nairobi Safe Motherhood Conference in 1987, the issue of safe motherhood gained prominence in Indonesia. This led to the implementation of a village midwife program, which by 1997 had trained over 50,000 midwives and placed them in villages across the country. As in many developing countries, a majority of women in rural villages in Indonesia give birth in their homes, rely-ing on traditional birth attendants (TBAs) for help durrely-ing delivery. Poor maternal health and health care, and infections contracted during the birth process, are important causes of neonatal deaths. A program to introduce trained midwives in villages across Indonesia is therefore likely to have affected not only maternal mortality but also the likelihood of infant survival, by improving maternal health and the environment in which births take place.
Prior studies have shown an association between the introduction of Indonesia’s village midwife program and improvements in women’s health (through increases in body mass index) and in the nutrition of children (Frankenberg and Thomas 2001; Frankenberg, Suriastini and Thomas 2005). However, there is little evidence about the program’s effectiveness in improving birth outcomes. This paper exam-ines the role of the program in inluencing the mortality outcomes of infants. The main causes of neonatal deaths are related to maternal health, complications dur-ing pregnancy and the birth process, and the poor quality of care provided to neonates. It is therefore likely that the placement of trained midwives in villages
where there is limited access to health facilities and a heavy reliance on TBAs would cause a decline in infant mortality through reduced incidence of neonatal deaths. Although safe motherhood initiatives have not emphasised a reduction in infant mortality as their primary objective, this paper analyses whether initiatives to improve maternal health through community-based approaches, such as that undertaken in Indonesia, can play an additional role in lowering child death rates.
Empirical analysis of the inluence of birth facilities on infant mortality outcomes is dificult for various reasons. Regressing mortality outcomes on the choice of delivery facility or delivery assistant will lead to biased estimates, because these individual choices may be correlated with individual characteristics not observed in the data. For instance, the level of a woman’s understanding of health issues is not observed, but may be related to the likelihood of her consulting a trained mid-wife or a physician and using modern birth facilities, as well as to her intrinsic mor-tality risk. More knowledgeable women may be more likely to use modern facilities and may also have lower intrinsic mortality risk. Such unobserved characteristics, if not accounted for in the empirical speciication, would lead to biased estimates of the effect of use of birth facilities on the mortality risk of infants. Risks associ-ated with each pregnancy that affect choice of services are also not observed. It is likely that women with pregnancy complications choose trained midwives and are referred to physicians and modern facilities, while those with low-risk pregnancies give birth in the home without formally trained help. These unobserved risks, if not accounted for in the empirical speciication, would lead to spurious correlation between infant mortality outcomes and choice of birth facilities.
The empirical analysis in this paper is conducted using pregnancy information from three waves of the Indonesia Family Life Survey (IFLS, an ongoing longitu-dinal survey described in detail below). The IFLS data provide detailed informa-tion on each pregnancy – including the use of health facilities by women during pregnancy. In addition, the survey collects information at the community level through interviews with the village head and the head of the local Family Welfare Association (Pembinaan Kesejahteraan Keluarga, PKK) about various aspects of the community and about the introduction of government programs in the vil-lage; it also interviews staff of health and educational facilities in the community. Their responses allow us to identify when a village midwife was introduced in each community, making it possible to evaluate the effects of the program.
The next section briely discusses the village midwife program, the causes of child deaths in developing countries and the role that community-based initia-tives such as the village midwife program could play in lowering the mortal-ity rates of children. The following section surveys some previous studies of the effect of Indonesia’s village midwife program on maternal and child health. The paper then describes the IFLS – whose sample is used for the empirical analysis – and the trends in mortality rates and use of birth services shown by this sample. The inal section discusses the empirical methodology and presents the results.
EXPECTED EFFECTS OF THE VILLAGE MIDWIFE PROGRAM
The village midwife program (Bidan di Desa; literally ‘Midwives in Villages’) began in 1989, with the aim of making midwives available in all of Indonesia’s 68,000 villages to provide women with pre-natal care and assistance during
delivery. The program was implemented by the Ministry of Health in cooperation with other ministries – especially the Ministry of Home Affairs and the Ministry of Women’s Roles – and with the National Family Planning Coordinating Board (Badan Koordinasi Keluarga Berencana Nasional, BKKBN). It was supported by various international donor agencies such as the World Bank, the United Nations Children’s Fund (UNICEF), the World Health Organization (WHO) and the Aus-tralian Agency for International Development (AusAID). When the program began there were only 13,000 midwives available to village women in Indonesia (World Bank 1991). By the end of the 1996/97 budget year, 52,042 midwives were in place, covering 96% of the 54,120 villages that had been deemed to be in need of midwives in 1989 (Shiffman 2003).
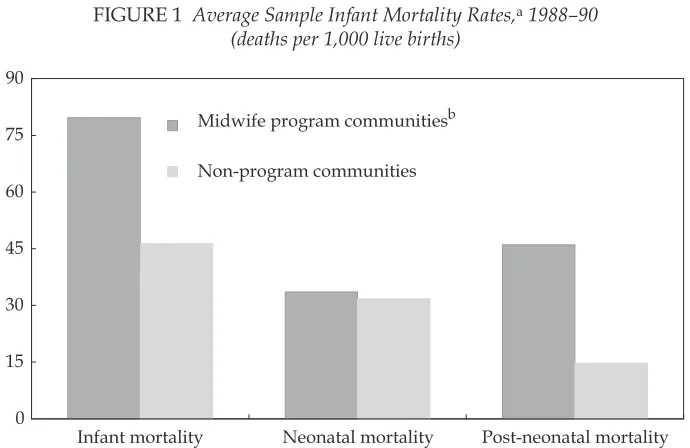
Figure 1 shows infant mortality rates1 for sample communities, averaged for
the years 1988 through 1990 (that is, when the program was just beginning), with the communities disaggregated according to whether they were included in the program at any time during the years 1988–99. This suggests that the communi-ties selected for inclusion (hereafter referred to as ‘program communicommuni-ties’) had much higher levels of infant mortality than those not included in the program (80 per 1,000 compared with 46 per 1,000). In turn, this was the consequence of
1 The infant mortality rate is deined as the number of deaths before the age of one per 1,000 live births. It is the sum of the neonatal mortality rate, deined as deaths during the irst month per 1,000 live births, and the post-neonatal mortality rate, deined as the number of deaths per 1,000 live births after the irst month and before the end of the irst year.
Infant mortality Neonatal mortality Post-neonatal mortality 0
15 30 45 60 75 90
Midwife program communitiesb
Non-program communities
FIGURE 1 Average Sample Infant Mortality Rates,a 1988–90 (deaths per 1,000 live births)
a Infant mortality is the sum of neonatal and post-neonatal mortality. For deinitions of mortality types, see footnote 1.
b Communities targeted by the village midwife program.
Source: Data from the 1993, 1997 and 2000 waves of the Indonesia Family Life Survey.
program communities having post-neonatal mortality rates three times those of non-program communities (46 per 1,000 compared with just 15 per 1,000); by contrast, neonatal mortality was roughly the same in program and non-program communities.2
The midwives were recruited after completing three years of study at nursing academies, and were given an additional year of midwifery training. The govern-ment assigned them to communities under a limited-term contract of three years, with the possibility of extension to six years; the midwives were then expected to start private practice after having built a client base in the village (Hull et al. 1998). They conducted public practice during normal working hours and were allowed to practise privately after hours. The midwives played a role in promoting com-munity participation in health, providing health and family planning services, working with TBAs, and referring complicated cases to health centres and hos-pitals (Frankenberg and Thomas 2001). Village midwives also had contact with the community in various other settings, allowing them to impart information to community members on nutrition, food preparation, sanitation and other health-promoting behaviours.
It seems plausible that the introduction of midwives in villages would have led to positive health outcomes in the communities in question. By providing help during the childbirth process to women who would otherwise have relied on TBAs, the midwives would have improved the environment in which women give birth in villages, especially in those communities that did not have easily accessible health facilities. By encouraging pre-natal check-ups and referring cli-ents to hospitals and puskesmas (community health centres) in case of complica-tions, a midwife based in the community could have helped women to obtain timely assistance and to avoid having complicated births at home, thus lowering infant mortality risk.
Of the estimated 10 million children worldwide who die every year before the age of ive, mainly in developing countries, about 37% die at the neonatal stage (Black, Morris and Bryce 2003). WHO estimates of the causes of child deaths in 2000–03 show that the main causes of death beyond the neonatal stage are pneumonia, diarrhoea and malaria, which account for 19%, 17% and 8%, respec-tively, of all childhood deaths (Bryce et al. 2005). Of the four million children who die during the neonatal stage, it is estimated for 2000 that the direct causes of such deaths are infections (36%), pre-term birth (28%), birth asphyxia (23%) and congenital abnormalities (7%) (Lawn, Cousens and Zupan 2005). Sepsis and pneumonia are the direct cause of 26% of neonatal deaths due to infections, while tetanus and diarrhoea are responsible for 7% and 3%, respectively (Lawn, Cous-ens and Zupan 2005). The extent of deaths caused by infections at the neonatal stage varies between countries, however. Countries with high neonatal mortality rates (over 45 per 1,000 live births) have a higher proportion of neonatal deaths caused by infections (almost 50%); those with low neonatal mortality rates have a lower incidence of such deaths – less than 20% due to sepsis and pneumonia, and negligible tetanus- and diarrhoea-related deaths (Lawn, Cousens and Zupan 2005).
2 The terms ‘village’ and ‘community’ are used interchangeably here, although some of the communities in the sample were actually in urban areas.
According to WHO estimates of the causes of under-ive child deaths in Indo-nesia for 2000–03, neonatal deaths constitute 38% of the total, followed by post-neonatal diarrhoea (18%), pneumonia (14%) and measles (5%). The number of deaths due to malaria and HIV/AIDS is negligible (WHO 2006). The main causes of neonatal deaths are pre-term birth, birth asphyxia and severe infec-tions (including pneumonia, sepsis and meningitis). Indonesia has been suc-cessful in nearly eradicating neonatal deaths from tetanus and diarrhoea: these easily preventable conditions each now cause only 1% of total neonatal deaths (WHO 2006).
Besides the direct causes of death, the major underlying cause of child deaths around the world, especially at the post-neonatal stage, is under-nutrition, which increases children’s susceptibility to infectious diseases (Black, Morris and Bryce 2003). At the neonatal stage, low birth-weight of infants, caused primarily by short gestation period and intra-uterine growth retardation, is an important indi-rect cause of death (Lawn, Cousens and Zupan 2005).
The breakdown of both direct and indirect causes of child deaths suggests that improvements in maternal health and the birth process, and care provided to neonates, can play an important role in lowering the risk of neonatal mortal-ity, while nutrition of children is a major determinant of mortality risk in the post-neonatal phase. The placement of village midwives in communities with-out easy access to health facilities can be expected to have improved mortality levels through the midwives’ inluence on these underlying causes of infant deaths. Given their training, the midwives are likely to have been more effective than TBAs in providing ante-natal, intra-partum and post-natal care. By lower-ing the reliance on TBAs in villages, the presence of midwives is likely to have led to better pre-natal care, earlier detection of birth complications and timely referral to health facilities, and to have provided better care for neonates – all of which seem likely to have lowered neonatal mortality. Furthermore, midwives could have played an important role in lowering the incidence of tetanus infec-tion in neonates through the use of a sterilised knife to cut the umbilical cord after birth, a practice about which TBAs are likely to have been more negligent. In the case of post-neonatal mortality, the midwives’ potential impact would arise from their involvement in community health activities, promoting vac-cination and providing better nutrition information to parents. Since the eco-nomic status of households is a strong driver of the quality of child nutrition, the midwives’ inluence would act primarily on the factors responsible for the deaths of neonates rather than of older infants. The village midwife program therefore seems likely to have had a stronger impact on neonatal than on post-neonatal mortality.
However, it is also possible that the increase in the supply of midwives brought about by the program may not have led to the expected improvements in the quality of health services available in rural areas. The initial impact of the midwives on health outcomes may have been limited by their inexperience and by their being placed in unfamiliar environments that could have affected their performance. Furthermore, concerns remain about the quality of pre-service and in-service training for health workers in Indonesia. Inadequate training could have adversely affected the quality of the services provided by the midwives (Rokx et al. 2010).
LITERATURE REVIEW
Frankenberg and Thomas (2001) studied the impact of the midwife program on adult health and on the birth-weights of children, using the irst and second waves of the IFLS (IFLS1 and IFLS2). Since the midwives were not placed ran-domly, and were more likely to be assigned to poorer communities and those at a greater distance from health centres, testing the impact of the policy needs to take the endogeneity of program placement into consideration. Frankenberg and Thomas (2001) use a quasi-experiment to compare health status in communities that gained a village midwife and in those that did not. Since midwives are likely to inluence the health of women more than that of men, women are considered the treatment group, and changes in their health are compared with changes in the health of other adults in the same community. The authors use adult body mass index (weight divided by height squared) as the health outcome variable of interest. Furthermore, they consider the impact of the village midwife program on the birth-weights of children, using community ixed effects and controlling for pregnancy-speciic and mother-speciic variables. The results suggest that there was an increase in birth-weights in a community after the introduction of a midwife.
Frankenberg, Suriastini and Thomas (2005) analyse the impact of the midwife program on the nutrition of children. Their dependent variable is the z-scores (computed as the deviation from the reference median divided by the refer-ence standard deviation) for children’s height for age, created by comparing the height of children in the IFLS sample with the US National Center for Health Sta-tistics (NCHS) anthropometric reference for a well-nourished child of the same age and sex. As midwives also provided basic preventive care and nutrition information, immunisation and some basic curative care, it could be expected that the village midwife program would have had an effect on children’s health. In order to account for the potential selective placement of midwives into com-munities, the authors look at the difference in outcomes for several cohorts of children surveyed in IFLS1 and IFLS2 that had varying degrees of exposure to the midwife program. Their results suggest that the nutrition status of dren who had full exposure to the midwife program is better than that of chil-dren in the same cohort in communities that had lower levels of exposure to the program.
Both the Frankenberg and Thomas (2001) and the Frankenberg, Suriastini and Thomas (2005) studies use data from IFLS1 and IFLS2 to look at health outcomes for adults and children. However, they do not directly investigate the impact of the village midwife program on the birth process itself. This impact was in fact the main objective of the midwife program, and it is the focus of the present study. It is also likely that, once the midwives had spent longer in the villages and established themselves in the communities, the program would come to have a stronger impact than in the period immediately following their place-ment. By including responses from IFLS3 we are able to study the longer-run impact of the program. Furthermore, if the presence of midwives improved the survival of infants, the results of the above studies would under-estimate the true impact of the program on child health, because the improvement would imply that the program increased survival rates of children who had lower health status.
DATA
The empirical analysis in this paper is conducted using the irst three waves of the IFLS. For IFLS1, conducted in 1993, various members of 7,224 households were interviewed, totalling over 22,000 individuals. The sample households were drawn from 312 enumeration areas in 13 of the 27 provinces in Indonesia at that time, and represent 83% of the population (Frankenberg and Karoly 1995).3
Sub-sequent waves of the IFLS conducted in 1997 and 2000 sought to interview the original IFLS1 households as well as new households formed when the original households split. The re-contact rates were high, with 94.4% of IFLS1 households re-contacted in IFLS2, and 95.3% of the original IFLS1 households re-contacted in IFLS3. Nearly 91% of IFLS1 households were interviewed in all three waves (Frankenberg and Thomas 2000; Strauss et al. 2004).
In each wave of the IFLS, detailed information was collected about various aspects of each pregnancy that ended during the ive years before the survey; this included data on pre-natal visits, place of delivery and assistance during delivery. The sample of pregnancies used for the empirical analysis in this paper is drawn from the 1993, 1997 and 2000 waves of the survey, and is restricted to pregnan-cies on which there is detailed information about delivery assistance and place of delivery, and to pregnancies that ended in a live birth. Stillbirths and miscarriages are excluded. The mortality outcomes are based on responses about whether the child is still alive, and if not, when or at what age it died.
Another unique feature of the IFLS is that it generates community-level infor-mation, including details about public and private facilities available for health care and schooling, collected from interviews with village heads, heads of village organisations, and authorities at the various community educational and health facilities. The community data also include the date of introduction of government programs in the community. This information facilitates evaluation of govern-ment interventions and allows us to control for various community characteristics in the empirical analysis.
In both IFLS2 and IFLS3, the village head and the head of the PKK were asked about the presence of a village midwife in the community, and when she was placed in the village. Their responses were used to determine the year of introduc-tion of the program in each community. In cases where the responses of the village head and the PKK head were not consistent, the average of the two was taken. In cases where information was missing in the IFLS2 data, responses from IFLS3 were used to determine the year of introduction. Using IFLS2 and IFLS3 data made it possible to determine whether a midwife left the village, which allowed us to create a time series of the periods when each community was served by a village midwife.
Trends in infant mortality and the use of birth facilities
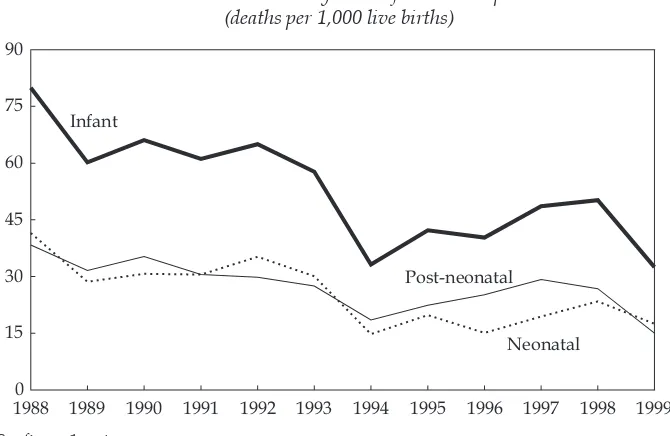
We begin with a descriptive analysis of infant mortality outcomes and delivery mechanisms, using information on the pregnancy histories of ‘ever-married’ women from the three waves of the IFLS. This gives an overall picture of the infant mortality situation in Indonesia and of trends in the use of reproductive health facilities. Figure 2 presents infant, neonatal and post-neonatal mortality
3 Indonesia Family Life Survey, <http://www.rand.org/labor/FLS/IFLS/>.
rates for the full sample of births from 1988 to 1999. It indicates a noticeable fall in infant mortality around 1993–94, coinciding with the large-scale introduction of midwives through the program into communities across Indonesia. Neonatal mortality fell by about the same amount as post-neonatal mortality during the period shown (notwithstanding some temporary divergence in the two series during the years 1996–97).
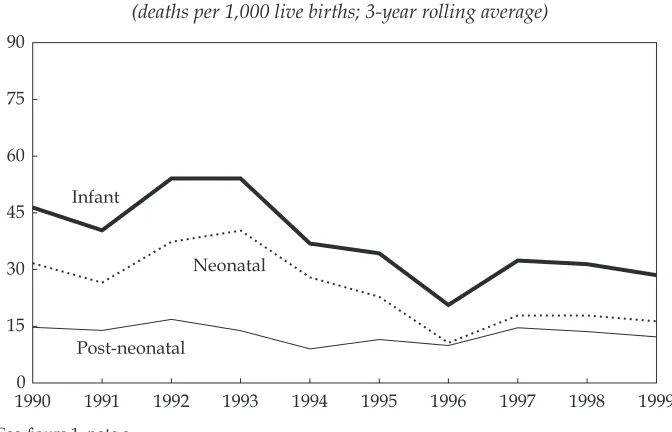
The picture differs in many respects if we focus on the program and non-pro-gram sample communities, as would be expected given their very different initial conditions. Figures 3a and 3b present infant mortality data for the two groups separately. Since there is considerable year-to-year volatility, three-year rolling average mortality rates are shown for greater clarity.4 It can be seen that a decline
in infant mortality is common to both groups, although it is much more tightly concentrated in the middle of the 1990s in the non-program communities.
Since infant mortality is the sum of neonatal and post-neonatal mortality, it is mainly of interest to focus on the latter two measures. Both neonatal and post-neonatal mortality declined steadily and signiicantly over the period through to about 1996–97 in the program group. By contrast, nearly all the decline in infant mortality in the non-program group is accounted for by declining neonatal mortality: its rate was similar for the program and non-program groups in 1990, but by 1999 it was signiicantly lower in the non-program group (16.3 per 1,000, compared with 21.8 per 1,000 in the program group). Although there was some
4 The raw data, including number of live births and standard errors for each mortality rate in each year, are contained in appendix 1.
1988 1989 1990 1991 1992 1993 1994 1995 1996 1997 1998 1999 0
15 30 45 60 75 90
Infant
Post-neonatal
Neonatal FIGURE 2 Mortality Ratesa for Full Sampleb
(deaths per 1,000 live births)
a See igure 1, note a.
b The full sample includes communities targeted and not targeted by the village midwife program.
Source: As for igure 1.
1990 1991 1992 1993 1994 1995 1996 1997 1998 1999 0
15 30 45 60 75 90
Infant
Post-neonatal
Neonatal
FIGURE 3a Mortality Ratesa for Midwife Program Communitiesb (deaths per 1,000 live births; 3-year rolling average)
a See igure 1, note a.
b Communities targeted by the village midwife program.
Source: As for igure 1.
1990 1991 1992 1993 1994 1995 1996 1997 1998 1999 0
15 30 45 60 75 90
Infant
Post-neonatal
Neonatal
FIGURE 3b Mortality Ratesa for Non-Program Communitiesb (deaths per 1,000 live births; 3-year rolling average)
a See igure 1, note a.
b Communities not targeted by the village midwife program.
Source: As for igure 1.
catch-up in the post-neonatal mortality rate by the program group, this measure remained much lower in the non-program group at the end of the period (12.2 per 1,000 compared with 28.5 per 1,000 in the program group).
The pattern of births by place of delivery differs greatly between the two groups (table 1). In terms of rough averages over the whole period, the proportion of births at home in the program group was twice as high as that in the non-program group, and the proportion in midwives’ clinics only a little over half. Accordingly, deliveries in hospitals, puskesmas and physicians’ clinics were 2–4 times more likely in the non-program group. The relative importance of births in puskesmas, physicians’ clinics and TBAs’ premises was always small for both groups.
Trends over time also differed considerably. A decline in the prevalence of home births was common to both groups, but was much stronger in the program group, where the initial level was twice as high. This trend was relected in an increase in deliveries at midwives’ clinics – again, much more pronounced in the program group – suggesting that the program had a strong impact on the choice of services by women. Both groups made increasing use of hospitals for deliveries, and again this trend was more pronounced in the program group.
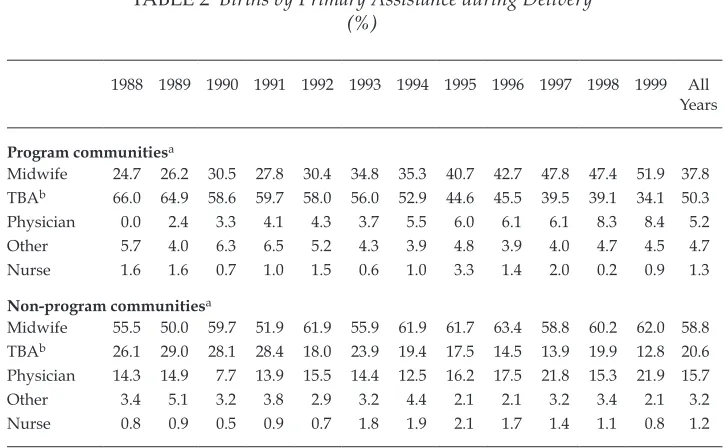
Table 2 shows that although a large fraction of births continue to take place with TBAs as the primary source of help for delivery, the percentage of such births roughly halved over the period in question for both groups, while remain-ing nearly three times as high for the program group by the end of the period.
TABLE 1 Births by Delivery Place (%)
1988 1989 1990 1991 1992 1993 1994 1995 1996 1997 1998 1999 All Years
Program communitiesa
Home 77.8 77.1 72.8 73.9 73.5 72.6 67.3 64.2 63.6 59.7 61.1 58.2 67.7 Midwife clinic 7.2 7.3 10.7 10.6 13.0 11.5 14.7 17.2 19.3 21.8 23.5 23.5 15.7 Hospital 5.2 7.3 7.0 7.5 6.1 7.9 8.9 12.4 11.3 12.7 11.1 11.5 9.4
Puskesmasb 2.1 3.3 3.0 2.9 2.4 3.5 3.1 2.1 2.0 1.8 2.8 3.2 2.7 Physician clinic 1.0 1.1 1.6 0.7 0.7 0.9 1.6 1.1 0.7 1.0 0.5 2.0 1.1 TBA premisesb 1.6 0.9 0.7 1.2 1.5 1.8 2.6 2.3 2.7 2.2 0.7 1.4 1.7
Non-program communitiesa
Home 38.7 39.7 45.7 40.9 33.5 36.0 33.1 37.5 26.4 26.9 30.1 26.9 34.4 Midwife clinic 22.7 23.4 23.1 24.5 27.3 29.3 30.7 29.4 30.2 34.7 31.3 30.6 28.2 Hospital 22.7 22.9 18.1 19.7 26.3 22.1 23.1 22.9 28.9 27.8 26.7 28.9 24.4
Puskesmasb 5.0 5.6 4.5 5.8 6.1 4.1 7.5 5.5 7.7 6.0 5.1 6.2 5.8 Physician clinic 5.9 4.2 3.2 3.4 2.9 3.6 4.4 3.4 5.1 2.8 5.1 6.6 4.1 TBA premisesb 1.7 1.9 1.8 1.9 0.7 2.3 1.3 0.9 1.3 1.4 1.7 0.4 1.4
a ‘Program communities’ are communities targeted by the village midwife program; ‘non-program communities’ are those not targeted by the program.
b Puskesmas = pusat kesehatan masyarakat (community health centre). TBA = traditional birth attendant.
Source: As for igure 1.
This is relected in large increases in the proportions of midwife- and physician-assisted births. By the end of the period, midwife-physician-assisted deliveries accounted for more than half the total in the program group and nearly two-thirds in the non-program group. The data in table 2 suggest that the program was targeted to communities that were under-served by trained health workers. Program com-munities had much higher reliance on TBAs on average for the whole period, with over 50% of births assisted by them, compared with just 21% in non-program communities. The fact that program communities saw a larger decline in the per-centage of TBA-assisted births, and a larger increase in the perper-centage of midwife- and physician-assisted births, suggests that women switched away from TBAs to trained midwives and doctors after the introduction of the village midwife program.
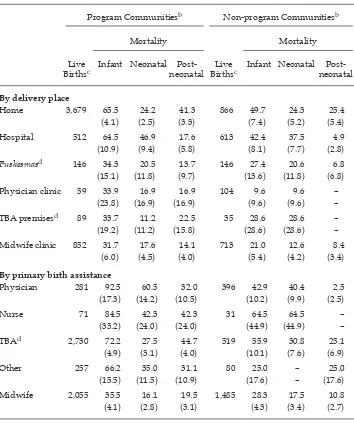
Average infant mortality rates for 1988–99 by place of delivery and primary source of delivery assistance are presented in table 3 for both the program and non-program sample communities.5 For both groups, infant mortality rates are
highest for births in the home, followed by those in hospitals, and in both cases the rates are much higher in the program group. The overall infant mortality rate in program communities for births in midwives’ clinics is similar to that for births at TBA premises and puskesmas.
5 A degree of caution is needed in interpreting the igures for some of the providers pre-sented on the table, as they are based on a small sample of births. This leads to a lack of precision and high variability in the estimates of the mortality rates.
TABLE 2 Births by Primary Assistance during Delivery (%)
1988 1989 1990 1991 1992 1993 1994 1995 1996 1997 1998 1999 All Years
Program communitiesa
Midwife 24.7 26.2 30.5 27.8 30.4 34.8 35.3 40.7 42.7 47.8 47.4 51.9 37.8 TBAb 66.0 64.9 58.6 59.7 58.0 56.0 52.9 44.6 45.5 39.5 39.1 34.1 50.3 Physician 0.0 2.4 3.3 4.1 4.3 3.7 5.5 6.0 6.1 6.1 8.3 8.4 5.2 Other 5.7 4.0 6.3 6.5 5.2 4.3 3.9 4.8 3.9 4.0 4.7 4.5 4.7 Nurse 1.6 1.6 0.7 1.0 1.5 0.6 1.0 3.3 1.4 2.0 0.2 0.9 1.3
Non-program communitiesa
Midwife 55.5 50.0 59.7 51.9 61.9 55.9 61.9 61.7 63.4 58.8 60.2 62.0 58.8 TBAb 26.1 29.0 28.1 28.4 18.0 23.9 19.4 17.5 14.5 13.9 19.9 12.8 20.6 Physician 14.3 14.9 7.7 13.9 15.5 14.4 12.5 16.2 17.5 21.8 15.3 21.9 15.7 Other 3.4 5.1 3.2 3.8 2.9 3.2 4.4 2.1 2.1 3.2 3.4 2.1 3.2 Nurse 0.8 0.9 0.5 0.9 0.7 1.8 1.9 2.1 1.7 1.4 1.1 0.8 1.2
a See table 1, footnote a.
b TBA = traditional birth attendant.
Source: As for igure 1.
TABLE 3 Infant Mortality Rates by Delivery Place and Primary Assistance during Delivery, 1988–99a
(%)
Program Communitiesb Non-program Communitiesb
Mortality Mortality
Live
Birthsc Infant Neonatal Post- neonatal BirthsLive c Infant Neonatal Post- neonatal
By delivery place
Home 3,679 65.5 24.2 41.3 866 49.7 24.3 25.4
(4.1) (2.5) (3.3) (7.4) (5.2) (5.4)
Hospital 512 64.5 46.9 17.6 613 42.4 37.5 4.9
(10.9) (9.4) (5.8) (8.1) (7.7) (2.8)
Puskesmasd 146 34.3 20.5 13.7 146 27.4 20.6 6.8
(15.1) (11.8) (9.7) (13.6) (11.8) (6.8)
Physician clinic 59 33.9 16.9 16.9 104 9.6 9.6 –
(23.8) (16.9) (16.9) (9.6) (9.6) –
TBA premisesd 89 33.7 11.2 22.5 35 28.6 28.6 –
(19.2) (11.2) (15.8) (28.6) (28.6) –
Midwife clinic 852 31.7 17.6 14.1 713 21.0 12.6 8.4
(6.0) (4.5) (4.0) (5.4) (4.2) (3.4)
By primary birth assistance
Physician 281 92.5 60.5 32.0 396 42.9 40.4 2.5
(17.3) (14.2) (10.5) (10.2) (9.9) (2.5)
Nurse 71 84.5 42.3 42.3 31 64.5 64.5 –
(33.2) (24.0) (24.0) (44.9) (44.9) –
TBAd 2,730 72.2 27.5 44.7 519 55.9 30.8 25.1
(4.9) (3.1) (4.0) (10.1) (7.6) (6.9)
Other 257 66.2 35.0 31.1 80 25.0 – 25.0
(15.5) (11.5) (10.9) (17.6) – (17.6)
Midwife 2,055 35.5 16.1 19.5 1,485 28.3 17.5 10.8
(4.1) (2.8) (3.1) (4.3) (3.4) (2.7)
a Standard errors are shown in parentheses. In some cases standard errors are the same as the mortal-ity rate as a consequence of there being only a single death recorded. ‘–’ = no deaths recorded in this category.
b See table 1, note a.
c The sum of live births by delivery place in this table does not match that by birth assistance, because mortality rates for the small number of births in the ‘other’ category for delivery place are not reported here. Total live births in this table do not equal the totals in appendix 1, because the latter includes births with missing delivery place or delivery help information, whereas table 3 does not.
d See table 1, note b.
Source: Author’s calculations.
The igures become more informative when neonatal and post-neonatal mor-tality are separated. In both the program and non-program communities, by far the highest neonatal mortality rates are for births in hospitals, while post-neonatal mortality rates are highest for those born in the home. The high rates of neona-tal morneona-tality for hospineona-tal births could be due to the referral of high-risk preg-nancies – women with birth complications being selected into this sample – or it could relect shortcomings in the services provided in hospitals; these alternatives cannot be disentangled in the present analysis. Most of the mortality igures are higher for the communities covered by the village midwife program. These com-munities show higher post-neonatal mortality rates for all categories, probably relecting the lower level of economic development of areas chosen for placement of village midwives.
Infant mortality rates also vary by the type of delivery assistance. In both the program and non-program communities, the overall infant mortality rate is lower for babies delivered by midwives than for those delivered by physicians, nurses and TBAs. Neonatal mortality rates for midwife-assisted births remain much lower than those for TBA-assisted births in both types of communities. The post-neonatal mortality rate is higher for TBA-assisted births than for other categories, while neonatal mortality rates are highest for babies delivered by physicians and nurses.
The neonatal mortality rates associated with different types of delivery assist-ance may relect the quality of pre-natal care, delivery services or intrinsic maternal health, as well as the tendency for high-risk deliveries to be assisted by physi-cians and nurses. On the other hand, the post-neonatal mortality rates associated with each category may relect an income effect, especially in the non-program communities: physician-assisted deliveries are most likely to be to higher-income women, while TBA-assisted births tend to be the choice of lower-income women, who raise children with fewer resources and lower-quality nutrition, increasing their susceptibility to childhood diseases. The infant mortality rates are higher for each type of provider in the sample restricted to communities where midwives were introduced, suggesting that the program was targeted to areas with charac-teristics that lead to higher child mortality rates.
EMPIRICAL ANALYSIS
Estimating the impact of midwives on the mortality risk of children is complicated by the fact that women choose the facility where they give birth and the type of assistance they receive during delivery. That choice may relect various character-istics of the individual that are not observed in the data, so an empirical framework regressing the mortality outcome of births against the choice of birth facility or services will lead to biased estimates. Furthermore, there is an unobserved degree of frailty for each birth that would affect the choice of services. As is apparent from the descriptive trends presented above, for example, mortality rates are higher for babies delivered in hospitals and also for those delivered by physicians and nurses. This probably relects the choice made by women with high frailty to use these services, or the fact that the women with birth complications are likely to be referred to hospitals and physicians, causing higher mortality rates to be associ-ated with these providers.
The task of estimating the impact of the village midwife program on child mortality risk is further complicated by the fact that the midwives were not randomly assigned to villages. Poorer communities and those located further away from health centres were likely to be targeted earlier under this pro-gram than other communities (Frankenberg and Thomas 2001). A propro-gram effect estimated by directly regressing infant mortality outcomes against the presence of midwives in the community will be biased, since the placement of a midwife in a particular community may be dependent on unobserved community characteristics.
In order to overcome bias due to unobserved heterogeneity at the individual and community levels, the programmatic effect is estimated here by aggregating birth outcomes at the kabupaten (district) level for each year.6 Using data on the timing
of midwife placement in each community, we can obtain the fraction of communi-ties in each kabupaten that had a program midwife for each year. A kabupaten ixed effect is used to account for unobserved heterogeneity across districts that could be correlated with the program placement rule. Changes over time not related to the program could also affect infant mortality rates across all districts. Economic growth or increased levels of economic development, as well as rises in education levels and awareness about health issues over time, could have contributed to lower infant mortality rates. Demographic changes associated with reduced fertil-ity rates, such as reductions in high-parfertil-ity births7 (as families stop child-bearing
after having fewer children owing to a decline in desired family size), increases in maternal age, and longer spacing between births could also be associated with the infant mortality reductions. These time-speciic effects are incorporated into the empirical framework through the use of dummy variables for each year to capture variation from one year to the next, as shown in equation (1), and of a time-trend variable to capture an upward or downward trend in infant mortality rates over time, as shown in equation (2):
Mjt=β0+β1MWjt+αj+γt+∈jt (1)
Mjt =β0+β1MWjt+αj+β2τ+∈jt (2)
where Mjt is the mortality rate for births during year
t
in kabupaten j; MWjt is the fraction of communities in kabupaten j that had midwives in yeart
; αjis thetime-invariant kabupaten-speciic effect; γt is the location-invariant time effect; and τ is the time-trend variable that takes values incrementing by one for each sub-sequent year. The estimated coeficient β1 is the effect of the village midwife pro-gram on the mortality rate for births, and can be interpreted as the change in the mortality rate in a kabupaten when it goes from not having a village midwife pro-gram in any of its communities to having the propro-gram in all its communities. The
6 For urban areas, the aggregation is at the level of the kota (municipality), the urban equivalent of the kabupaten. For simplicity, I refer to all such aggregations as being at the
kabupaten level.
7 The term ‘parity’ is used in demographic and medical literature to indicate the number of times a woman has given birth. Parity 1 refers to the irst birth, parity 2 to the second, and so on. High-parity births of order 7 and over are associated with higher infant mortal-ity risks (Hobcraft, McDonald and Rutstein 1985).
estimated coeficient β2 can be interpreted as the change in mortality rate per year associated with changes in unobserved variables across the kabupaten over time.
RESULTS
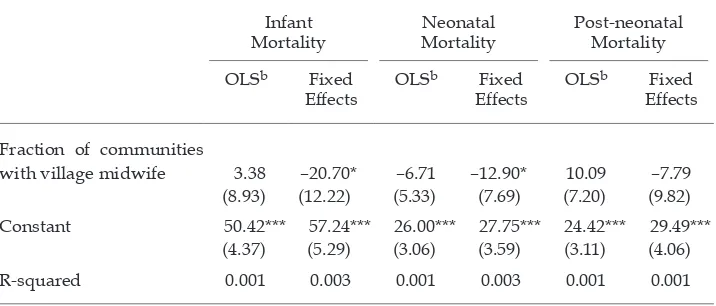
The results are presented for the aggregate period-speciic kabupaten infant mortal-ity rate as the dependent variable, and then for neonatal and post-neonatal mor-tality rates separately. Table 4 irst presents the results for ordinary least squares (OLS) regressions without the ixed and time-speciic effects and then presents the results with the inclusion of ixed effects without time-speciic effects. Table 5 presents the ixed-effects results with the inclusion of time-speciic effects.
Table 4 presents the results for the aggregate infant mortality rate and its two components at the kabupaten level as the dependent variables. The estimated coeficients for midwife coverage in the OLS regressions are positive for infant mortality and post-neonatal mortality and negative for neonatal mortality, but none of them is statistically signiicant. The OLS speciication does not account for kabupaten ixed effects, and therefore does not account for the endogeneity of program placement. By contrast, the ixed-effects results suggest that once time-invariant kabupaten-speciic effects are taken into account, there are negative and weakly signiicant relationships between the coverage of the village midwife pro-gram in the kabupaten and the infant and neonatal mortality rates; the relationship with the post-neonatal rate remains insigniicant.
The estimated ixed-effects coeficients suggest that full coverage of a kabupaten by the program is associated with a decline in infant mortality rate of 20.7, of
TABLE 4 Regression Results with Kabupaten-speciic Effectsa
Infant
Mortality MortalityNeonatal Post-neonatal Mortality OLSb Fixed
Effects OLS
b Fixed
Effects OLS
b Fixed
Effects
Fraction of communities
with village midwife 3.38 –20.70* –6.71 –12.90* 10.09 –7.79
(8.93) (12.22) (5.33) (7.69) (7.20) (9.82)
Constant 50.42*** 57.24*** 26.00*** 27.75*** 24.42*** 29.49***
(4.37) (5.29) (3.06) (3.59) (3.11) (4.06)
R-squared 0.001 0.003 0.001 0.003 0.001 0.001
a Dependent variables are aggregated, period-speciic mortality rates at the kabupaten level, expressed as deaths per 1,000 live births. Robust standard errors are shown in parentheses. *** signiicant at 1%; ** signiicant at 5%; * signiicant at 10%.
Number of kabupaten: 149. Number of observations: 1,590 (not all kabupaten observed a birth in all 12 years [1988–99] in the sample).
b OLS = ordinary least squares.
Source: Author’s calculations.
which 12.9 is at the neonatal stage and 7.8 at the post-neonatal stage. The presence of midwives would have improved post-neonatal mortality through the promo-tion of vaccinapromo-tion and better nutripromo-tion of children, but the results suggest that the program did not have a signiicant effect in lowering later infant mortality.
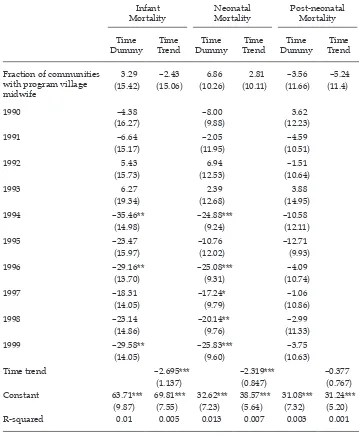
TABLE 5 Fixed Effects Controlling for Time-speciic Effectsa
Infant
Mortality Neonatal Mortality Post-neonatal Mortality
Time
Dummy TrendTime DummyTime TrendTime DummyTime TrendTime
Fraction of communities with program village midwife
3.29 –2.43 6.86 2.81 –3.56 –5.24
(15.42) (15.06) (10.26) (10.11) (11.66) (11.4)
1990 –4.38 –8.00 3.62
(16.27) (9.88) (12.23)
1991 –6.64 –2.05 –4.59
(15.17) (11.95) (10.51)
1992 5.43 6.94 –1.51
(15.73) (12.53) (10.64)
1993 6.27 2.39 3.88
(19.34) (12.68) (14.95)
1994 –35.46** –24.88*** –10.58
(14.98) (9.24) (12.11)
1995 –23.47 –10.76 –12.71
(15.97) (12.02) (9.93)
1996 –29.16** –25.08*** –4.09
(13.70) (9.31) (10.74)
1997 –18.31 –17.24* –1.06
(14.05) (9.79) (10.86)
1998 –23.14 –20.14** –2.99
(14.86) (9.76) (11.33)
1999 –29.58** –25.83*** –3.75
(14.05) (9.60) (10.63)
Time trend –2.695*** –2.319*** –0.377
(1.137) (0.847) (0.767)
Constant 63.71*** 69.81*** 32.62*** 38.57*** 31.08*** 31.24***
(9.87) (7.55) (7.23) (5.64) (7.32) (5.20)
R-squared 0.01 0.005 0.013 0.007 0.003 0.001
a Number of kabupaten: 149. Number of observations: 1,590. Robust standard errors are shown in parentheses. *** signiicant at 1%; ** signiicant at 5%; * signiicant at 10%.
Source: Author’s calculations.
Table 5 presents estimates for the kabupaten ixed-effects speciications that include controls for period-speciic effects, using time dummies and a time trend separately. When time dummies are used to control for period-speciic effects, the results show a loss of signiicance in the relationship between the midwife pro-gram and infant and neonatal mortality, with the coeficients becoming positive. The coeficient on midwife program coverage remains negative in the case of post-neonatal mortality and it is not statistically signiicant. These results do not support the hypothesis that the program had a signiicant effect on infant mortal-ity rates, but suggest, rather, that the observed fall in mortalmortal-ity rates is associated primarily with changes across the kabupaten over time that are not identiied in the model. The estimated coeficients for the dummies for 1994 and later years suggest that there were signiicant reductions in infant mortality during these periods relative to 1988 and 1989, which are the excluded years. This reduction was primarily through lower neonatal mortality rates, there being no signiicant declines in post-neonatal mortality. Similarly, the results for the ixed-effects spec-iication with the time-trend suggest a signiicant yearly rate of decline in infant mortality over time, without any signiicant relationship between program effort and infant mortality rates. In short, it is dificult to identify the main driving fac-tors behind the fall in infant mortality rates within these empirical speciications.
CONCLUSIONS
Reducing the number of child deaths is a major policy objective in developing countries. Since neonatal deaths constitute a signiicant portion of such deaths, it is important to understand their determinants and propose effective policy meas-ures to lower their incidence. This paper used data from the Indonesia Family Life Survey to study the role of Indonesia’s village midwife program in lowering the incidence of infant mortality. Mortality outcomes were aggregated at the district level and the program effect was estimated using district ixed effects to account for non-random program placement. Although the primary purpose of this community-based program was to promote safe motherhood and lower mater-nal mortality, the results from using only a ixed-effects speciication suggest an association between the program and lower neonatal mortality rates, without any signiicant effect on post-neonatal deaths. However, once time-speciic effects are included in the empirical speciication, the coeficient on the effect of pro-gram effort on infant mortality loses signiicance. The results do not support the hypothesis that the program had a signiicant effect in lowering infant mortality rates during the 1990s. The decline in infant mortality is therefore attributed pri-marily to unexplained changes over time.
REFERENCES
Black, Robert E., Morris, Saul S. and Bryce, Jennifer (2003) ‘Where and why are 10 million children dying every year?’, Lancet 361: 2,226–34.
Bryce, Jennifer, Boschi-Pinto, Cynthia, Shibuya, Kenji and Black, Robert E. (2005) ‘WHO estimates of the causes of death in children’, Lancet 365: 1,147–52.
Frankenberg, E. and Karoly, L. (1995) The 1993 Indonesian Family Life Survey: Overview and Field Report, RAND Corporation, Santa Monica CA.
Frankenberg, Elizabeth and Thomas, Duncan (2000) ‘The Indonesia Family Life Survey (IFLS): study design and results from waves 1 and 2’, DRU-2238/1- NIA/NICHD, RAND Corporation, Santa Monica CA.
Frankenberg, Elizabeth and Thomas, Duncan (2001) ‘Women’s health and pregnancy out-comes: do services make a difference?’, Demography 38 (2): 253–65.
Frankenberg, Elizabeth, Suriastini, Wayan and Thomas, Duncan (2005) ‘Can expanding access to basic healthcare improve children’s health status? Lessons from Indonesia’s “midwife in the village” program’, Population Studies 59 (1): 5–19.
Hobcraft, J.N., McDonald, J.W. and Rutstein, S.O. (1985) ‘Demographic determinants of infant and early child mortality: a comparative analysis’, Population Studies 39 (3): 363–85.
Hull, Terence H., Widayatun, Raharto, A. and Setiawan, B. (1998) ‘Village midwives in Maluku’, Center for Population and Manpower Studies, Indonesian Institute of Sci-ences, and Demography Program, Research School of Social SciSci-ences, Australian National University, Canberra, for the Australian Agency for International Develop-ment (AusAID).
Lawn, Joy E., Cousens, Simon and Zupan, Jelka (2005) ‘4 million neonatal deaths: when? where? why?’, Lancet 365: 891–900.
Rokx, Claudia, Giles, John, Satriawan, Elan, Marzoeki, Puti, Harimurti, Pandu and Yavuz, Elif (2010) New Insights into the Provision of Health Services in Indonesia: A Health Work-force Study, World Bank, Washington DC.
Shiffman, Jeremy (2003) ‘Generating political will for safe motherhood in Indonesia’, Social Science and Medicine 56: 1,197–207.
Strauss, J., Beegle, K., Sikoki, B., Dwiyanto, A., Herawati, Y. and Witoelar, F. (2004) The Third Wave of the Indonesia Family Life Survey (IFLS): Overview and Field Report, WR-144/1- NIA/NICHD, RAND Corporation, Santa Monica CA.
WHO (World Health Organization) (2006) World Health Statistics 2006, WHO, Geneva. World Bank (1991) Staff Appraisal Report Indonesia: Fifth Population Project (Family Planning
and Safe Motherhood), Washington DC.
APPENDIX 1 Sample Infant Mortality Rates a, b
1988 1989 1990 1991 1992 1993 1994 1995 1996 1997 1998 1999 All Years
Program communitiesc
Number of
live births 194 450 430 414 460 541 382 523 560 504 422 557 5,437
Infant 82.5 84.4 72.1 62.8 73.9 59.2 44.5 42.1 51.8 51.6 54.5 44.8 58.7 mortality (19.8) (13.1) (12.5) (11.9) (12.2) (10.2) (10.6) (8.8) (9.4) (9.9) (11.1) (8.8) (3.2) Neonatal 30.9 42.1 27.9 24.2 37.0 24.0 18.3 21.0 17.9 15.9 26.1 23.3 25.2 mortality (12.5) (9.5) (7.9) (7.6) (8.8) (6.6) (6.9) (6.3) (5.6) (5.6) (7.8) (6.4) (2.1) Post-neonatal
mortality (15.9) (9.5) (9.9) (9.5) (8.8) (7.9) (8.2) (6.3) (7.7) (8.3) (8.1) (6.2)51.5 42.2 44.2 38.6 37.0 35.1 26.2 21.0 33.9 35.7 28.4 21.5 (2.4)33.5
Non-program communitiesd
Number of
live births 119 214 221 208 278 222 160 235 235 216 176 242 2,526
Infant 75.6 9.3 54.3 57.7 50.4 54.1 6.3 42.6 12.8 41.7 39.8 4.1 36.4 mortality (24.3) (6.6) (15.3) (16.2) (13.1) (15.2) (6.3) (13.2) (7.3) (13.6) (14.8) (4.1) (3.7) Neonatal 58.8 0.0 36.2 43.3 32.4 45.1 6.3 17.0 8.5 27.8 17.1 4.1 23.8 mortality (21.7) – (12.6) (14.1) (10.6) (14.0) (6.3) (8.5) (6.0) (11.2) (9.8) (4.1) (3.0) Post-neonatal
mortality 16.8 9.3 18.1 14.4 18.0 9.0 –
e 25.5 4.3 13.9 22.7 –e 12.7 (11.8) (6.6) (8.9) (8.3) (8.0) (6.4) –e (10.3) (4.3) (8.0) (11.3) –e (2.2)
a As for igure 1.
b Standard errors are shown in parentheses.
c Sample of live births from enumeration areas where village midwives were placed under the pro-gram at any time during the study time-frame (1988–99).
d Sample of live births from enumeration areas where no village midwives were placed under the program during the study time-frame (1988–99).
e ‘–’ indicates that no deaths were recorded in this category for the year in question.
Source: As for igure 1.