Full Terms & Conditions of access and use can be found at
http://www.tandfonline.com/action/journalInformation?journalCode=cbie20
Download by: [Universitas Maritim Raja Ali Haji] Date: 18 January 2016, At: 19:58
Bulletin of Indonesian Economic Studies
ISSN: 0007-4918 (Print) 1472-7234 (Online) Journal homepage: http://www.tandfonline.com/loi/cbie20
SURVEY OF RECENT DEVELOPMENTS
Vincent Ashcroft & David Cavanough
To cite this article: Vincent Ashcroft & David Cavanough (2008) SURVEY OF RECENT DEVELOPMENTS, Bulletin of Indonesian Economic Studies, 44:3, 335-363, DOI: 10.1080/00074910802395310
To link to this article: http://dx.doi.org/10.1080/00074910802395310
Published online: 06 Nov 2008.
Submit your article to this journal
Article views: 113
View related articles
ISSN 0007-4918 print/ISSN 1472-7234 online/08/030335-29 © 2008 Indonesia Project ANU DOI: 10.1080/00074910802395310
SURVEY OF RECENT DEVELOPMENTS
Vincent Ashcroft and David Cavanough*
The Treasury, Canberra
SUMMARY
The second half of 2008 is proving to be a time of unprecedented global volatility, and the sound performance of the Indonesian economy over the fi rst half will be
diffi cult to maintain. With growth for the year projected to remain around 6%,
Indonesia is relatively well placed to face the challenges of the unfolding global
fi nancial crisis, but the risks to the outlook are increasing. The crisis has begun
to impact directly, with trading on the Indonesian stock market suspended on 8 October after an alarming one-day fall of 10% in share prices. Sustained pressure on the currency since mid-August has also seen Bank Indonesia running down its sizable foreign exchange reserves in attempting to support the rupiah. The authorities are taking steps to relieve liquidity pressures in the fi nancial system,
but will also need to address medium-term issues of stability, especially in rela-tion to infl ation; interest rate increases have so far done little to contain prices.
Although exports have remained surprisingly strong, rapid import growth has resulted in a small current account defi cit. Growth of exports is likely to
deceler-ate as demand in developed economies slows, putting further pressure on the balance of payments and the currency.
The 2009 budget refl ects the government’s positive outlook, but the under lying
assumptions about growth, infl ation and interest rates seem rather optimistic. Tax
revenue has been increasing strongly, allowing the government to allocate sig-nifi cant new spending to education, in particular; however the budget remains
hostage to global oil prices, with energy subsidies still very large despite the unpopular recent increases in domestic fuel prices. Other issues likely to affect voting in the 2009 elections include scheduled electricity blackouts in Jakarta in response to demand continuing to outstrip supply; the government’s apparent indifference to the fate of the victims of the Sidoarjo mud disaster; and its failure to make much impact on the level of poverty.
Despite asking major donors for additional loans for budget support, the gov-ernment has unveiled a new strategy for managing development partnerships. This will encourage smaller donors to operate through multi-donor arrangements and larger donors to use government systems for more of their programs—a signal that the government intends to shape its relationships with donors despite the global crisis.
* The views expressed in this article, including those in box 2, are those of the authors and do not refl ect the views of the Australian government or of the departments to which the authors belong.
cbieDec08b.indb 335
cbieDec08b.indb 335 31/10/08 4:52:44 PM31/10/08 4:52:44 PM
INTRODUCTION
The domestic fuel price changes in May represent a signifi cant win for policy over
politics, although they may have harmed President Susilo Bambang Yudhoyono’s (SBY’s) popularity.1 The economy continued to grow strongly through the second
quarter (Q2) of 2008, and Indonesia proved resilient in Q3 in the face of consider-able uncertainty in global fi nancial markets generated by the crisis in the US. The
negative impact of the global turmoil became more noticeable in September, how-ever, and by early October the fi nancial markets were under considerable strain.
The diffi culty for the government in the months remaining before the election
in 2009 is how to manage the economy within a volatile global setting. Falling commodity prices are now leading to signifi cant adjustments in stock markets
worldwide, which have shed much of the commodity-driven gains of the last 1–2 years. Meanwhile, the continuing fi nancial crisis in the US is destabilising
the world economy, putting increasing pressure on global credit and capital mar-kets. Balancing a reform agenda with the realities of the global economy and local pressures from domestic politics will require deft management. There is likely to be a concerted push from domestic constituencies to put growth fi rst rather than
try to reduce infl ation. While falling commodity prices will help moderate infl
a-tion (as would somewhat tighter monetary policy), in the immediate term some price increases may still occur, since changes in international prices feed into local prices with a lag. In addition, signifi cant fi nancial problems in the US may lead to
increased risk aversion in global credit markets, requiring Indonesia to be more mindful of its macroeconomic settings than ever.
Most macroeconomic indicators may remain positive, but if markets lose
con-fi dence in policy settings there is increasing risk of capital fl ight in the short run.
Nervousness evident in the currency and stock markets in September and early October could turn into a more serious problem if Bank Indonesia (BI) is per-ceived to lack conviction in its monetary policy settings. The 2009 budget fore-casts continued robust expansion of output, by around 6%, despite major trading partner (US, European and Japanese) economies contracting. Foreign exchange reserves remain substantial at almost $60 billion, providing the central bank with considerable means to manage these diffi cult conditions.
GROWTH
Second quarter national accounts for 2008 show the economy continuing to grow strongly, at 6.4% higher year-on-year (y-o-y) (table 1), despite the prospect of a signifi cant downturn in the world economy. Growth has now exceeded 6% for
seven consecutive quarters, a pace that may prove diffi cult to maintain.
Consen-sus Economics (2008: 12) predicts GDP growth for 2008 of 5.9%, implying that market economists expect the annualised growth rate for the second half to fall to around 5.6%. Likewise, the International Monetary Fund’s World Economic Out-look, released on 7 October, revised its world growth forecast for 2009 down from 3.9% to 3.0%, and its estimate for Indonesia’s GDP growth in 2009 from 6.3% to 5.5% (IMF 2008a).
1 Recent polling by Jakarta’s Centre for Strategic and International Studies showed Mega-wati Soekarnoputri as the candidate likely to get the most votes in a fi rst presidential elec-tion round, polling some 8% ahead of the president (JP, 15/7/2008).
cbieDec08b.indb 336
cbieDec08b.indb 336 31/10/08 4:52:45 PM31/10/08 4:52:45 PM
The growth of private consumption (which accounts for almost 60% of GDP) softened slightly from 5.7% y-o-y to 5.3%, presumably refl ecting lower consumer
purchasing power following the fuel price hikes in May 2008. Consumer confi
-dence rebounded strongly in July from record lows (Danareksa Research Institute 2008); however, it may well fall again in the face of the global fi nancial crisis. The
growth of investment (comprising almost a quarter of GDP) fell only slightly from 15.4% in Q1 to 12.8% in Q2 despite tighter international credit conditions. Con-tinued strong investment growth is refl ected in rising investment in machinery
and equipment (28%), construction (8%) and transport (40%). Tighter credit con-ditions both in Indonesia and offshore are likely to curb investment spending in the second half of 2008, and the increasingly severe disturbance to global markets from the US fi nancial crisis intensifi es the risk that GDP growth will moderate
over the next 12 to 18 months.
TABLE 1 Components of GDP Growth (2000 prices; % p.a. year on year)
Mar-07 Jun-07 Sep-07 Dec-07 Mar-08 Jun-08
Gross domestic product 6.1 6.4 6.5 6.3 6.3 6.4
Non-oil & gas GDP 6.7 7.1 6.9 7.0 6.8 6.9
By expenditure
Household consumption 4.7 4.7 5.1 5.6 5.7 5.3
Government consumption 3.7 3.8 3.3 2.0 4.7 2.2
Investment 7.0 6.9 10.4 12.1 15.4 12.8
Building construction 8.4 7.7 8.3 9.9 7.9 8.0
Machinery & equipment 12.6 24.1 26.3 25.7 45.2 28.2
Transport –25.8 –28.6 –1.1 13.5 53.7 39.9
Exports 8.1 9.8 6.9 7.3 15.5 16.1
Imports 8.5 6.5 7.0 13.6 17.8 16.7
By sector
Tradables 3.4 4.7 4.8 2.5 3.6 3.4
Agriculture, livestock, forestry & fi sheries
–1.7 4.7 7.6 3.1 6.1 4.6
Mining & quarrying 6.2 3.2 1.0 –2.1 –1.9 –0.9
Manufacturing 5.2 5.1 4.5 3.8 4.2 4.1
Excluding oil & gas 5.8 5.6 4.6 4.6 4.5 4.4
Non-tradables 9.0 8.2 8.3 10.0 9.1 9.5
Electricity, gas & water supply 8.2 10.2 11.3 11.8 12.6 11.2
Construction 8.4 7.7 8.3 9.9 7.9 8.0
Trade, hotels & restaurants 9.2 7.6 7.9 9.1 7.1 7.9
Transport –0.0 0.8 4.4 5.6 9.4 3.5
Communications 31.0 28.8 26.6 31.7 31.7 36.7
Financial, rental & business services
8.1 7.6 7.6 8.6 8.2 8.7
Other services 7.0 7.0 5.2 7.2 5.6 6.5
Source: CEIC Asia Database.
cbieDec08b.indb 337
cbieDec08b.indb 337 31/10/08 4:52:45 PM31/10/08 4:52:45 PM
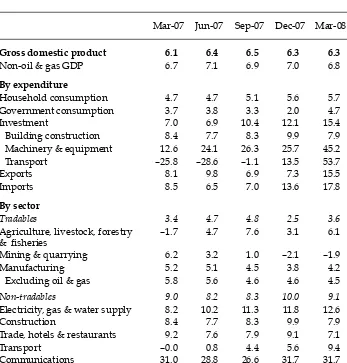
Merchandise imports are growing more strongly than exports (and have been for some time), but exports continue to grow steadily (fi gure 1). Indeed, export
demand is showing surprising resilience despite slowing growth in most devel-oped economies. Partly this is due to the fact that Indonesia is a large commod-ity exporter (around 60% of exports are commodities) and has seen a signifi cant
increase in income from exports related primarily to price effects (with supply remaining fairly steady). With the global oil price having fallen back well below $100/barrel, and other commodity prices also falling, export values may increase more slowly—if at all—over the next 12 months. The signifi cant rise of imports
is due largely to strong domestic demand coupled with higher prices. Like most of Asia (excluding Malaysia and India), Indonesia has suffered a negative terms-of-trade shock due to higher import prices since early 2007, despite record high commodity prices.
The second quarter balance of payments revealed that Indonesia had posted a current account defi cit (CAD) for the fi rst time in three years.2 The CAD was small
at around $1.4 billion, or a little over 1% of GDP, and in this case actually refl ected
the underlying strength of the economy, as growth of merchandise imports (51%) outpaced that of exports (28%). Further confi rmation of this strength can be seen
in table 1, which shows investment in largely imported machinery and equip-ment, and in transport equipequip-ment, continuing to grow strongly.
From a sectoral perspective, non-tradables remain the principal drivers, with strong results in most sectors—led in particular by communications (table 1).
2 See <http://www.bi.go.id/SDDS/series/bop/index_bop.htm>. FIGURE 1 Growth of Dollar Value of Tradea
(% p.a.)
a Growth rates are calculated as annualised change in rolling 3-month totals.
Source: CEIC Asia Database.
Jul–070 Sep–07 Nov–07 Jan–08 Mar–08 May–08 Jul–08 10
20 30 40 50 60 70
Exports Imports
cbieDec08b.indb 338
cbieDec08b.indb 338 31/10/08 4:52:45 PM31/10/08 4:52:45 PM
Agriculture, mining (including oil and gas) and manufacturing continue to under-perform, despite high global commodity prices during the fi rst half of
2008. Continuing contractual wrangling between the state oil and gas com-pany Pertamina and Exxon Mobil over the management of the Cepu site in East Java, which contains signifi cant oil reserves, constitutes a signifi cant cost to the
economy, as oil production for the country as a whole continues to decline (JP, 9/9/2008).
POLICY RESPONSES TO THE GLOBAL DOWNTURN AND VOLATILITY While Indonesia is relatively well placed in the current diffi cult external economic
environment, its vulnerability to external shocks should not be under-estimated. The global economy is facing the most challenging set of circumstances in recent memory, and a substantial slowdown in economic growth is occurring in the major advanced economies. The possibility of a crisis unrelated to domestic fun-damentals is growing as fi nancial market conditions in the US and Europe
con-tinue to deteriorate. Indonesia’s vulnerability relates to both the fi nancial (capital fl ow) and international trade channels.
Financial markets
The fi nancial sector has been volatile in 2008 as a consequence of global fi nancial
problems. It reacted negatively to the announcement in September of a small cur-rent account defi cit in the second quarter, despite the fact that the defi cit simply
refl ected strong domestic demand and that most other macroeconomic indicators
remained positive. The currency began to depreciate in August, and BI Governor Boediono was quick to issue a statement calling for calm, emphasising that ‘there [was] no issue with the underlying fundamentals’ (JP, 6/9/2008). But the episode underlined investors’ continuing risk-averse attitude towards Indonesia.
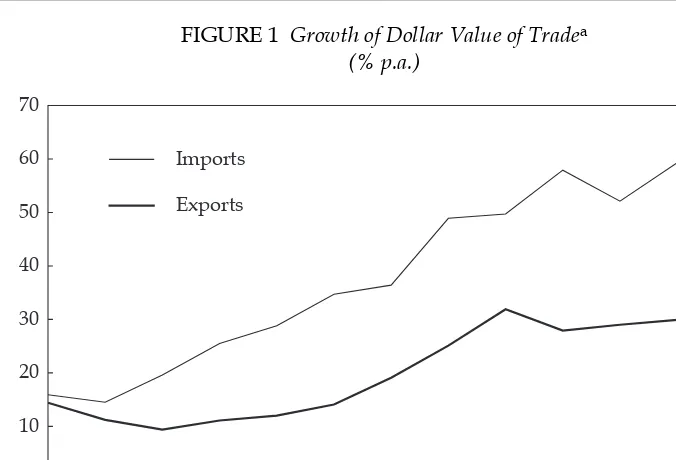
In the midst of big falls in global stock markets, on 8 October the Indonesia Stock Exchange (IDX) took the extraordinary step of suspending trade after the composite share price index fell by 10%. The index had by then fallen by a cumu-lative 40% in the previous four months (fi gure 2). While IDX trends are not
neces-sarily an accurate measure of investor confi dence—since only a relatively small
number of companies are listed on the exchange, many of them state owned—a fall of this magnitude was clearly of considerable concern to the authorities.
The government responded quickly on 9 October at a joint press conference held by the ministers of fi nance and state enterprises, the chairman of the
Capi-tal Markets and Financial Institutions Supervisory Agency (Bapepam-LK) and the governor of BI. First, they announced plans to ease existing rules on share buybacks. The rule relaxations allow listed companies to buy back 20% of their issued shares (rather than 10% as previously) without fi rst seeking shareholder
approval, and scrap the previous limit on buybacks to 25% of the shares traded on a given day. Such buybacks may be undertaken only if the IDX experiences a ‘signifi cant’ fall, or if trading is suspended, however. It was also announced
that banks would be permitted to use approaches other than mark-to-market accounting for debt securities. Mirroring measures taken in various other coun-tries, the government also announced its intention to raise the maximum size of bank deposits it would guarantee from Rp 100 million to Rp 2 billion (Ministry of
cbieDec08b.indb 339
cbieDec08b.indb 339 31/10/08 4:52:46 PM31/10/08 4:52:46 PM
Finance press release, 13/10/2008). BI further announced that it would unify the minimum reserve requirement (the percentage of total rupiah deposits that banks are required to hold as deposits at BI) at 7.5%, compared with ratios ranging from 5% to 13% previously (BI Regulation 7/29/PBI/2005) and averaging about 9.1%. In addition, it would change the rules for providing emergency support to banks facing liquidity problems, allowing them to use loans classifi ed ‘current’ (lancar)
as collateral for liquidity support where previously only government bonds or SBIs (Bank Indonesia Certifi cates) were acceptable for this purpose.
Softening bank regulations and making government and central bank support more readily available is intended to maintain liquidity and keep the banks lend-ing, but it runs the risk of the government and BI accumulating signifi cant new bad
debts. Marking security values to market can certainly be unnerving to stake holders in banks in times of fi nancial upheaval, but it is by no means obvious that
keep-ing them in the dark is the optimal policy, and it is worth recallkeep-ing that the earlier guarantee of bank deposits proved extraordinarily costly to the Indonesian people (McLeod 2006). The government is presumably aware of the risks, given this his-tory. It is reportedly working on a fi nancial system safety net law aimed at
improv-ing coordination among authorities when dealimprov-ing with fi nancial crises (Suharmoko
2008). The law will set out the roles and responsibilities of BI and the Ministry of Finance (MOF), which were unclear during the Asian fi nancial crisis of 1998.
Exchange rate
Despite the commodity boom of 2007 and early 2008 there was no nominal appreciation against the dollar during this period (in contrast with many other countries); this can probably be traced back to BI’s unoffi cial targeting of the
exchange rate. While not an explicit policy, it is obvious from the data that BI FIGURE 2 Composite Share Price Index (CSPI) and Exchange Rate
Source: Indonesia Stock Exchange (IDX); Pacifi c Exchange Rate Service.
13-Jun-2008 11-Jul-2008 8-Aug-2008 5-Sep-2008 3-Oct-2008
0 500 1,000 1,500 2,000 2,500 3,000
0 2,000 4,000 6,000 8,000 10,000 12,000
CSPI
Exchange rate
CSPI Rp/$
cbieDec08b.indb 340
cbieDec08b.indb 340 31/10/08 4:52:46 PM31/10/08 4:52:46 PM
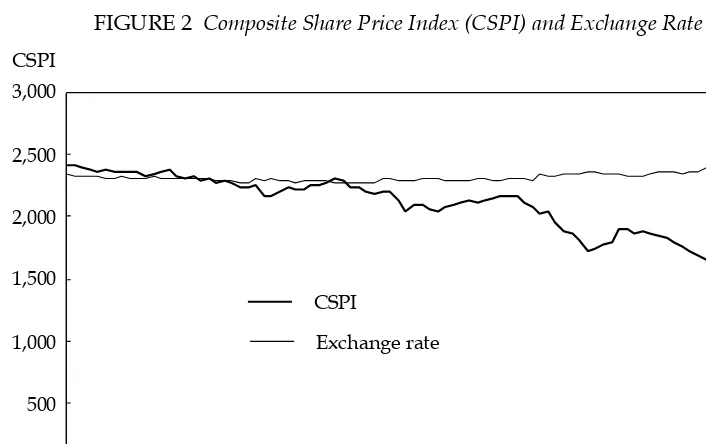
has been comfortable with the currency trading at around Rp 9,100/$, regardless of whether it was weakening relative to other regional currencies (throughout 2007) or strengthening against them (from February through September 2008) (fi gure 3). The consequence of offering such an attractive price in return for
dol-lars since early 2006 has been a considerable build-up in BI’s foreign exchange reserves through most of this period. Although these can be used in the short run to offset pressure to depreciate, the policy also means that the rupiah starts from a relatively weak position in facing such pressure as investment slows and global commodity prices fall.
By early September BI found itself switching from preventing appreciation to supporting the currency (i.e. preventing depreciation). The sudden burst of specu-lation against the rupiah was, paradoxically, in response to the announcement of essentially positive economic data relating to the current account. This was inter-preted by offshore investors as a weakening of the balance of payments—which, in the current risk-averse environment, was cause for selling the rupiah. Further speculation against the currency as the global fi nancial crisis gathered steam
throughout September and early October saw the rupiah depreciate by some 6% in the two months to early October, despite intervention in the foreign exchange mar-ket that saw BI’s international reserves fall signifi cantly, from their peak of $60.6
billion in July to $57.1 billion at the end of September. Some local market analysts such as Danamon Bank have noted that this depreciation has been fairly orderly and somewhat less than that of other regional currencies (such as the Korean won, the Thai baht and the Philippines peso) (Gunawan 2008); this presumably refl ects intervention by BI. While support for the currency is designed to maintain
confi dence, preventing depreciation in a worsening external environment partly
obstructs the important role the exchange rate can play as a shock absorber by sup-porting production of tradables (i.e. exports and import substitutes).
FIGURE 3 Selected Currency Movements against the Dollar, 2007–08 (2 Jan 2007 = 100)
Source: Pacifi c Exchange Rate Service.
2-Jan-200750 13-Apr-2007 26-Jul-2007 8-Nov-2007 22-Feb-2008 5-Jun-2008 18-Sep-2008 60
70 80 90 100 110 120 130
Indonesian rupiah Malaysian ringgit
Philippines peso Thai baht
cbieDec08b.indb 341
cbieDec08b.indb 341 31/10/08 4:52:47 PM31/10/08 4:52:47 PM
Financial volatility and crisis management
The effect on Indonesia’s fi nancial markets of the turmoil in major advanced
econ-omies was fairly limited through to September. This was largely a serendipitous result of relatively under-developed debt and money markets that mean direct exposure to collateralised debt obligations and sub-prime mortgages is low for Indonesian banks. Despite Indonesia’s positive macroeconomic outlook, how-ever, second-round effects from slowing global demand and tighter global credit conditions began to impact on the economy more forcefully in October (fi gure 2),
as global fi nancial markets became increasingly unsettled. With a relatively open
capital account—compared with countries such as Thailand and Malaysia—Indo-nesia will remain susceptible to a sudden outfl ow of capital should confi dence
dis-appear. Although this could be a consequence of factors unrelated to the domestic economy, monetary policy settings will also play a role in affecting investor per-ceptions (as discussed in more detail below).
In planning for the possibility of a fi nancial crisis, the government has been
proactive in addressing the key issue of coordination. Using the recommenda-tions of the global Financial Stability Forum (FSF),3 it has established a Forum
for Financial System Stability (Forum Stabilitas Sistem Keuangan, FSSK) to put in place a set of protocols for the authorities to follow in the case of a fi nancial
crisis. The primary objective is to address one of the main shortcomings of the current system—the lack of coordination between BI, the MOF and the Coordi-nating Ministry for Economic Affairs. The FSSK is a statutory agency separate from the other institutions, and it has taken some time to show any progress on these protocols. However, progress has accelerated in recent months, to the point where a ‘stress test’ of the system was scheduled for December 2008, involving a desktop simulation of a crisis. This would require the governor of BI, the Minister for Finance and all the relevant offi cials to respond to a regional crisis scenario.
However, by early October a genuine crisis rather than a simulated one was look-ing increaslook-ingly likely to test the skills of these offi cials.
In a very practical sense the protocols can be seen to be working already. Fol-lowing the collapse of Lehman Bros, Merrill Lynch and American International Group in the US, worries over tightening global credit conditions, and a drop of 4.5% in the composite share price index of the IDX, the government and BI announced on 15 September that they would take steps jointly to ease liquidity pressures at the macroeconomic and microeconomic level (MOF 2008). The meas-ures included accelerating government spending and the disbursement of funds to support such spending; reducing the issue of government bonds; speeding the implementation of tax facilities to stimulate investment and capital infl ow;
inject-ing liquidity to the bankinject-ing system through BI’s open market operations; and modifying the rules under which banks can obtain additional liquidity from the central bank. These measures were updated in the joint 9 October announcement by the MOF and BI, referred to above.
These are measures that are being implemented all over the world, and are there-fore not remarkable in themselves, but they demonstrate a coordinated approach
3 The FSF, based at the Bank of International Settlements, is a group of treasuries, central banks and supervisors from important fi nancial centres, as well as some international fi nancial institutions <http://www.fsforum.org>).
cbieDec08b.indb 342
cbieDec08b.indb 342 31/10/08 4:52:47 PM31/10/08 4:52:47 PM
to macroeconomic policy making and crisis management that has been absent in the past. That said, increasing liquidity in the system runs the risk of boosting infl ation, as occurred in the 1997–98 fi nancial crisis, and the early responses to
liquidity injections in the US, Europe and Australia have done little to suggest they hold the key to stabilising these economies.
Indonesia’s banking system is another area that has performed well over the last two years, and it should be relatively well placed to manage current volatility owing largely to its low loan-to-deposit ratio, the predominance of fl oating- rather
than fi xed-rate securities, its small net open foreign exchange rate position, its
strong recent profi tability, and its high capital cushion (IMF 2008b: 21). However,
the rapid expansion of lending in 2007 and into 2008—with loan growth over 30% per annum—is likely to be one of the main fi nancial sector risks, and BI will need
to ensure that its supervision remains proactive.
External exposure
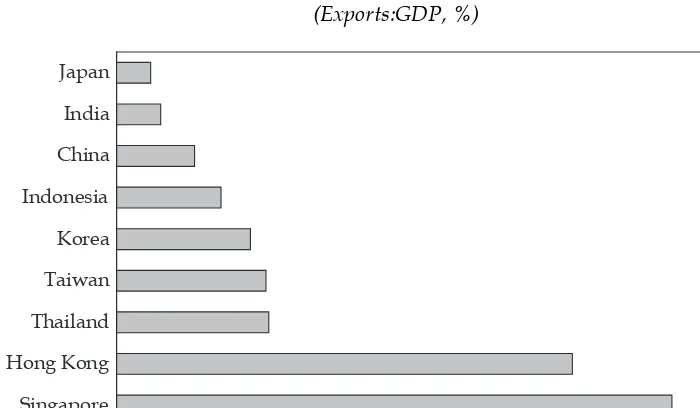
Indonesia’s second key vulnerability, trade, is broad-based, and the economy’s exposure to external demand (as measured by the ratio of exports to GDP) is not as high (at around 48%) as that of some of its neighbours (fi gure 4). This is important,
as countries with high exposure to external demand and which, for example, are tightly linked into the global manufacturing cycle (i.e. are more affected by a down-turn in developed economies) have recently announced contractions or signifi cant
slowdowns in their economies. These include the newly industrialised economies of Korea, Hong Kong, Taiwan and Singapore, plus the Philippines, and Thailand.
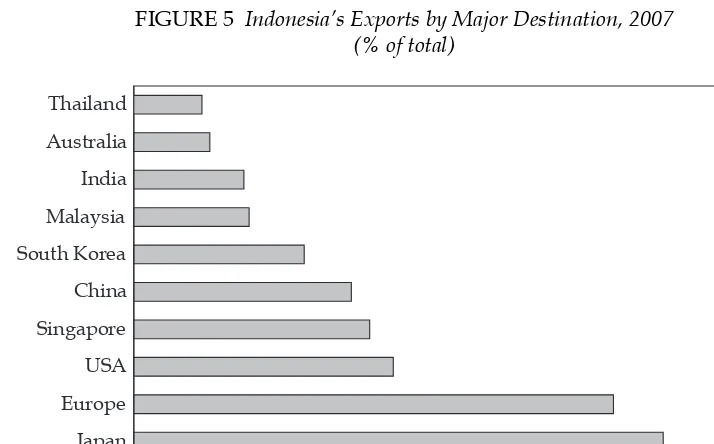
However, Indonesia’s share of exports to those developed countries that are fac-ing a downturn is relatively high (fi gure 5). Japan and some European countries
(Germany, France and Italy) have recorded negative growth in their most recently reported quarters, while growth in the US and UK continues to be restrained by Source: CEIC Asia Database.
FIGURE 4 External Exposure of Selected Asian Countries, 2007 (Exports:GDP, %)
Singapore Hong Kong Thailand Taiwan Korea Indonesia China India Japan
0 50 100 150 200 250 300
cbieDec08b.indb 343
cbieDec08b.indb 343 31/10/08 4:52:47 PM31/10/08 4:52:47 PM
sharp downturns in their housing markets and associated disruptions in fi nancial
markets. This is counter-balanced to some extent by Indonesia’s exposure to some fast-growing developing economies such as China and India.
Ironically, Indonesia’s current vulnerability has also been its recent strength: rising global commodity prices. While coal prices may remain high based on glo-bal supply side constraints and strong demand from China, lower oil prices will reduce the prices of palm oil and gas (two of Indonesia’s other major exports). Other agricultural exports are also projected to soften somewhat as prices fall— although the potential for this situation to reverse remains, since global stocks are at very low levels (Mitchell 2008). Indonesian non-commodity exports, such as manufacturing, also face contractionary pressures, because Indonesia has not been able to diversify its manufacturing output signifi cantly and thus take
advantage of the opportunities presented by China’s growth over the last dec-ade (Athukorala 2006). On balance, external demand is now quite likely to fall, putting some pressure on the currency as markets re-assess Indonesia’s ability to meet its short-term obligations.
Infl ation
Volatility in the currency market (refl ecting broader uncertainty in global
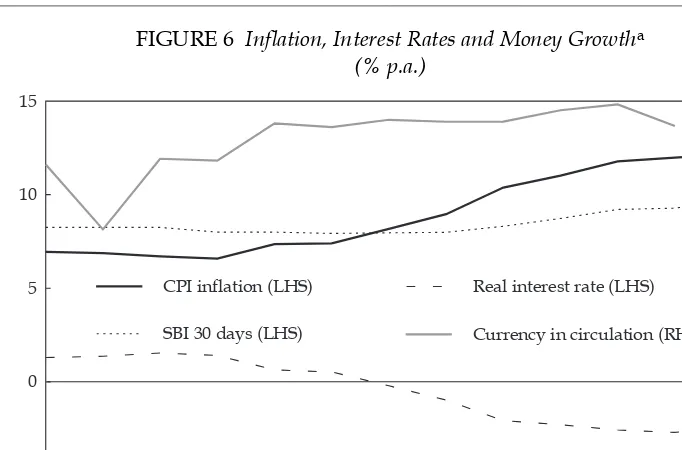
mar-kets) highlights the fact that infl ation is now also a key risk. The CPI infl ation rate
has reached 12% y-o-y (fi gure 6). Infl ation has been rising since mid-2007, while
the money supply has been expanding rapidly since late 2006 (McLeod 2008: 189). On the other hand, real interest rates (nominal interest rates adjusted for infl
a-tion) have been falling since November 2007, and are currently negative. Lending rates are signifi cantly higher than the policy rate, but the settings of monetary
policy have not been suffi ciently tight to contain prices. This is one reason many
investors remain sceptical about BI’s interest rate policy: there does not seem to FIGURE 5 Indonesia’s Exports by Major Destination, 2007
(% of total)
Source: CEIC Asia Database.
Japan Europe USA Singapore China South Korea Malaysia India Australia Thailand
0 5 10 15 20 25
cbieDec08b.indb 344
cbieDec08b.indb 344 31/10/08 4:52:48 PM31/10/08 4:52:48 PM
be suffi cient resolve to bring infl ation down to the target range (4–6%), making
speculative attacks on the currency more likely.
Bank Indonesia, the Ministry of Finance and the Coordinating Ministry for Eco-nomic Affairs4 have changed their tone in recent months, and have been talking
much more about price stability. Both BI governor Boediono and minister Sri Mul-yani have publicly emphasised infl ation as a key threat to the near-term outlook,
and underlined their intention to bring it back down to around 6.5% by the end of 2009.5 Earlier, however—ahead of the increase in the domestic fuel price in
May—BI seemed to have accepted the inevitability of infl ation rising well above
its target range (IMF 2008b: 14).In addition, the minister stated publicly that the revised budget assumption of 6.5% infl ation for 2008 was not realistic—that the
outcome would almost certainly be higher. The problem with this apparent readi-ness to accept missed targets is that the markets are left with no credible medium-term target for infl ation, almost certainly encouraging infl ationary expectations
to drift upwards.
This serves to highlight the need for conviction on the part of BI in handling domestic price pressures (OECD 2008). BI has raised rates by 25 basis points (0.25%) following each of its last six board of governors meetings, bringing the policy rate to 9.5%, but a number of senior BI fi gures have expressed the view that
even raising interest rates more signifi cantly would not bring infl ation down—yet
would have a detrimental impact on growth.
4 Both ministries are now headed by Sri Mulyani Indrawati. 5 Infl ation target ranges are set each year.
FIGURE 6 Infl ation, Interest Rates and Money Growtha
(% p.a.)
a The real interest rate is calculated as the SBI (Bank Indonesia Certifi cate) rate minus the infl ation rate.
Source: CEIC Asia Database.
Sep–07 Dec–07 Mar–08 Jun–08 Sep–08
-5 0 5 10 15
-10 0 10 20 30
CPI inflation (LHS)
SBI 30 days (LHS)
Real interest rate (LHS)
Currency in circulation (RHS)
cbieDec08b.indb 345
cbieDec08b.indb 345 31/10/08 4:52:48 PM31/10/08 4:52:48 PM
These internal doubts about the effectiveness of its monetary policy presumably explain why BI has been reluctant to raise rates more aggressively, and has instead opted for a combination of moderate rate rises and ’a more fl exible exchange rate
policy’ to combat ‘imported infl ation’ (Goeltom 2008). In other words, BI intended
to allow the exchange rate to appreciate to ease price rises for imports. However, in the context of increased uncertainty and heightened risk aversion in global markets, the strategy did not have the desired impact and, as noted, BI was in fact forced to support the currency instead.
BI maintains that infl ation will return to around 6.5% by the end of 2009, and
will be back within the 2008 target band of 4–6% in 2010, but has yet to articulate a clear strategy to show markets how it intends to achieve this medium-term target, given its obvious reluctance to increase interest rates. Indeed, evidence is emerg-ing of investors losemerg-ing confi dence in the domestic bond market. For the fi rst time
this year the fi nance ministry was unable to attract bids for all bonds on offer at
the auction on 10 September; in addition, the sustained pressure on the rupiah in the second week of October led to a depreciation to just under Rp 9,625/$. It might be argued that acting decisively now would reduce the ultimate cost in lost output, while also minimising Indonesia’s vulnerability to future adverse supply shocks (IMF 2008b: 130).
THE 2009 BUDGET
The budget formulation process involves preliminary discussions between the government and the parliament (DPR), and culminates in the production of the Draft Budget and Financial Note—an extraordinarily lengthy document that this year extends to some 456 pages. Whereas in the past the budget typically was announced less than three months before commencement of the fi scal year, as of
2002 it began to make its appearance more than four months in advance, in the context of the president’s State of the Nation address on or about Independence Day (Alisjahbana and Manning 2002: 285).
Managing the budget process in this manner has a number of drawbacks. First, key budget assumptions are seen as items for negotiation, rather than as realistic estimates of future levels of GDP growth, the price of oil and oil production, not to mention infl ation, interest rates and the exchange rate—which are in any case
the responsibility of the independent central bank, not the government. Second, the earlier the draft budget is fi nalised, the more likely it is that circumstances
will have changed signifi cantly by the time it has to be implemented, rendering it
unrealistic. Third, the more voluminous the underlying documentation, the more impractical it will be to undertake revisions at the last moment.
These problems have come to the fore in the 2009 budget as a result of two important changes of circumstances. First, the budget had been prepared on the basis of an assumed world oil price of $130 per barrel but, after peaking at over $140 in July, the price had fallen to around $115 by early August. Acknowledg-ing the high degree of uncertainty in relation to further movements in the price, the government decided that it would be more realistic to base its budget on an oil price of $100 rather than $130. Second, just days before the president’s State of the Nation address the Constitutional Court found that the 2008 budget was unconstitutional: a 2002 constitutional amendment required that 20% of
cbieDec08b.indb 346
cbieDec08b.indb 346 31/10/08 4:52:48 PM31/10/08 4:52:48 PM
the budget be devoted to education, and the 2008 budget had fallen well short of this level.6 It was decided to revise the 2009 budget so as to increase
spend-ing on education to the 20% level and to change the oil price assumption, but it was not feasible to revise the entire document accordingly within such a short time-frame.
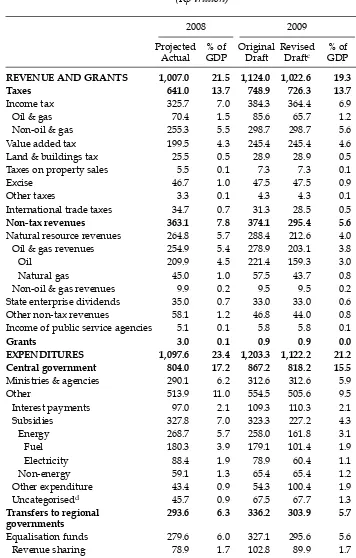
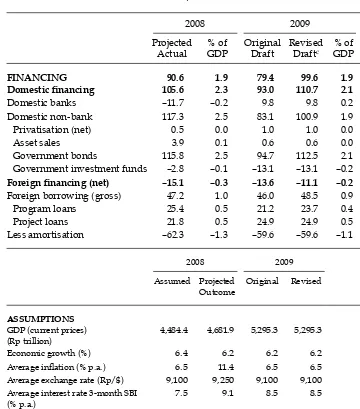
Accordingly, the approach has been to issue a supplementary budget docu-ment (‘Dokumen Tambahan Nota Keuangan dan RAPBN’) for 2009, based on the revised oil price assumption and the desire to increase spending on education signifi cantly. Table 2 shows the projected budget outcomes for 2008, together with
the 2009 revised budget amounts and ratios to GDP. The fi nal column shows the
change in each item relative to its projected 2008 outcome in terms of its ratio to GDP, to provide an idea of the likely stimulatory impact of the budget on eco-nomic growth. The column showing the original budget fi gures for 2009 is now
mainly of historical interest, but the numbers are useful for showing the estimated impact of changes in the oil price on some of the key items.
Note in particular that even large changes in the oil price have relatively little impact on the budget defi cit. A reduction from $130 to $100 reduces 2009 oil and
gas revenues by about Rp 76 trillion and income tax from the oil and gas sec-tor by Rp 20 trillion, while energy subsidies decline by almost exactly the same total amount; revenues shared with regional governments also decline by about Rp 13 trillion. The overall impact is to increase the defi cit by only about 0.2% of
GDP. The problem posed by fuel subsidies is therefore not fi scal sustainability, but
the opportunity cost of subsidising energy consumption at the expense of greater expenditure in areas such as education, health, law and order, and infrastructure. Notwithstanding the recent adjustment of domestic fuel prices, energy subsidies will still cost Rp 162 trillion ($18 billion) in 2009, equivalent to 3.1% of GDP—or 52% of the total spending by all ministries and other government agencies com-bined. Despite such considerations, and despite acknowledging that the subsidies benefi t the wealthy relatively more than the poor, the president did not take the
opportunity presented by the budget speech to argue for a further cut in fuel sub-sidies (although efforts to target the subsub-sidies more carefully were mentioned as a possibility).
Macroeconomic assumptions7
There are some noteworthy inconsistencies in the macroeconomic assump-tions underlying the budget. Perhaps most obviously, a reduction of the oil price from $130/barrel to $100 is assumed to have no impact on nominal GDP, whereas in fact this would result in a decrease of about Rp 95 trillion. This in turn would slightly affect all the ratios to GDP for 2009, raising the question whether these might more usefully be calculated as ratios to non-oil and gas
6 As, indeed, had the three previous budgets (JP, 18/8/2008).
7 On 14 October, after consultations with the parliament, the government announced a second round of modifi ed assumptions for the 2009 budget in response to the worsening global crisis. These revised assumptions appear as note ‘a’ to table 2, but were announced too late for them to be analysed in detail for this survey. The analysis in this section and the data in table 2 are based on the assumptions in the supplementary budget document (‘Dokumen Tambahan Nota Keuangan dan RAPBN’) of August 2008 (table 2, note ‘c’).
cbieDec08b.indb 347
cbieDec08b.indb 347 31/10/08 4:52:49 PM31/10/08 4:52:49 PM
TABLE 2 Projected Budget Outcome 2008 and Draft Budgets 2009a
REVENUE AND GRANTS 1,007.0 21.5 1,124.0 1,022.6 19.3 –2.2
Taxes 641.0 13.7 748.9 726.3 13.7 0.0
Income tax 325.7 7.0 384.3 364.4 6.9 –0.1
Oil & gas 70.4 1.5 85.6 65.7 1.2 –0.3
Non-oil & gas 255.3 5.5 298.7 298.7 5.6 0.1
Value added tax 199.5 4.3 245.4 245.4 4.6 0.3
Land & buildings tax 25.5 0.5 28.9 28.9 0.5 0.0
Taxes on property sales 5.5 0.1 7.3 7.3 0.1 0.0
Excise 46.7 1.0 47.5 47.5 0.9 –0.1
Other taxes 3.3 0.1 4.3 4.3 0.1 0.0
International trade taxes 34.7 0.7 31.3 28.5 0.5 –0.2
Non-tax revenues 363.1 7.8 374.1 295.4 5.6 –2.2
Natural resource revenues 264.8 5.7 288.4 212.6 4.0 –1.7
Oil & gas revenues 254.9 5.4 278.9 203.1 3.8 –1.6
Oil 209.9 4.5 221.4 159.3 3.0 –1.5
Natural gas 45.0 1.0 57.5 43.7 0.8 –0.2
Non-oil & gas revenues 9.9 0.2 9.5 9.5 0.2 0.0
State enterprise dividends 35.0 0.7 33.0 33.0 0.6 –0.1
Other non-tax revenues 58.1 1.2 46.8 44.0 0.8 –0.4
Income of public service agencies 5.1 0.1 5.8 5.8 0.1 0.0
Grants 3.0 0.1 0.9 0.9 0.0 –0.1
EXPENDITURES 1,097.6 23.4 1,203.3 1,122.2 21.2 –2.2
Central government 804.0 17.2 867.2 818.2 15.5 –1.7
Ministries & agencies 290.1 6.2 312.6 312.6 5.9 –0.3
Other 513.9 11.0 554.5 505.6 9.5 –1.5
Interest payments 97.0 2.1 109.3 110.3 2.1 0.0
Subsidies 327.8 7.0 323.3 227.2 4.3 –2.7
Energy 268.7 5.7 258.0 161.8 3.1 –2.6
Fuel 180.3 3.9 179.1 101.4 1.9 –2.0
Electricity 88.4 1.9 78.9 60.4 1.1 –0.8
Non-energy 59.1 1.3 65.4 65.4 1.2 –0.1
Other expenditure 43.4 0.9 54.3 100.4 1.9 1.0
Uncategorisedd 45.7 0.9 67.5 67.7 1.3 0.4
Transfers to regional governments
293.6 6.3 336.2 303.9 5.7 –0.6
Equalisation funds 279.6 6.0 327.1 295.6 5.6 –0.4
Revenue sharing 78.9 1.7 102.8 89.9 1.7 0.0
General funds allocation 179.5 3.8 201.9 183.4 3.5 –0.3
Special funds allocation 21.2 0.5 22.3 22.3 0.4 –0.1
Special autonomy & adjustment funds
14.0 0.3 9.1 8.3 0.2 –0.1
DEFICIT –90.6 –1.9 –79.4 –99.6 –1.9 0.0
cbieDec08b.indb 348
cbieDec08b.indb 348 31/10/08 4:52:49 PM31/10/08 4:52:49 PM
TABLE 2 (continued) Projected Budget Outcome 2008 and Draft Budgets 2009a
FINANCING 90.6 1.9 79.4 99.6 1.9 0.0
Domestic fi nancing 105.6 2.3 93.0 110.7 2.1 –0.2
Domestic banks –11.7 –0.2 9.8 9.8 0.2 0.4
Domestic non-bank 117.3 2.5 83.1 100.9 1.9 –0.6
Privatisation (net) 0.5 0.0 1.0 1.0 0.0 0.0
Asset sales 3.9 0.1 0.6 0.6 0.0 –0.1
Government bonds 115.8 2.5 94.7 112.5 2.1 –0.4
Government investment funds –2.8 –0.1 –13.1 –13.1 –0.2 –0.1 Foreign fi nancing (net) –15.1 –0.3 –13.6 –11.1 –0.2 0.1
Foreign borrowing (gross) 47.2 1.0 46.0 48.5 0.9 –0.1
Program loans 25.4 0.5 21.2 23.7 0.4 –0.1
Project loans 21.8 0.5 24.9 24.9 0.5 0.0
Less amortisation –62.3 –1.3 –59.6 –59.6 –1.1 0.2
2008 2009
Economic growth (%) 6.4 6.2 6.2 6.2
Average infl ation (% p.a.) 6.5 11.4 6.5 6.5 Average exchange rate (Rp/$) 9,100 9,250 9,100 9,100 Average interest rate 3-month SBI
(% p.a.)
7.5 9.1 8.5 8.5
Average oil price ($/barrel) 95.0 127.2 130.0 100.0 Average oil production
(million barrels/day)
0.927 0.927 0.950 0.950
a On 14 October 2008 the government again modifi ed the budget assumptions for 2009 (see footnote 7). The new assumptions are: economic growth 5.5–6.1%; average infl ation 7.0%; average exchange rate Rp 9,500/$; average interest rate 8.5%; average oil price $85/barrel. However, this table and the accom-panying analysis are based on the earlier assumptions.
b ‘Change’ refers to the change from the projected 2008 outcome to the revised draft budget for 2009. c An explanation of revisions is contained in Departemen Keuangan (Ministry of Finance), ‘Dokumen
Tambahan Nota Keuangan dan Rancangan Anggaran Pendapatan dan Belanja Negara Tahun Angga-ran 2009 [Supplementary Documents to the Financial Note and Draft Budget for 2009]’.
d Row items listed in the original document under ‘Central government: Other’ do not sum to the
total amount shown, apparently because not all items in this category are included.
Source: Departemen Keuangan (Ministry of Finance), Data Pokok APBN 2008–2009 [Basic Data for the 2008 and 2009 Budgets].
cbieDec08b.indb 349
cbieDec08b.indb 349 31/10/08 4:52:49 PM31/10/08 4:52:49 PM
GDP. The assumed rate of economic growth for next year is 6.2%—the same as the projected outcome for 2008, but well above the IMF World Economic Outlook
and Consensus Economics 2009 forecasts of 5.5% and 5.6%, respectively (IMF 2008a; Consensus Economics 2008: 12). The nominal GDP value (regardless of whether it is adjusted for the lower oil price or not), combined with assumed real growth of 6.2%, implies infl ation of over 11%, whereas the budget assumes
infl ation of 6.5%.8 The assumed interest rate is just 8.5% compared with an
Octo-ber level of around 9.5%, yet further rate increases seem necessary if infl ation
is to be brought down so far from its current level of around 12%. Even with the impact of the domestic fuel price rises falling out of the calculation in May next year, these assumptions seem unduly optimistic. They imply a steep rise in rates followed by a very quick moderation of infl ation, in order to allow BI to cut
rates back to an average of around 8.5% for the year—with almost no impact on the real rate of GDP growth. BI has in fact indicated that it will use gradual and moderate rate rises and support the exchange rate in order to address infl ation,
further calling into question the plausibility of the budget assumptions.
Composition and economic impact
For the most part the composition of the budget—as refl ected in changes in
each item as a percentage of GDP—is little different from the expected out-come for 2008. The overall size of the government sector is expected to decline by 2.2% relative to GDP. On the revenue side, this is a consequence of rela-tively slow growth of non-tax oil revenues, given slow growth in production and an oil price signifi cantly lower than the average for 2008 ($127/barrel).
On the expenditure side, the central government’s contribution to GDP is set to decline by 1.7% as a consequence of the decision in May 2008 to increase domestic fuel prices signifi cantly and thus cut expenditure on fuel subsidies.
This effect is partially offset by the last-minute huge increase in expenditure on education—rather confusingly located in the item ‘Other expenditure’ within central government expenditure’s ‘Other’ category (expenditure other than that by ministries and other government agencies)—causing this item to increase by 1.0% of GDP. Transfers to regional governments also decline by an amount equivalent to 0.6% of GDP. This appears to be explained mainly by a decision the government made some time after formulating the original draft budget to change the basis for calculation of the general funds allocation, the total amount of which declines by about Rp 18.5 trillion in the revised version (Dokumen Tambahan Nota Keuangan dan RAPBN 2008: 12).
The budget defi cit is estimated as 1.9% of GDP, the same as the likely outcome
for 2008. The government asserts its intention to provide a fi scal stimulus to
eco-nomic growth, pointing out that the 2009 defi cit will be larger than defi cits in the
period 2004–07. Whether the budget imparts a stimulatory impact to the economy does not depend on whether it provides for a defi cit, however: it is changes in
levels of expenditure and revenue relative to GDP that matter. The budget in fact seems likely to be slightly contractionary rather than expansionary, because of the
8 The fi rst of these fi gures is based on the implicit GDP defl ator, while the second is based on CPI infl ation.
cbieDec08b.indb 350
cbieDec08b.indb 350 31/10/08 4:52:50 PM31/10/08 4:52:50 PM
reduction in government sector expenditure in combination with no change in the collection of tax revenues (both items measured relative to GDP).9
Fuel subsidies versus more spending on education
The fact that it would be possible roughly to double expenditure on education with-out any blow-with-out in the budget defi cit illustrates concretely the opportunity cost
of continuing to subsidise energy consumption. Given that the reduction in energy subsidies made possible by the May fuel price adjustments yields savings that are more than twice the additional spending on education, a signifi cant amount of ‘fi
s-cal space’ remains that could be used to fund even higher transfers to the poor (in cash or in kind), and to increase spending on sorely needed infrastructure.
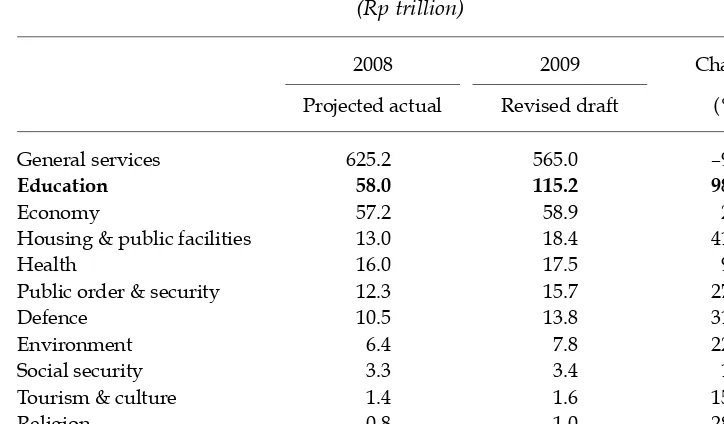
With the prospect of an additional Rp 57 trillion ($6 billion) per year for educa-tion (table 3), Bappenas (the Naeduca-tional Planning Agency) has set about designing a new fi ve-year plan for that sector. The Ministry of Education has not signed up
to the Bappenas process, however, and is understood to be working on its own plan for allocating the additional funds. The other major player, the Ministry of Finance, has very properly voiced its concern about the wisdom of attempting roughly to double the amount spent on education in a single year. It would pre-fer to see education funding raised gradually, as it has been over successive SBY budgets. All of this serves to highlight the lack of coordination in government policy making.
9 The decline in non-tax revenues relative to GDP would not have an expansionary impact because the decreases do not benefi t the domestic private sector: the main items here are decreases in the government’s oil and gas revenues, its dividends from the SOEs, and other non-tax revenues.
TABLE 3 Central Government Spending by Function, 2008–09 (Rp trillion)
2008 2009 Change
Projected actual Revised draft (%)
General services 625.2 565.0 –9.6
Education 58.0 115.2 98.7
Economy 57.2 58.9 2.9
Housing & public facilities 13.0 18.4 41.9
Health 16.0 17.5 9.3
Public order & security 12.3 15.7 27.3
Defence 10.5 13.8 31.3
Environment 6.4 7.8 22.6
Social security 3.3 3.4 1.6
Tourism & culture 1.4 1.6 15.7
Religion 0.8 1.0 28.3
Total 804.0 818.2 1.8
Source: As for table 2.
cbieDec08b.indb 351
cbieDec08b.indb 351 31/10/08 4:52:50 PM31/10/08 4:52:50 PM
Statement of Fiscal Risks
At the request of the Minister for Finance, a joint IMF–World Bank team visited Jakarta in late 2006 and early 2007 to draft a Statement of Fiscal Risks (SOFR). The IMF‘s original recommendation was that the government construct a state-ment covering budget sensitivity to macroeconomic risks, public debt man-agement, civil service pensions, central government contingent expenditures, state-owned enterprises (SOEs), public–private partnerships and sub-national governments. A SOFR was fi rst introduced as a section of the 2008 budget, to
allow readers to assess the overall risks to the government’s fi nancial position.
The 2009 budget again contains such a statement, which discusses the sensitiv-ity of budget outcomes to shocks and divergences of the underlying parameters from their assumed values, and examines the risks associated with large projects (such as the planned 10,000 megawatt expansion of electricity generation capac-ity) and SOEs.
The fi rst SOFR focused primarily on macroeconomic sensitivity analysis, debt
management, and selected SOEs and projects for which the MOF had reasonably accurate data. In principle this was a very positive step toward improved trans-parency. However, when assumptions are compared with outcomes it is clear that there is a long way to go in making the SOFR an effective tool for quantify-ing the risks in the budget. The topical issue at the time of the 2008 budget, as now, was the volatile global oil price and its potential impact on the budget and the economy. The 2008 SOFR proved relatively ineffective at portraying the sen-sitivity of the budget estimates to changes in the price and production assump-tions for oil. When the oil price sky-rocketed, it turned out that the impact on the total amount of energy subsidies had been signifi cantly under-estimated.10
The SOFR sensitivity analysis had suggested that the impact of a higher than assumed oil price (at least for prices below $100/barrel) would be to decrease the budget defi cit rather than increase it, as was the case in the fi rst half of
2008, because additional revenue from crude oil exports was expected to exceed increased spending on energy subsidies and increased oil-related transfers to regional governments.
The SOFR for 2009 still does not address risk comprehensively. It provides considerable information about the sensitivity of the budget to shocks, including interest rate changes and increases in the obligations of SOEs—especially those with particularly expensive public service obligations (PSOs)—but it does not explain how, precisely, these arrangements represent a risk to the budget or what the government intends to do to reduce or respond to those risks.
The MOF has been reluctant to make signifi cant changes to the SOFR it
intro-duced last year, which was generally well received. Capacity within the ministry to model shocks remains limited and, while the fi rst SOFR was viewed by most
as a work in progress, the ministry has settled for a simple update of the num-bers together with some minor cosmetic changes.11 Thus although the new SOFR
10 In the revised 2008 budget the estimated cost of fuel subsidies was increased from Rp 46 trillion to Rp 127 trillion, but the projected outcome is Rp 180 trillion.
11 Again at the request of the fi nance minister, the IMF sent a follow-up team to Jakarta in early 2008 to assist the MOF in analysing data from SOEs. The assistance comprised spreadsheet-based modelling tools, but little training was provided.
cbieDec08b.indb 352
cbieDec08b.indb 352 31/10/08 4:52:50 PM31/10/08 4:52:50 PM
again contains very useful information, much of it merely duplicates other parts of the budget (the section on debt, for example) or other publicly available sources (as with much of the data on SOEs).
TAX
Tax revenue continues to grow very strongly, with recent data showing very large year-on-year increases for the fourth year in a row. Collections for the year to May 2008 far surpassed expectations, with 48% growth in realised tax revenue (JP, 9/6/2008), compared to an already high annual growth average of around 18% over the last fi ve years. The dramatic increase in tax revenue is a consequence of
continuing strong economic growth and arguably a better performing Directorate General of Taxation (DGT).
Improved performance of the DGT has been achieved through a reform agenda encompassing what it describes as ‘modernisation’, ‘extensifi cation’ and
‘inten-sifi cation’.12 The modernisation or administrative reform began with the
intro-duction of large taxpayer offi ces in around 2004 (McLeod 2008: 197); a program
of opening modernised medium and small taxpayer offi ces is due for
comple-tion by the end of 2008. This has been supported by reorganisacomple-tion of the DGT head offi ce, signifi cant changes to governance (internal and external to DGT),
and strong leadership of the DGT executive in coordinating with the increasing number of donors providing technical assistance.
Extensifi cation—the effort to broaden the tax base by increasing the number of
taxpayers—should help to ensure that the strong revenue growth achieved so far continues (albeit at slower rates as the pool of non-taxpayers diminishes). Inten-sifi cation—the mapping, profi ling and benchmarking of the largest tax payers
with a view to extracting larger payments from them—has ensured that many companies can no longer hide behind false fi nancial accounts to evade their tax
obligations. In the future, continued growth in their businesses will result in cor-responding increases in tax payments. This is particularly pertinent to booming sectors such as crude palm oil.
Importantly, the increased fl ow of tax revenue to date has been broad-based,
and seems to be accompanied by increased confi dence in the tax system on the part
of businesses. If there is a cloud on the horizon in this overwhelmingly positive story, it relates to the 2009 elections, since the huge advances made in reforming the tax administration have without doubt refl ected the strength of current
lead-ership at all levels of the central government. Continuity in the reform process up to and beyond the presidential election is particularly important for a number of initiatives that are still in their early stages.13 Similarly, the considerable progress
hitherto in gaining the trust of taxpayers could be quickly dissipated if a new gov-ernment were less resolute in its attitude to reform of the tax system.
12 The term ‘modernisation’ was adopted to capture the process of reforming each tax offi ce to include new, integrated business processes and a commitment to giving up corrupt practices. Staff received large additional allowances as an incentive to sign up to a new code of conduct.
13 For example, the World Bank’s $150 million Project for Indonesian Tax Administration Reform (PINTAR) to modernise the systems and processes of DGT.
cbieDec08b.indb 353
cbieDec08b.indb 353 31/10/08 4:52:51 PM31/10/08 4:52:51 PM
Major tax reforms are at various stages of implementation (box 1). Busi-ness groups have been active in lobbying the government for measures that go beyond administrative reforms to address the issue of Indonesia’s international tax competitiveness.14 Meanwhile, the proposed reductions in tax rates may
have a positive impact on overall tax collection. The prevalence of non-fi ling of
tax returns and under-stating of income by taxpayers means that lowering tax rates (while at the same time trying harder to put an end to informal ‘facilita-tion payments’) will encourage more fi rms and individuals to pay, or pay more,
14 It is widely held that Kadin (the Indonesian Chamber of Commerce and Industry) played a central role in persuading the DPR to pass the 2007 Tax Administration Law, and that it has been pushing for both the income and VAT bills to be passed in 2008.
BOX 1 TAX LAW AMENDMENTS
1 Law 28/2007 on General Provisions and Administration of Taxationa provides for:
extensions of time for fi ling small taxpayer and corporate income tax returns; a sunset policy, providing an opportunity to revise earlier tax returns without penalty until the end of 2008; a shortening of the statutory limitation for assessment from 10 to 5 years; improved dispute settlement arrangements, with taxpayers no longer obliged to pay the disputed amount up front; regulation of audit procedures; and measures to ensure the integrity of tax offi cials, such as channels for reporting misconduct, and the establish-ment of a tax supervisor commission.
2 The Law on Income Tax (enacted in early September 2008, but not yet signed by the president) encompasses reductions in tax rates while seeking to encourage entry into the tax system, thus increasing tax revenue over time. More specifi cally, the law provides for reductions in taxes for individuals: those earning Rp 25–50 million will be subject to a tax rate of 5% (previously 10%), while the maximum rate will be lowered from 35% to 33% in 2009 and 30% in 2010, and dividend payments will be taxed at 15% (compared with up to 35% previously). For businesses, the corporate income tax will be lowered from 30% to 28% in 2009, and to 25% in 2010. The law also assists certain activities, such as education and research and development (such that non-profi t organisations in these fi elds will not be subject to income tax), charities (which will not be taxable), and small enterprises (which will now be able to reduce their tax liability by claiming new deduc-tions). It also allows tax deductions for contributions to scholarships, natural disaster relief, social infrastructure, research and development, and education.
3 A draft Law on Value Added Tax (VAT) has been presented to parliament, but is yet to be debated. The draft law provides that: mergers, exports of services and intangible goods, syariah-compliant fi nancial products and agriculture will not be subject to VAT; tourists can receive VAT refunds; VAT can be exempted for certain electricity and water supply customers; and services provided by secondary mortgage companies and special purpose vehicles for securitised assets will not be subject to VAT. The latter amendment is designed to assist with the development of secondary capital markets, where trans-actions often incur VAT on both the sale and purchase, and offsets cannot be claimed, making them relatively expensive.
a Undang-Undang Nomor 28 Tahun 2007 tentang Perubahan Ketiga atas Undang- Undang Nomor
6 Tahun 1983 tentang Ketentuan Umum dan Tata Cara Perpajakan [Law 28/2007 on the Third Amendment to Law 6/1983 on General Provisions and Administration of Taxation].
cbieDec08b.indb 354
cbieDec08b.indb 354 31/10/08 4:52:51 PM31/10/08 4:52:51 PM
tax15—especially if the audit function can be refi ned to better target entities that
should be paying more tax. This approach is already paying dividends: anecdo-tal evidence from DGT suggests that a number of large taxpayers that fi led for
the fi rst time in 2006 or 2007 are likely to remit as much as six times more tax in
2008.
ELECTRICITY SHORTAGES16
The diffi culties for the government in matching growing demand for electricity
with a secure supply are well documented (Narjoko and Jotzo 2007: 161–4). In recent months the problem has been highlighted by the government’s announce-ment that over the second half of 2008 Jakarta would experience scheduled black-outs, staggered in different parts of the city and lasting 3–5 hours. The rationale for these ‘brown-outs’ was that they result from the need to undertake signifi cant
maintenance on existing plants. The government promised that emergency serv-ices would not be affected but, in an almost comical twist, acknowledged that the power outages would affect traffi c lights, so that some traffi c disruption could be
expected. It has also taken steps to force factories and businesses to re-program some of their operations to weekends to reduce peak load demand. The more plausible reason for the scheduled brown-outs is simply that the state electric-ity company, PLN, has failed to ensure an expansion of capacelectric-ity in line with the increasing demand for electricity, so few accept the government’s explanation. Voter inconvenience due to continuing brown-outs seems likely to become a sig-nifi cant issue in the run-up to the 2009 elections.
The root cause of the problem is the PSO under which the government requires PLN to provide electricity at fi xed rates to its customers, passing on any cost in
excess of revenue generated to the government. Introduced in 2003, this policy saw the annual subsidy cost increase more than three-fold, from Rp 3.3 trillion to Rp 12.5 trillion. The basic tariffs charged to users have not changed since 2003, while costs—high to begin with because of excessive dependence on oil (including at plants optimally designed to run on gas)—have been rising sharply owing to ris-ing oil prices. Pendris-ing completion of new plants and new gas supplies comris-ing on stream, high demand—driven by strong economic growth and boosted by increas-ingly large subsidies—must be met from high-cost plants. Thus the more PLN’s customer base grows, the bigger its losses become.
An assessment in 2006 of the cost of the PSO arrangement found that Java and Bali accounted for 80% of energy sales and 61% of the total subsidy amount. The average subsidy was Rp 310 per kilowatt hour (kWh), given average revenue of Rp 622/kWh and an average supply cost of Rp 932/kWh. This means the subsidy is equivalent to one-third of the total supply cost. The variable cost of electric-ity generated by a plant run on diesel fuel can be up to 12 times that for plants
15 Revenue responses to a tax rate change depend upon the tax system in place, the period being considered, the extent of informal sector economic activities, the existing level of tax rates, the prevalence of legal and accounting-driven tax loopholes, and the ability to substitute productive factors in response to changes in tax arrangements (Laffer 2004). 16 Figures quoted in this section are drawn from internal working documents supplied to the authors by the MOF.
cbieDec08b.indb 355
cbieDec08b.indb 355 31/10/08 4:52:51 PM31/10/08 4:52:51 PM
relying on alternative sources such as gas or coal, both of which Indonesia has in abundance (table 4). Despite this, oil-based fuels such as high-speed distillate (HSD) and marine fuel oil (MFO) are now estimated to account for around half of all electricity generation.
In May 2006 the government announced its intention to address the supply issue by securing investment in an additional 10,000 megawatts of generation capacity. However, progress has been slow, with only half the proposed projects so far even funded, let alone completed. The plan is for most of the new supply to come from coal-fi red power stations. However, according to a senior offi cial from
the Ministry of Mining and Energy speaking to an industry function in Jakarta in July 2008, the coal supplies are yet to be fully identifi ed, and in the short run they
might have to be diverted from exports. If this were to occur it is not clear whether PLN would pay market prices for this coal, and whether it would be permitted to increase tariffs to bring them into line with costs.
PLN has begun to take measures to reduce the overall cost of the electricity sub-sidies, working within the existing tariff framework. During 2008 it began to re-classify power users in various parts of Jakarta to ensure that what it deems to be wealthier households will not be able to access the more heavily subsidised power supplies. This is no more than a second-best measure until PLN can persuade the government to allow it to change the tariff structure, but for now residential electric-ity bills in wealthy suburbs such as Kuningan and Menteng have more than dou-bled since March—at the same time that black-outs have become more frequent.
POVERTY
The president’s budget speech highlighted the fact that poverty remains a big issue in the context of the parliamentary and presidential elections scheduled for 2009. Despite SBY’s rather extravagant promise to reduce poverty from around
TABLE 4 Indicative Variable Costs for Various Plant Types, Java, 2007
Plant Type Fuel Type Variable Cost
Rp/kWha Cents/kWha
Thermal Coal 185 2.03
Gas turbine (combined cycle) Gas 225 2.47
Gas turbine (open cycle) Gas 290 3.19
Geothermal Geothermal 520 5.71
Thermal MFOa 1,115 12.25
Gas turbine (combined cycle) HSDb 1,430 15.71
Gas turbine (open cycle) HSDb 2,420 26.60
a kWh = kilowatt hours.
b MFO = marine fuel oil.
c HSD = high-speed distillate (diesel fuel).
Source: Ministry of Finance and authors’ calculations using an assumed exchange rate of Rp 9,100/$.
cbieDec08b.indb 356
cbieDec08b.indb 356 31/10/08 4:52:52 PM31/10/08 4:52:52 PM
16% to 8% by 2009, poverty actually rose to 17.7% in 2006. And in 2007 nearly half of Indonesia’s population was either poor or highly vulnerable to falling into poverty, by virtue of having per capita consumption levels less than one-third above the national poverty line.17 Poverty has fallen only slightly subsequently,
to 15.4% (as of March 2008), despite sustained GDP growth of more than 6% per annum over the last two years; accordingly, the government has had to revise its 2009 poverty target signifi cantly, to between 12% and 14% (fi gure 7). The failure
to reduce poverty more signifi cantly is partly explained by the impact of higher
energy and food prices, but the data also refl ect the lack of meaningful structural
reforms in important areas like labour markets, where such reforms would result in an expansion of employment opportunities for low-skilled (poorer) workers.
Rather than undertaking structural reforms, the government’s primary approach to alleviating poverty has been to introduce a large number of both nationally and locally targeted schemes to assist the poor directly. The 2009 budget addresses the issue by outlining a ‘three-cluster strategy’ (SBY 2008). The
fi rst cluster, described as ‘giving fi sh to the poor’, involves the government
con-tinuing to provide direct assistance, including through the Raskin (Rice for the Poor) program and through unconditional cash transfers intended to compen-sate the poor for the May 2008 fuel price hike (McLeod 2008: 194). A long-term
17 Several regions, especially in Eastern Indonesia, are well behind the all-Indonesia average (Hill, Resosudarmo and Vidyattama 2008, in this issue). Indonesia is doing particularly poorly in relation to a number of health indicators and, as a result, may fail to reach several of its Millennium Development Goal targets (World Bank 2008).
FIGURE 7 Poverty Incidence (% of population below poverty line)
Source: BPS (Central Statistics Agency) (2008) Perkembangan Beberapa Indikator Utama Sosial-Ekonomi Indonesia [Trends of Selected Socio-Economic Indicators for Indonesia], March, accessed 10 October 2008 at <http://www.bps.go.id/leafl et/Booklet_Maret2008(new).pdf>. The poverty level for March 2008 is from Nota Keuangan APBN 2009, p. II-25; target range for 2009 is 12–14%, p. II-46.
19950 1997 1999 2001 2003 2005 2007 2009 5
10 15 20 25 30
SBY presidency begins Target range 12–14%
cbieDec08b.indb 357
cbieDec08b.indb 357 31/10/08 4:52:52 PM31/10/08 4:52:52 PM