Full Terms & Conditions of access and use can be found at
http://www.tandfonline.com/action/journalInformation?journalCode=cbie20
Download by: [Universitas Maritim Raja Ali Haji] Date: 18 January 2016, At: 00:25
Bulletin of Indonesian Economic Studies
ISSN: 0007-4918 (Print) 1472-7234 (Online) Journal homepage: http://www.tandfonline.com/loi/cbie20
Economic growth and poverty reduction in
Indonesia before and after the asian financial
crisis
Asep Suryahadi , Gracia Hadiwidjaja & Sudarno Sumarto
To cite this article: Asep Suryahadi , Gracia Hadiwidjaja & Sudarno Sumarto (2012) Economic growth and poverty reduction in Indonesia before and after the asian financial crisis, Bulletin of Indonesian Economic Studies, 48:2, 209-227, DOI: 10.1080/00074918.2012.694155
To link to this article: http://dx.doi.org/10.1080/00074918.2012.694155
Published online: 27 Jul 2012.
Submit your article to this journal
Article views: 1124
View related articles
ISSN 0007-4918 print/ISSN 1472-7234 online//12/020209-19 © 2012 Indonesia Project ANU http://dx.doi.org/10.1080/00074918.2012.694155
ECONOMIC GROWTH AND POVERTY REDUCTION
IN INDONESIA BEFORE AND AFTER
THE ASIAN FINANCIAL CRISIS
Asep Suryahadi, Gracia Hadiwidjaja and Sudarno Sumarto*
SMERU Research Institute, Jakarta
This paper assesses the relationship between poverty reduction and economic growth in Indonesia before and after the Asian inancial crisis. The annual rate of poverty reduction slowed signiicantly in the post-crisis period. However, the trend in the growth elasticity of poverty indicates that the power of each percentage point of economic growth to reduce poverty did not change much between the two periods. In both, service sector growth made the largest contribution to poverty reduction in both rural and urban areas. Industrial sector growth largely became irrelevant for poverty reduction in the post-crisis period even though the sector contributed the second-largest share of GDP. Agricultural sector growth, mean-while, remained important, but in rural areas only. The indings suggest the need to formulate an effective strategy to promote sectoral growth in order to speed up the pace of poverty reduction.
Keywords: economic growth, poverty reduction, structural change
INTRODUCTION
In the late 1990s, the Asian economy was hit by one of the worst inancial crises in modern history. The Asian inancial crisis of 1997–98 had long-lasting effects in a number of Asian countries. In Indonesia, the crisis began in mid-1997 with a sharp depreciation of the rupiah, which lost 85% of its value over the next year. In 1998 the economy contracted by 13.7% and the inlation rate rose to 78%, driven in particular by escalating food prices, which rose by 118%. The crisis quickly spread into the political sphere, igniting protests and mass riots against the incumbent New Order regime in Jakarta and several other cities. The economic and political chaos culminated in the resignation of President Soeharto in May 1998.
One of the most devastating consequences of the crisis for Indonesia was an abrupt escalation in the poverty rate from 17.3% in 1996 to 23.4% in 1999 (see igure 4).1 This marked a reversal in the poverty rate, which had been declining
* The authors would like to thank two anonymous referees for useful comments and sug -gestions, and Novita Maizir for assistance in preparing the igures.
1 In this paper, poverty is deined as monetary poverty and is measured using the current consumption deicit approach. The poor are those whose per capita household consump -tion expenditure is below the poverty line.
210 Asep Suryahadi, Gracia Hadiwidjaja and Sudarno Sumarto
continuously since oficial measurement began in 1976. Even though the economy recovered relatively quickly from the crisis, and poverty again began to decline, the rates of reduction did not return to those seen in the pre-crisis period when Indonesia experienced one of the most rapid reductions of poverty in the world.
One hypothesis that has been put forward to explain the slower pace of poverty reduction in the post-crisis period is that Indonesia has experienced a decline in its growth elasticity of poverty – that is, a decline in the reduction in the poverty rate associated with a percentage point of economic growth. It has been argued that the main drivers of growth in the post-crisis period have been capital-intensive sectors such as mining and telecommunications, which employ fewer people than other sectors, hence depriving the poor of opportunities to beneit from a rising economy.
This paper aims to assess the empirical evidence for the hypothesis that Indo-nesia has experienced a declining growth elasticity of poverty in the post-crisis period. The analysis is based on a growth–poverty framework and focuses on how both rates of sectoral growth and the sectoral composition of the economy have affected poverty rates.
The remainder of the paper is structured as follows. The second section dis-cusses the sectoral structure of the Indonesian economy. The third examines poverty trends and the proile of poverty. The fourth evaluates the relationship between economic growth and poverty reduction, and the ifth offers some policy implications from the indings of the study.
THE SECTORAL STRUCTURE OF THE INDONESIAN ECONOMY
The sectoral structure of an economy can be assessed from the composition of output or employment. In this paper, the term ‘sector’ refers to the three larg-est aggregations of economic activity: agriculture, industry and services.2 Over
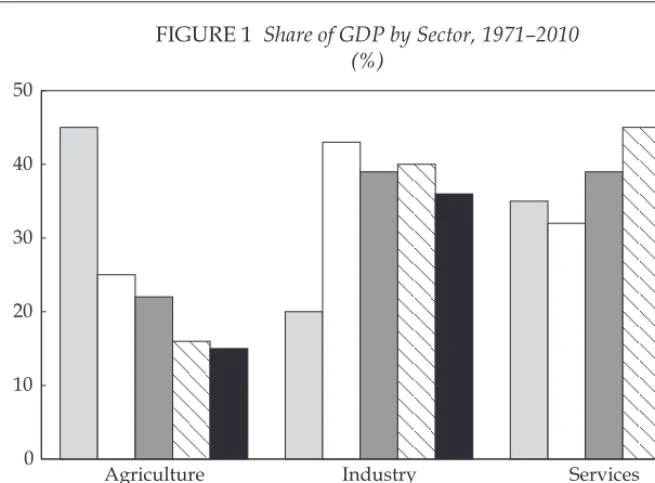
the last decade, Indonesia’s agricultural sector has continued to absorb a signii-cant share of labour but has contributed less to GDP than the other two sectors, while the manufacturing sector has had the smallest share of employment but the second-largest share of GDP. Driven by the rapid growth of the banking and hospitality industries as well as a burgeoning informal sector, the services sector now contributes the largest share of both GDP and employment.
Output
Figure 1 shows the transformation that has taken place in the Indonesian econ-omy as the relative shares of the three sectors in GDP have changed. The share of agriculture in output has declined continuously since the late 1960s. It fell from 46% in 1971 to 25% in 1980, a decline of 21 percentage points in just nine years, then continued to decline to 22% in 1990 and 16% in 2000, before stabilising at 15% in 2010.
2 The agricultural sector comprises food crops, estate crops, animal husbandry, forestry and isheries. The industrial sector consists of mining and quarrying, and manufacturing. The services sector comprises electricity, gas and water supply; construction; trade, hotels and restaurants; transport and communications; inance, real estate and business services; and other services.
During the early phase of development, a clear trend of industrialisation could be observed in the Indonesian economy. Between 1971 and 1980, the share of industrial output more than doubled from 20% to 43%. By 1990, however, the share had fallen back to 39%. It stabilised at 40% in 2000 but then declined once again to reach 36% in 2010. The deterioration over the last decade can be attributed to an unfavourable business climate for labour-intensive manufacturing industries, in which new labour market regulations introduced after the Asian inancial crisis created higher labour costs (Manning 2003; Bird and Manning 2008).
The services sector is clearly the leading contributor to GDP. After initially declining from 35% in 1971 to 32% in 1980, the sector’s share of output increased steadily to reach 39% in 1990, 45% in 2000 and 49% in 2010. This means that around half of Indonesia’s total output is now produced by the services sector.3
Employment
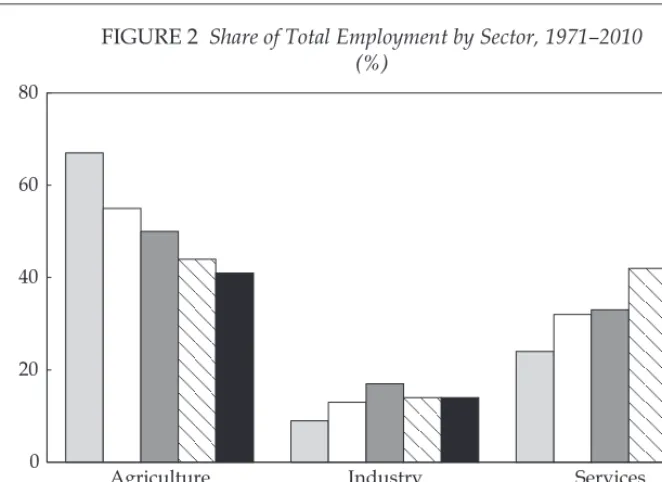
Figure 2 shows structural changes in the Indonesian economy through the prism of employment. The sectoral employment trends more or less mimic the trends in output share described above. Relecting the decline in its share of GDP, the share of the agricultural sector in employment fell continuously from 67% in 1971 to 41% in 2010. The pace of reduction in employment share, however, was much slower than the pace of reduction in GDP share. As a result, labour productivity in
3 In absolute terms, both industrial and service sector output grew in the post-crisis pe -riod. But because service sector output grew much faster than industrial sector output, the share of industry in total GDP stagnated while the share of the services sector increased. The same was true of employment, discussed in the next sub-section.
Source: BPS, Statistik Indonesia, various years.
FIGURE 1 Share of GDP by Sector, 1971–2010 (%)
Agriculture Industry Services 0
10 20 30 40 50
1971 1980 1990 2000 2010
212 Asep Suryahadi, Gracia Hadiwidjaja and Sudarno Sumarto
agriculture, relative to that in the rest of the economy, also fell sharply, from 0.67 in 1971 to 0.37 in 2010.
The industrial sector expanded its share in employment from 9% in 1971 to 13% in 1980, as would be expected given its increase in GDP share. The sector’s employment share then continued to rise to 17% in 1990 despite a decline in GDP share, relecting the change in Indonesia’s industrial development strategy in the mid-1980s from capital-intensive import substitution to labour-intensive export orientation. With the sector hit hard by the Asian inancial crisis of 1997–98, indus-try’s share of employment declined to 14% in 2000 and remained at this level in 2010.
The share of the services sector in total employment has increased continuously since 1971. Despite a decline in GDP share, it rose sharply during the country’s early development phase, from 24% in 1971 to 32% in 1980. Even after a decade of rapid expansion of manufacturing employment, the share of the services sec-tor managed to remain stable at 33% in 1990. After the Asian inancial crisis the sector’s share again expanded rapidly, reaching 42% in 2000. It then continued to grow, but more slowly, to reach 45% in 2010.
Economic growth
The importance of a sector in an economy is related not only to its GDP and employment shares, but also to its role in driving economic growth. Many studies have emphasised the importance of economic growth in driving poverty reduc-tion (see, for example, Dollar and Kraay 2002). In Indonesia, the rapid rates of poverty reduction observed during the pre-crisis period are commonly attributed to the strong economic growth at that time (Timmer 2004; Suryahadi et al. 2011). Source: BPS, Statistik Indonesia, various years.
FIGURE 2 Share of Total Employment by Sector, 1971–2010 (%)
Agriculture Industry Services 0
20 40 60 80
1971 1980 1990 2000 2010
In 1967 Indonesia was one of the poorest countries in the world, with a per cap-ita income of just $50 (Agrawal 1996). But under a succession of ive-year plans initiated in 1969, it was to become one of the world’s fastest-growing economies over the ensuing decades. Hill (1996) has estimated that real GDP per capita in constant 1991 dollars rose from $190 in 1965 to $610 in 1991, constituting annual growth of 4.6%. In the late 1990s, however, the Asian inancial crisis brought this stunning growth to a halt.
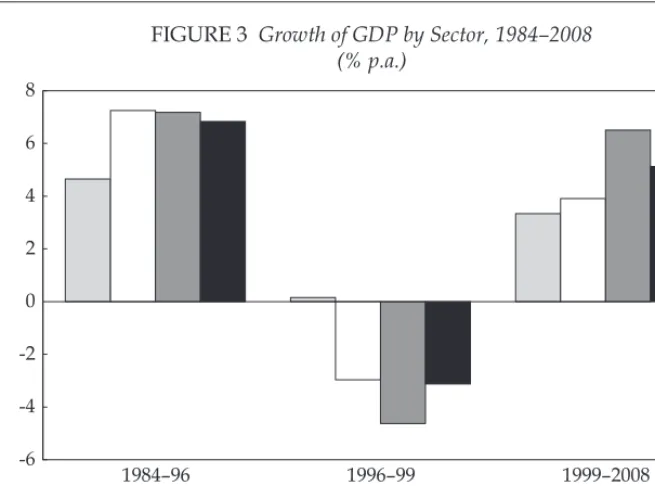
Figure 3 shows total as well as sectoral economic growth during three periods: before the crisis (1984–96), during the crisis (1996–99) and after the crisis (1999– 2008). In the pre-crisis period, the economy grew on average by 6.8% per annum, driven mainly by growth in the industrial and service sectors, which expanded by 7.3% and 7.2% per annum respectively. The agricultural sector also grew at the slower but nevertheless respectable rate of 4.7% per annum.
During the crisis, agriculture was the only sector not to suffer a contraction. It managed to record low but positive growth of 0.2% per annum between 1996 and 1999, compared with a contraction of 3.0% for the industrial sector and an even larger contraction of 4.6% for services. The whole economy suffered an average contraction of 3.1% annually during this period.
In the post-crisis period, the economy rebounded to record average annual growth of 5.1%. Much of this was driven by the services sector, which grew by 6.5% per annum. The industrial sector lost its position as a driver of economic growth during this period, growing by only 3.9% annually, or just above the rate for agriculture of 3.3%.
1984–96 1996–99 1999–2008
-6 -4 -2 0 2 4 6 8
Agriculture Industry Services Total
Source: Authors’ calculations based on the constant value of output in BPS, Statistik Indonesia, various years.
FIGURE 3 Growth of GDP by Sector, 1984–2008 (% p.a.)
214 Asep Suryahadi, Gracia Hadiwidjaja and Sudarno Sumarto
POVERTY TRENDS AND PROFILE
The rapid economic growth that occurred before the Asian inancial crisis resulted in a steep reduction in poverty, and similar improvements in other welfare indi-cators such as the infant mortality rate, the school enrolment rate and life expec-tancy at birth. The crisis that engulfed Indonesia in 1997 and 1998 reversed these improvements, as was apparent in particular in the large increase in poverty recorded in 1999. After the crisis, the poverty rate resumed its downward trend, but at a slower pace than during the pre-crisis period.
Long-term trends in poverty
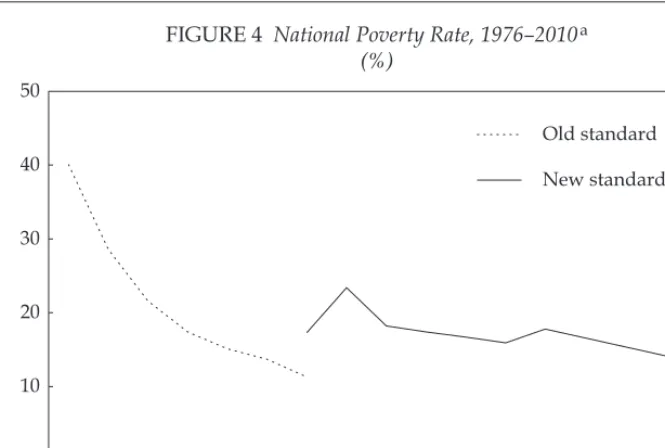
The long-term trends in poverty in Indonesia are depicted in igure 4. The pov-erty rate is calculated by the central statistics agency, Badan Pusat Statistik (BPS), using data collected through the National Socio-economic Survey (Susenas). BPS bases its poverty line on the expenditure required to obtain 2,100 calories of food per capita per day, plus an allowance for essential non-food items. The poverty rate was calculated every three years until 2002 and has been calculated annually since then.
Figure 4 shows a clear downward trend in poverty in Indonesia since data irst became available in 1976. There is an apparent break in the trend around the time of the crisis in 1997–98, however, heralding a slower pace of poverty reduction.
During the pre-crisis period (1976–96) the poverty rate fell from 40.1% to 11.3%, a reduction of 28.8 percentage points over 20 years, or an average reduction of 1.44 percentage points per year. Leaving aside the volatile period of the crisis
1976 1980 1984 1987 1990 1993 1996 1999 2002 2003 20042005 2006 2007 2008 2009 2010 0
10 20 30 40 50
Old standard
New standard FIGURE 4 National Poverty Rate, 1976–2010a
(%)
a In 1998 BPS revised the method of setting the poverty line, resulting in an increase in the poverty
threshold. Recalculation of the data for 1996 using the new method raised the estimate of poverty in that year from 11.3% to 17.3%.
Source: BPS, Statistik Indonesia, various years.
(represented by the 1999 igure), we see that the rate fell from 18.2% to 13.3% between 2002 and 2010, a reduction of 4.9 percentage points over eight years, or an average reduction of 0.6 percentage points per year. This means that the annual pace of poverty reduction in the post-crisis period was only 42.5% of its pace dur-ing the pre-crisis period.
During the entire period from 1976 to 2010, there were only two occasions when the poverty rate went up. The irst increase occurred between 1996 and 1999, as a direct result of the Asian inancial crisis. The poverty rate rose from 17.3% in 1996 (based on the new standard) to 23.4% in 1999, as a combination of job losses, declining incomes and hyperinlation pushed many near-poor Indonesians below the poverty line.
The second uptrend in poverty occurred between 2005 and 2006, when soar-ing inlation propelled the poverty rate from 15.9% to 17.8%. This worsensoar-ing of poverty can be attributed to two factors: an increase in domestic fuel prices by an average of 125% in October 2005, and a rise in the price of rice.
In Indonesia fuel prices are ixed by the government, with the gap between the domestic and the international oil price covered by a government subsidy. When the international oil price increased substantially in 2005, the amount paid out in subsidies also rose inexorably. The pressure on the national budget became unbearable, forcing the government to more than double domestic fuel prices in order to reduce the fuel subsidy.
These reform measures yielded over $10 billion in annualised budgetary sav-ings, a portion of which was allocated to additional health, education and infra-structure programs as well as an unconditional cash transfer scheme targeting the poor and near-poor. Before the October price hike, the government allocated Rp 5 trillion to education, Rp 3 trillion to health and Rp 3 trillion to infrastructure. Between October 2005 and October 2006, it made payments of Rp 300,000 (about $30) to over 19 million households, effectively embarking on the world’s largest unconditional cash transfer program.
The other factor that has been identiied as a central cause of the increase in poverty between 2005 and 2006 was the ban on rice imports in 2004 and the con-sequent increase in the domestic price of rice (World Bank 2006; McCulloch 2008; Warr 2011). Despite the introduction of the unconditional cash transfer program and an expansion of rice subsidies around the same time, many near-poor house-holds were simply unable to cope with the increase in price of their single most important consumption good, and this pushed them below the poverty line.4
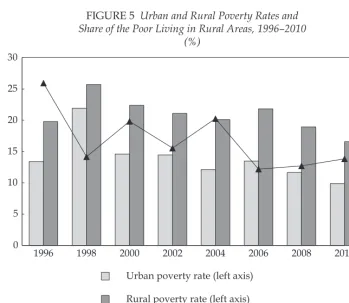
Urban and rural poverty
Rural poverty still dominates the face of poverty in Indonesia, even though around half the population now resides in urban areas. Figure 5 disaggregates poverty by rural/urban area and shows the share of the poor residing in rural areas. It is clear that the rural poverty rate has always been substantially higher than the urban poverty rate. The difference has been at least six percentage points
4 Under the Rice for Poor Families program (Beras untuk Keluarga Miskin, or Raskin), the government sells rice to poor families at heavily subsidised prices. In 2011, the oficial Raskin price of rice was Rp 1,600 per kilogram, compared with a market price for medium-grade rice of more than Rp 7,000 per kilogram.
216 Asep Suryahadi, Gracia Hadiwidjaja and Sudarno Sumarto
in every year except 1998, when the Asian inancial crisis hit urban areas harder than rural areas (Wetterberg, Sumarto and Pritchett 1999).
Between 1998 and 2010, the share of the poor residing in rural areas luctuated around 65% (igure 5). This implies that the number of poor people living in rural areas is almost double the number living in urban areas. Over the entire period, however, there is some indication of an urbanisation of poverty. The share of the poor residing in rural areas fell from 72.3% in 1996 to 64.2% in 2010, a decline of just over eight percentage points in 14 years.
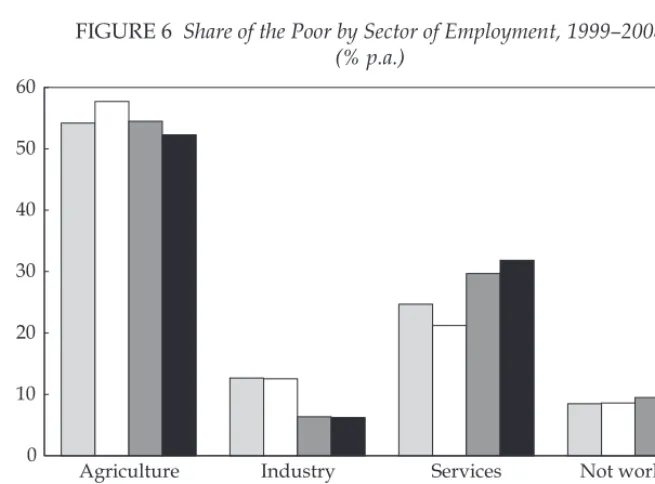
Sectoral proile of poverty
Given that poverty in Indonesia is largely a rural phenomenon, it is not surpris-ing to ind that further disaggregation by sector indicates that it is very much related to the agricultural sector (Alisjahbana and Manning 2006). Figure 6 traces the share of the poor by sector of employment from 1999 to 2008. It shows that more than half the poor worked in the agricultural sector and the majority of the rest in the services sector.
Since the 1999 igure was affected by the Asian inancial crisis, which hit the modern sector in urban areas hardest, trends in sectoral employment shares are better depicted by comparing the igures from 2002 onward. They provide some indication that poverty has been shifting out of agriculture into other sectors,
FIGURE 5 Urban and Rural Poverty Rates and Share of the Poor Living in Rural Areas, 1996–2010
(%)
Source: BPS, Statistik Indonesia, various years. H
H
H
H
H
H H H
1996 1998 2000 2002 2004 2006 2008 2010 0
5 10 15 20 25 30
55 60 65 70 75
Urban poverty rate (left axis)
Rural poverty rate (left axis)
H Share of poor living in rural areas (right axis)
particularly services. In 2002, 57.7% of the poor were employed in the agricultural sector but by 2008 this share had declined to 52.3%. Over the same period, the share of the poor employed in the services sector went up substantially from 21.2% to 31.8%. This probably qindicates that a rising share of the poor is employed in the informal sector where around two-thirds of the Indonesian labour force work (Alisjahbana and Manning 2006).
ECONOMIC GROWTH AND POVERTY REDUCTION
As we have seen, Indonesia experienced high economic growth and a rapid reduction in poverty in the pre-crisis period, followed by lower economic growth and a slower pace of poverty reduction in the post-crisis period. This section uses a growth–poverty model to assess the possible causes of the slowdown in poverty reduction. To achieve this objective, the analysis uses results from pre-vious studies to examine the role of the three main economic sectors in poverty reduction.
The growth–poverty model
In the literature on the connection between economic growth and poverty, a num-ber of studies have focused on the relationship between the sectoral composition of economic growth and rates of poverty reduction. These studies mainly address the question of what kinds of growth are most beneicial for the poor and hence most effective in reducing poverty. So far the results have been mixed, with some studies claiming that one sector is better than others at reducing poverty and oth-ers claiming that any growth is good for the poor. Despite the different indings, Source: BPS, Statistik Indonesia, various years.
FIGURE 6 Share of the Poor by Sector of Employment, 1999–2008 (% p.a.)
Agriculture Industry Services Not working 0
10 20 30 40 50 60
1999 2002 2005 2008
218 Asep Suryahadi, Gracia Hadiwidjaja and Sudarno Sumarto
however, there is a general consensus that the sectoral composition of economic growth is important for poverty reduction, in addition to the rate of growth itself.
Ravallion and Datt (1996) formulated the basic model to estimate the impact of economic growth on poverty as follows:
The parameter of interest in this model is β, which shows the percentage point change in the poverty rate associated with 1% of GDP growth.
Building on this basic model and using provincial panel data for the period 1984–99, Sumarto and Suryahadi (2007) developed a three-sector model for the Indonesian context covering agriculture, industry and services. Suryahadi, Surya-darma and Sumarto (2009) extended the period to 2002, and split the three sectors according to the urban or rural location of growth or poverty. This resulted in the following six-sector model: and services respectively; the subscripts U and R denote urban or rural location (l); and Hljk is the location and sectoral share of GDP in province j.5 Meanwhile,
dSj is the change in population share of province j, Pj is the initial poverty rate of province j and Emj is a vector of initial conditions in province j.6
In equation (2), if βU =β =β =β =β =β
, then the location and sectoral composition of economic growth do not have an impact on poverty. This implies that equation (2) collapses to:
α β γ δ ε
= + + + + +
dPj yj dSj Pj mEmj , (3)
5 The independent variables in equation (2) are sectoral economic growth rates weighted by sectoral GDP shares. This follows from the fact that when total economic growth in equation (1) is decomposed into its sectoral components, they must be weighted by their GDP shares, that is,
= = + + + + +
6 The complete derivation of the model can be found in Suryahadi, Suryadarma and Su -marto (2009). Their results suggested that it was necessary to control for each province’s change in population share and its initial poverty rate. Change in population share was included to control for the effect of inter-provincial migration on poverty. (For more on the importance of rural–urban migration for poverty reduction, see Resosudarmo et al. 2010.) Following the suggestion of Datt and Ravallion (1998) and Son and Kakwani (2004), the authors of this paper also included two control variables to account for initial conditions: the Gini ratio as a measure of inequality, and the share of the labour force with at least nine years of education as a measure of the level of human capital.
which is an extended version of equation (1). But if equation (2) holds, then the location and sectoral composition of economic growth do matter, because growth in each sector affects poverty differently.
Using this growth–poverty model, Sumarto and Suryahadi (2007) found that agricultural sector growth played a dominant role in poverty reduction during the period up to and including the Asian inancial crisis (1984–99). Extending the data to 2002, Suryahadi, Suryadarma and Sumarto (2009) found that service sector growth had become the dominant factor in reducing poverty in both urban and rural areas, while agricultural growth remained important, but in rural areas only. Similar studies have been carried out for other countries. For the case of India, Ravallion and Datt (1996) found that the agricultural sector was the most effec-tive in reducing poverty, with 85% of the poverty reduction there attributable to growth in that sector. Similarly, De Janvry and Sadoulet (2009) concluded that rapid agricultural growth in Vietnam had opened pathways out of poverty for many farming households. Cervantes-Godoy and Dewbre (2010) have argued that agricultural growth is more effective than industrial or service sector growth at reducing poverty in poor countries, where the majority of the poor live in rural areas and are employed in the agricultural sector.
Other studies, however, have found that other sectors have a greater capac-ity to reduce poverty. Using a partial equilibrium, multi-market model for India, Quizon and Binswanger (1986, 1989) discovered – in contrast to Ravallion and Datt (1996) – that the agricultural growth effects of the Green Revolution had not beneited the rural poor; they concluded that the main way to help the poor was to raise non-agricultural rural incomes. However, Sarris (2001) has criticised their analysis on the grounds that they only considered agricultural incomes and did not take into account the spillover effects of agricultural growth on non-agricultural rural incomes. It is quite plausible that initial increases in non-agricultural incomes would help raise non-agricultural rural incomes, which would eventu-ally help the poor.
Based on pooled data from four Southeast Asian countries (Thailand, Indo-nesia, Malaysia and the Philippines), Warr (2006) found that growth of the ser-vices sector had accounted for the largest reductions in poverty in those countries. In Taiwan, however, it was industrial sector growth that was found to have had the greatest impact on poverty (Warr and Wang 1999).
Hasan and Quibria (2004) concluded that the sector whose growth has had the greatest impact on poverty has differed across countries. Thus, agriculture was the most important sector in South Asia and Sub-Saharan Africa, industry was the most important in East Asia (including Indonesia) and services was the most important in Latin America. In Latin America and the Caribbean, agricultural productivity gains did not translate into lower rural poverty rates because the gains were driven by capital, and hence created fewer employment opportunities. Loayza and Raddatz (2010) argued that the common characteristic of poverty-reducing sectors across countries was that they were labour intensive. Therefore, any sector could drive poverty reduction as long as it was labour intensive. Based on an analysis of data from a large number of countries, Dollar and Kraay (2002) found that the average income of the poorest one-ifth in a country rose or fell at the same rate as the average income of the overall population. Hence, they con-cluded that any growth was good for the poor.
220 Asep Suryahadi, Gracia Hadiwidjaja and Sudarno Sumarto
Growth elasticities of poverty
In this paper, the growth elasticity of poverty refers to the percentage point change in the poverty rate attributable to a percentage point change in economic growth. To calculate this elasticity requires estimation of equation (2). However, the esti-mated coeficients are not themselves growth elasticities of poverty because the independent variables in equation (2) are sectoral economic growth rates weighted by sectoral GDP shares. This means that the coeficients indicate the percentage point change in the poverty rate from sectoral economic growth of 1% multiplied by the inverse of the sector’s GDP share. Hence, the growth elasticity of poverty of a sector can be calculated as its estimated coeficient times its GDP share.
Suryahadi, Suryadarma and Sumarto (2009) estimated equation (2) for rural and urban poverty separately using data from 1984 to 2002. Appendix 1 repro-duces their results. Appendix 2 shows the GDP shares of agriculture, industry and services for the period 1984–2008, as well as for the pre-crisis period (1984–96) and the post-crisis period (2002–08).
The coeficients in appendix 1 show that there are strong cross-locational effects of growth on poverty; that is, growth in urban areas helps reduce rural poverty and vice versa. This is consistent with the indings of Suryahadi et al. (2009) on the existence of strong growth linkages and multiplier effects across sectors and locations in Indonesia. De Janvry and Sadoulet (2009) uncovered a similar phe-nomenon in Vietnam.7
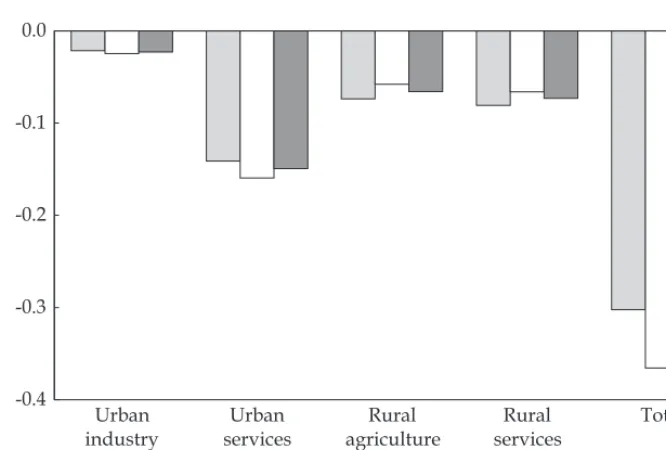
The growth elasticity of poverty for each sector is calculated by multiplying the coeficients in appendix 1 by the GDP shares in appendix 2. This calculation assumes that the results shown in appendix 1 do not change if the end year is extended from 2002 to 2008 (to align with the GDP shares for 1984–2008 shown in appendix 2). Figure 7 shows the estimated growth elasticities of poverty in rural areas for the whole period (1984–2008), the pre-crisis period (1984–96) and the post-crisis period (2002–08). The period of the crisis itself is left out because of the volatility of growth and poverty rates at this time.
For the whole period, the growth elasticity of poverty in rural areas is –0.31, implying that 1% of economic growth reduces rural poverty by 0.31 percentage points. Surprisingly, however, we ind that the elasticity for the post-crisis period (–0.37) is actually higher than the elasticity for the pre-crisis period (–0.30). This indicates that the change in the structure of GDP after the crisis did not reduce the power of each percentage point of economic growth to reduce rural poverty, as hypothesised, but in fact slightly increased it. Miranti (2010) also inds that the growth elasticity of poverty in Indonesia was relatively stable during the 1984– 2002 period.
Turning to the sectoral components of growth, we see that growth in urban services appears to have had the greatest impact on rural poverty in 1984–2008,
7 Rural–urban migration may be the mechanism by which growth in urban areas reduces poverty in rural areas, and vice versa. The model controls for migration across provinces but not for within-province rural–urban migration. The coeficients indicate that rural–ur -ban migration responds to the location of sectoral growth, that is, that strong growth in urban areas induces people to move from rural to urban areas, while strong growth in rural areas dampens rural–urban migration. Resosudarmo et al. (2010) ind that rural migrants generally experience improvements in welfare after moving to the cities.
with an elasticity of –0.15, followed by rural services and rural agriculture (both with around –0.07) and urban industry (–0.02). Growth in urban agriculture and rural industry did not have a signiicant effect on rural poverty. Comparing the elasticities before and after the crisis, we see that those of urban sectors slightly increased, while those of rural sectors slightly decreased.
Figure 8 shows the estimated growth elasticities of poverty in urban areas over the same three periods. For the whole period, the growth elasticity is –0.22, lower than the rural elasticity of –0.31 (igure 7). Looking at the two sub-periods, we ind that the elasticity for the post-crisis period (–0.23) is slightly higher than that for the pre-crisis period (–0.20), as was the case for rural areas.
Turning to the sectoral components of growth in 1984–2008, we see that urban services has the highest growth elasticity (–0.12), followed by rural services (–0.04) and urban industry (–0.02). Comparing the pre- and post-crisis elasticities, we again ind that the growth elasticities of urban sectors slightly increased while those of rural sectors slightly decreased. The inding that service sector growth plays the most important role in reducing poverty in Indonesia is similar to the experience of Latin American countries (Hasan and Quibria 2004).
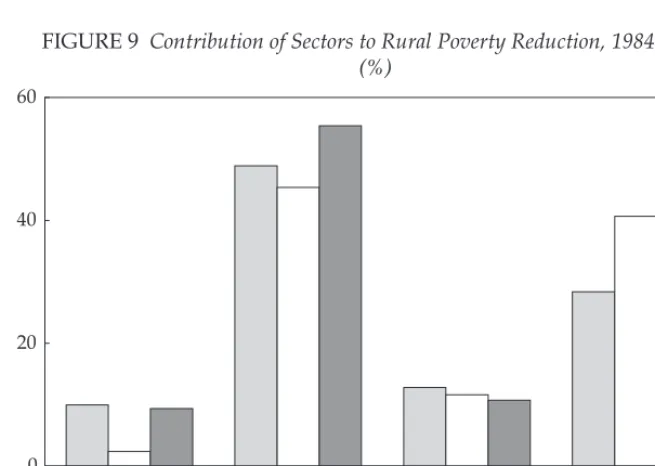
Contribution of sectors to poverty reduction
To calculate the contribution of each sector to total poverty reduction, the elastici-ties estimated in the previous section are multiplied by the actual growth rates for each sector, and the results compared with the observed rate of total poverty reduction.
Figure 9 shows the contribution of agriculture, industry and services to poverty reduction in rural areas. It shows that around 55% of the fall in rural poverty over
Urban industry
Urban services
Rural agriculture
Rural services
Total -0.4
-0.3 -0.2 -0.1 0.0
1984–96 2002–08 1984–2008
FIGURE 7 Growth Elasticities of Rural Poverty, 1984–2008
Source: Authors’ calculations.
222 Asep Suryahadi, Gracia Hadiwidjaja and Sudarno Sumarto
Urban industry
Urban services
Rural services
Total -0.3
-0.2 -0.1 0.0
1984–96 2002–08 1984–2008
FIGURE 8 Growth Elasticities of Urban Poverty, 1984–2008
Source: Authors’ calculations.
Urban industry
Urban services
Rural agriculture
Rural services 0
20 40 60
1984–96 2002–08 1984–2008
FIGURE 9 Contribution of Sectors to Rural Poverty Reduction, 1984–2008 (%)
Source: Authors’ calculations.
the period 1984–2008 can be attributed to growth in urban services. Of the remain-der, 25% was due to growth in rural services, 11% to growth in rural agriculture and 9% to growth in urban industry. Comparing the periods before and after the crisis, we see a notable increase in the contribution of rural services, from 28% to 41%, and a signiicant decline in the share of urban industry, from 10% to 2%, the latter presumably because of the slowdown in industrial growth experienced in the post-crisis period (igure 3). The contribution of urban services fell slightly from 49% to 45%, and that of rural agriculture minimally from 13% to 12%.
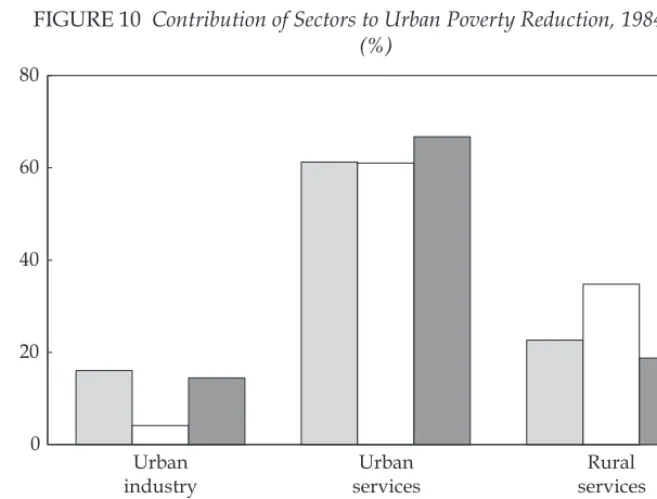
Figure 10 shows the contribution of agriculture, industry and services to pov-erty reduction in urban areas. It shows that around 67% of the fall in povpov-erty experienced in urban areas during 1984–2008 can be attributed to growth in urban services, with the remainder due to growth in rural services (19%) and urban industry (15%). Comparing the periods before and after the crisis, we again see a jump in the share of rural services, from 23% to 35%, and a fall in the contribution of urban industry, from 16% to 4%. The contribution of urban services, mean-while, remained stable at around 61%.
CONCLUSION AND IMPLICATIONS
This study has assessed the relationship between economic growth and poverty reduction in Indonesia before and after the Asian inancial crisis. The annual rate of poverty decline slowed signiicantly in the post-crisis period. However, this study inds no evidence that the growth elasticity of poverty, that is, the percent-age point reduction in poverty attributable to a percentpercent-age point increase in
eco-Urban industry
Urban services
Rural services
0
20 40 60 80
1984–96 2002–08 1984–2008
FIGURE 10 Contribution of Sectors to Urban Poverty Reduction, 1984–2008 (%)
Source: Authors’ calculations.
224 Asep Suryahadi, Gracia Hadiwidjaja and Sudarno Sumarto
nomic growth, declined after the crisis. The slower rates of poverty reduction observed since the crisis are therefore most likely caused partly by the country’s lower rates of economic growth and partly by other factors such as increasing income inequality.
When we split growth into its sectoral components, in both rural and urban areas, we found strong cross-locational effects of growth on poverty. It appears that each percentage point of economic growth in the urban services sector has the greatest power to reduce poverty in both rural and urban areas. This was the case both before and after the crisis, despite a slight decline in the sector’s contri-bution in the post-crisis period, and a sizeable increase in the contricontri-bution of rural services.
Agricultural growth remains important for poverty reduction, but only in rural areas where the majority of the poor live. Industrial growth has largely become irrelevant for poverty reduction in the post-crisis era because of the sector’s con-tinuing under-performance. Although it still contributes the second-largest share of total GDP after services, industry does not absorb as much labour as either agriculture or services. In fact, the sector’s share of employment has declined steadily from its peak in the 1990s. The low and declining capacity of the indus-trial sector to absorb labour perhaps relects the increased use of labour-saving technology, which has made industry more capital and skill-intensive since the late 1990s (Hill 1997).
The indings of this study point to the need to formulate an effective sectoral growth strategy to speed up the rate of poverty reduction. First, the rural services sector has proved that it can make a very signiicant contribution to rural poverty reduction, suggesting that it has the potential to become the leading sector for poverty reduction in rural areas. Second, despite its relatively low growth rates, the agricultural sector still plays an important part in reducing rural poverty. This implies that a concerted effort to improve the sector’s performance would sig-niicantly increase its contribution to poverty reduction in rural areas. Third, if the contribution of the industrial sector to poverty reduction in both urban and rural areas is to be enhanced, not just its growth performance but also its capac-ity to absorb labour needs to improve. Finally, it is essential to maintain the good growth rates of the urban services sector, which is the largest contributor to pov-erty reduction in both urban and rural areas.
REFERENCES
Agrawal, N. (1996) ‘The beneits of growth for Indonesian workers’, Policy Research Work -ing Paper 1637, World Bank, Wash-ington DC.
Alisjahbana, A.S. and Manning, C. (2006) ‘Labour market dimensions of poverty in Indo -nesia’, Bulletin of Indonesian Economic Studies 42 (2): 235–61.
Bird, K. and Manning, C. (2008) ‘Minimum wages and poverty in a developing country: simulations from Indonesia’s household survey’, World Development 36 (5): 916–33. Cervantes-Godoy, D. and Dewbre, J. (2010) ‘Economic importance of agriculture for pov
-erty reduction’, OECD Food, Agriculture and Fisheries Working Paper No. 23, Organi -sation for Economic Co-operation and Development, Paris.
Datt, G. and Ravallion, M. (1998) ‘Why have some Indian states done better than others at reducing rural poverty?’, Economica 65 (257): 17–38.
De Janvry, A. and Sadoulet, E. (2009) ‘Agricultural growth and poverty reduction: addi -tional evidence’, World Bank Research Observer 9 (25): 1–20.
Dollar, D. and Kraay, A. (2002) ‘Growth is good for the poor’, Journal of Economic Growth 7: 195–225.
Hasan, R. and Quibria, M.G. (2004) ‘Industry matters for poverty: a critique of agricultural fundamentalism’, Kyklos 57 (2): 253–64.
Hill, H. (1996) The Indonesian Economy since 1996: Southeast Asia’s Emerging Giant, Cam-bridge University Press, CamCam-bridge.
Hill, H. (1997) Indonesia’s Industrial Transformation, Institute of Southeast Asian Studies, Singapore.
Loayza, N.V. and Raddatz, C. (2010) ‘The composition of growth matters for poverty alle-viation’, Journal of Development Economics 93 (1): 137–51.
Manning, C. (2003) ‘Labor policy and employment creation: an emerging crisis?’, Techni -cal report for Bappenas prepared by the Partnership for Economic Growth–USAID, Jakarta.
McCulloch, N. (2008) ‘Rice prices and poverty in Indonesia’, Bulletin of Indonesian Economic Studies 44 (1): 45–63.
Miranti, R. (2010) ‘Poverty in Indonesia 1984–2002: the impact of growth and changes in inequality’, Bulletin of Indonesian Economic Studies 46 (1): 79–97.
Quizon, J. and Binswanger, H. (1986) ‘Modeling the impact of agricultural growth and government policy on income distribution in India’, World Bank Economic Review 1 (1): 103–48.
Quizon, J. and Binswanger, H. (1989) ‘What can agriculture do for the poorest rural groups?’, in The Balance between Agriculture and Industry in Economic Development, Vol-ume 4, Social Effects, eds I. Adelman and S. Lane, Palgrave Macmillan, Houndmills, Basingstoke.
Ravallion, M. and Datt, G. (1996) ‘How important to India’s poor is the sectoral composi -tion of economic growth?’, World Bank Economic Review 10 (1): 1–25.
Resosudarmo, B.P., Suryahadi, A., Purnagunawan, R.M., Yumna, A. and Yusrina, A. (2010) ‘The socio-economic and health status of rural–urban migrants in Indonesia’, in The Great Migration: Rural–Urban Migration in China and Indonesia, eds X. Meng and C. Man-ning, Edward Elgar, Cheltenham.
Sarris, A.H. (2001) The role of agriculture in economic development and poverty reduction: an empirical and conceptual foundation, Paper prepared for the Rural Development Department of the World Bank, University of Athens, Athens.
Son, H.H. and Kakwani, N. (2004) ‘Economic growth and poverty reduction: initial con -ditions matter’, Working Paper No. 2, International Poverty Centre, United Nations Development Programme, Brasilia.
Sumarto, S. and Suryahadi, A. (2007) ‘Indonesia’, in Beyond Food Production: The Role of Agriculture in Poverty Reduction, eds F. Bresciani and A. Valdés, Food and Agriculture Organization of the United Nations and Edward Elgar, Cheltenham.
Suryahadi, A., Raya, U.R., Marbun, D. and Yumna, A. (2011) ‘Accelerating poverty and vulnerability reduction: trends, opportunities and constraints’, in Employment, Living Standards and Poverty in Contemporary Indonesia, eds C. Manning and S. Sumarto, Insti-tute of Southeast Asian Studies, Singapore.
Suryahadi, A., Suryadarma, D. and Sumarto, S. (2009) ‘The effects of location and sectoral components of economic growth on poverty: evidence from Indonesia’, Journal of Devel-opment Economics 89 (1): 109–17.
Suryahadi, A., Suryadarma, D., Sumarto, S. and Molyneaux, J. (2009) ‘Agricultural demand linkages and growth multipliers in rural Indonesia’, in Rural Investment Climate in Indo-nesia, ed. N. McCulloch, Institute of Southeast Asian Studies, Singapore.
226 Asep Suryahadi, Gracia Hadiwidjaja and Sudarno Sumarto
Timmer, C.P. (2004) ‘The road to pro-poor growth: the Indonesian experience in regional perspective’, Bulletin of Indonesian Economic Studies 40 (2): 177–207.
Warr, P. (2006) ‘Poverty and growth in Southeast Asia’, ASEAN Economic Bulletin 23 (3): 279–302.
Warr, P. (2011) ‘Poverty, food prices and economic growth in Southeast Asian perspective’, in Employment, Living Standards and Poverty in Contemporary Indonesia, eds C. Manning and S. Sumarto, Institute of Southeast Asian Studies, Singapore.
Warr, P. and Wang, W.-T. (1999) ‘Poverty, inequality and economic growth in Taiwan’, in The Political Economy of Taiwan’s Development into the 21st Century: Essays in Memory of
John C.H. Fei, Volume 2, eds G. Ranis, S.-C. Hu and Y.-P. Chu, Edward Elgar, Chelten-ham.
Wetterberg, A., Sumarto, S. and Pritchett, L. (1999) ‘A national snapshot of the social impact of Indonesia’s crisis’, Bulletin of Indonesian Economic Studies 35 (3): 145–52.
World Bank (2006) East Asia Update: Managing through a Global Downturn, World Bank, Washington DC.
APPENDIX 1 The Impact of Sectoral GDP Growth on Rural and Urban Poverty, 1984–2002
Rural Poverty Urban Poverty
Coeficient z-value Coeficient z-value
Urban GDP growth
Agriculture –0.190 –0.83 0.058 0.32
Industry –0.099 ** –2.83 –0.106 ** –3.02 Services –0.413 ** –4.52 –0.344 ** –4.75 Rural GDP growth
Agriculture –0.445 * –2.19 –0.017 –0.08
Industry –0.102 –0.89 0.012 0.17
Services –0.555 ** –5.37 –0.294 ** –3.81 Change in population share 6.477 ** 3.43 2.614 1.68 Initial poverty headcount –0.143 ** –2.72 –0.106 –1.86 Initial Gini ratio –0.002 –0.01 0.043 0.30 Initial human capital –0.264 –1.64 –0.026 –0.40
Constant 0.138 * 2.34 0.040 0.89
Number of observations 132 132
Wald chi-squared 91.43 51.94
Log likelihood ratio 140.88 176.83
** = signiicant at the 1% level; * = signiicant at the 5% level. Source: Suryahadi, Suryadarma and Sumarto (2009).
APPENDIX 2 Share of Urban and Rural GDP by Sector, 1984–2008 (%)
Urban Rural
Agriculture Industry Services Agriculture Industry Services
1984–2008 2.22 23.26 36.19 14.79 10.32 13.21
1984–96 1.72 21.69 34.18 16.56 11.28 14.57
2002–08 2.68 24.75 38.61 13.00 9.02 11.93
Source: BPS, Statistik Indonesia, various years.