Full Terms & Conditions of access and use can be found at
http://www.tandfonline.com/action/journalInformation?journalCode=vjeb20
Download by: [Universitas Maritim Raja Ali Haji] Date: 11 January 2016, At: 19:36
Journal of Education for Business
ISSN: 0883-2323 (Print) 1940-3356 (Online) Journal homepage: http://www.tandfonline.com/loi/vjeb20
Using ACT Subscores to Identify At Risk Students in
Business Statistics and Principles of Management
Courses
Cliff Alan Welborn, Don Lester & John Parnell
To cite this article: Cliff Alan Welborn, Don Lester & John Parnell (2015) Using ACT Subscores to Identify At Risk Students in Business Statistics and Principles of Management Courses, Journal of Education for Business, 90:6, 328-334, DOI: 10.1080/08832323.2015.1058737
To link to this article: http://dx.doi.org/10.1080/08832323.2015.1058737
Published online: 15 Jul 2015.
Submit your article to this journal
Article views: 27
View related articles
Using ACT Subscores to Identify At Risk Students
in Business Statistics and Principles of Management
Courses
Cliff Alan Welborn and Don Lester
Middle Tennessee State University, Murfreesboro, Tennessee, USA
John Parnell
University of North Carolina Pembroke, Pembroke, North Carolina, USA
The American College Test (ACT) is utilized to determine academic success in business core courses at a midlevel state university. Specifically, subscores are compared to subsequent student grades in selected courses. The results indicate that ACT Mathematics and English subscores are a valid predictor of success or failure of business students in statistics and management classes.
Keywords: ACT scores, Principles of Management course, statistics course, student success
INTRODUCTION
Several factors are contributing to an increasingly competi-tive market for college students, including funding formula changes affecting state universities, and enhanced reputa-tion efforts have increased the emphasis on student success, most notably grading and retention efforts. Because aca-demic success leads to higher retention levels, the efficacy of disparate entrance requirements has been pursued as a focus of scholarly research. Universities seek to admit stu-dents who are most likely to succeed (Pharr & Lawrence, 2007), and entrance criteria are employed for this purpose.
Institutions of higher learning across the United States tend to require quantifiable standards for admission, includ-ing test scores, high school transcripts, grade point averages (GPAs), and in some cases essays. The two most frequently required tests are the College Board Scholastic Aptitude Test (SAT) and the American College Test (ACT). The present study focuses on a midlevel state university that accepts the ACT score as one criterion of the admission decision. The specific emphasis of examination involves the mathematics and English subscores as predictors of
academic success in business core courses in statistics and management. The findings confirm that these subscores are more accurate predictors than the ACT composite score of business students’ academic success in statistics and man-agement core courses.
Many business schools maintain separate admission requirements above and beyond those of their respective universities because the business-specific criteria are thought to improve the ability to predict the success of busi-ness majors. In this study, ACT subscores at a midlevel state university are assessed as prospective predictors of failure or success in two business core courses.
LITERATURE REVIEW
With the ACT and the SAT playing an important role in college admissions, the predictive ability of both tests has been scrutinized across the academic realm (Gilmore, 2008; Heard & Ayers, 1988; Rothstein, 2004; Stumpf & Stanley, 2002). Specific studies include prediction of success in nurs-ing programs (Gilmore, 2008), graduation rates (Stumpf & Stanley, 2002), and introductory English courses (Horton, Kher, Molstad, Autrey, & Juneau, 1999). Studies have also examined success on the National Teacher Examination (Hashway, Jones, & Barnes, 1993), a predictor of under-graduate GPAs (Cohn, Cohn, Balch, & Bradley, 2004), and Correspondence should be addressed to Cliff Alan Welborn, Middle
Tennessee State University, Department of Management & Marketing, Box 75, Murfreesboro, TN 37132, USA. E-mail: [email protected]
Color versions of one of more figures in this article are available online at www.tandfonline.com/vjeb.
ISSN: 0883-2323 print / 1940-3356 online DOI: 10.1080/08832323.2015.1058737
successful completion of allied health programs (Jensen, 1989). However, these research studies do not provide clear guidance with regard to the tests.
Popham (2006) noted the importance to the typical high school student of the test scores when he relates that most people remember their scores long after the tests are taken. It is as if they have been branded by the test results. Popham (2006) also compared and contrasted the tests with regard to their purported efficacy. The SAT, first administered in 1926, was designed to test aptitude, or inborn ability. The ACT, conversely, developed by E. F. Lindquist, attempted to test achievement, or prior learning. In some institutions the relevance of the test score cannot be overstated due to the bragging rights and publication of entering students’ average ACT test scores. Most semicompetitive institu-tions, however, lean toward a combination formula that includes both the test scores and the high school GPA (Stumpf & Stanley, 2002).
Most scholars acknowledge some degree of bias in both tests. The bias issue at its core involves research of the pre-dictive validity of the tests with regard to minority or non-White students (Kirby, non-White, & Aruguete, 2007). Bryson, Smith, and Vineyard (2002) reported that high school rank and ACT scores were predictors of success in college of White students, whereas high school GPA was a positive predictor for non-White student success. Similar results were revealed by Kirby et al.’s (2007) analysis of a small, private, Midwestern women’s college.
Somewhat related is the issue of socioeconomic status (Bryson et al., 2002; Harackiewicz, Barron, Tauer, & Elliott, 2002; Kahn & Nauta, 2001). For example, students entering college from a high-income family have higher retention rates than their counterparts from low income families (Braunstein, McGrath, & Pescatrice (2000). Con-versely, Furr and Elling (2002) identified a higher dropout rate for those African-American students who had low incomes and worked longer hours. Interestingly, Kirby et al. (2007) found that students requesting financial aid had higher course grades than those who did not.
Research linking achievement tests and university success is not limited to the United States. In their assessment of China’s National College Entrance Examination (CEE), Bai, Chi, and Qian (2014) found a significant correlation between CEE scores and GPA. However, GPA was also linked to high school achievement and college admission route.
EXPLORING ACT SUBSCORES
Reading, science, mathematics, and English are the four component test categories comprising the multiple-choice questions portion of the ACT. A separate, optional writing examination was added to the test in 2005. Because this portion of the test is not mandatory, it is not germane to this study.
The ACT is predominantly taken by high school juniors and/or seniors in the southern and mid-western regions of the United States. It is, however, accepted by most colleges and universities in the nation (Bettinger, Evans, & Pope, 2013). The four sections of the test yield subscores, and an overall composite score is computed by averaging the sub-scores and rounding to the nearest whole number between 1 and 36. With few exceptions, the composite score is utilized by college admission personnel.
The four components of the ACT are as follows:
Reading—a 40-question, 35-min test on reading comprehension;
Science—a 40-question, 35-min test measuring a vari-ety of science-related skills;
Mathematics – a 60-question, 60-min test on basic math concepts up to 11th grade; and
English—a 75-question, 45-min test covering basic usage and mechanics of the English language, as well as rhetorical skills (Bettinger et al., 2013).
The present study focuses on the use of these four test subscores to determine business student success in two required core courses, Principles of Management and Sta-tistical Methods II, at a midlevel state university in the southern United States. It seeks to expand findings from previous work. For example, with data obtained from the Ohio Board of Regents, Bettinger et al. (2013) studied matriculated students to Ohio’s 13 four-year public institu-tions. The database included information of a demographic nature (age, race, gender), ACT scores, high school GPA, and specific college details such as institution, major, two-year GPAs, and dropout information. Their work supported the notion that English and mathematics subscores can pre-dict outcomes at the college level. However, the reading and science components were found to have very little pre-dictive merit (Bettinger et al., 2013).
UNIVERSITY AND COLLEGE OF BUSINESS ENTRANCE REQUIREMENTS
The midlevel university serving as the focus of the study has entrance requirements for all incoming freshmen as the following:
ACT22 (overall scores; no subscore requirements), Or, high school GPA > 3.00 (those meeting this
requirement do not need an ACT score),
Or, high school GPA > 2.7 and ACT > 19
(combination).
These are the requirements for guaranteed admission. Some students who do not meet these requirements are admitted conditionally. The ACT scores identified are USING ACT SUBSCORES TO IDENTIFY AT RISK STUDENTS 329
composite scores. No subscores are used in the admission evaluation process.
The College of Business has separate entrance require-ments, including the following:
30 semester hours of college credit;
Completion of all high school deficiency issues; Completion of all academic enrichment requirements;
and
Cumulative GPA>2.25 on college-level courses;
Completion of four, specific, prebusiness courses with a GPA2.00.
Students with junior standing must take core courses before being admitted to the College of Business. These standards are consistent with those at other midlevel univer-sities within geographical proximity to the school studied.
Regardless of whether the ACT score of an entering freshman is a valid predictor of academic success, the test is currently utilized at the university featured in this study, and many others. This makes the ACT Composite score the incumbent screening tool for admission requirements. Detractors still exist, however. For example, in 1981 the University of California President Richard C. Atkinson eliminated the use of the SAT as an admission requirement for all eight of the system’s campuses (Davis, Proe, & Boxx, 2006). Nonetheless, because there are no plans to dis-continue its use, the predictive validity of the test’s scores and subscores will continue to be a source of inquiry.
HYPOTHESES AND METHODS
We began our investigation by analyzing the percentage of students earning a grade of D or F in each core business
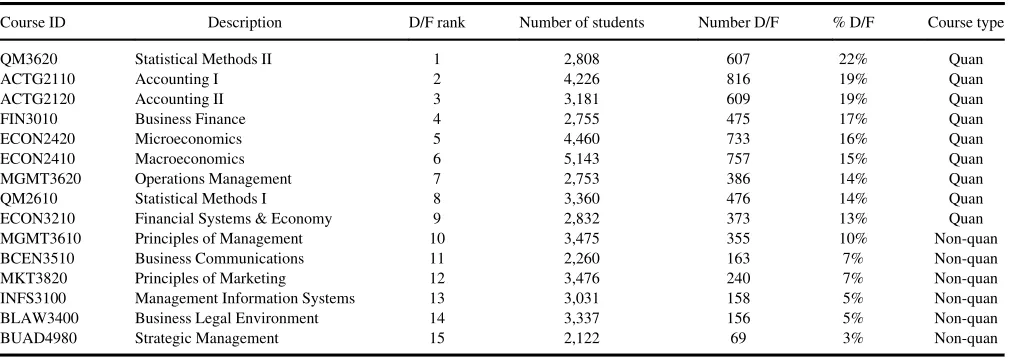
course. We collected the course grades for all students tak-ing any of the core business classes over a 5-year period between the fall of 2008 and the fall of 2012. Course grades, ACT subscores, and ACT composite score were collected for each student. Based on the course catalog description, we identified each core business course (i.e., required of all business majors) as primarily quantitative or nonquantitative. The quantitative course with the highest D/F rate—Statistical Methods II—and the non-quantitative course with the highest D/F rate—Principles of Manage-ment—were selected for further analysis.
The ACT subscores and composite scores for the stu-dents involved in the study were computed. The average English, math, reading, science, and composite score was determined. Additionally we computed the range of the average subscores and the average of the range of sub-scores. The average of the range of subscores showed if individual students performed better in one ACT section over other sections.
We anticipated specific relationships between certain ACT subscores and academic performance. Specifically, we hypothesized that the ACT mathematics subscore would demonstrate the strongest predictive power with the quanti-tative course of statistical methods II, and the ACT English subscore would demonstrate the strongest relationship with the nonquantitative Principles of Management course.
For the purpose of this study, the termsuccessful in a course is defined as scoring a C– or better (i.e., Group 1), while unsuccessful is defined as scoring a DC or below (i.e., Group 2). Mean ACT subscores (mathematics, English, reading, and science) and ACT composite were computed for both groups of students. A two-samplettest of means assuming unequal variance was conducted to determine if the subscore means differed significantly across groups.
TABLE 1 D/F Rate by Core Course
Course ID Description D/F rank Number of students Number D/F % D/F Course type
QM3620 Statistical Methods II 1 2,808 607 22% Quan
ACTG2110 Accounting I 2 4,226 816 19% Quan
ACTG2120 Accounting II 3 3,181 609 19% Quan
FIN3010 Business Finance 4 2,755 475 17% Quan
ECON2420 Microeconomics 5 4,460 733 16% Quan
ECON2410 Macroeconomics 6 5,143 757 15% Quan
MGMT3620 Operations Management 7 2,753 386 14% Quan
QM2610 Statistical Methods I 8 3,360 476 14% Quan
ECON3210 Financial Systems & Economy 9 2,832 373 13% Quan
MGMT3610 Principles of Management 10 3,475 355 10% Non-quan
BCEN3510 Business Communications 11 2,260 163 7% Non-quan
MKT3820 Principles of Marketing 12 3,476 240 7% Non-quan
INFS3100 Management Information Systems 13 3,031 158 5% Non-quan
BLAW3400 Business Legal Environment 14 3,337 156 5% Non-quan
BUAD4980 Strategic Management 15 2,122 69 3% Non-quan
RESULTS
Of the 15 core business courses, nine were identified as quantitative and six were identified as nonquantitative (see Table 1). The quantitative courses ranked 1–9 in terms of D/F rates (with 1 being the course with the highest D/F rate), while the nonquantitative courses ranked 10–15 in terms of D/F rates. Of the nine quantitative courses, Statisti-cal Methods II (QM3620) had the highest D/F rate. The D/F rate of 22% indicates that 22% of the students who took this course, over a five-year period scored a D or F. Of the six nonquantitative courses analyzed, Principles of Manage-ment (MGMT 3610) had the highest D/F rate with 10%.
Analyzing the ACT subscores and composite score revealed some interesting facts (see Table 2). The average ACT English score was 21.8, math average was 21.3, read-ing average was 22.2, and science average was 21.4. The computed range of these averages is 0.9 points. It appears that the ACT subscores are fairly consistent with less than a point separating the high subscore (reading 22.2) from the low subscore (math 21.3). However, we also computed the range of subscores for each student, then averaged that value for all students. The average of ranges turned out to be six points. A six-point differential between a student’s high subscore and their low subscore is a substantial range. This indicates that students typically perform much better in one subscore (subject area) compared to another sub-score (subject area). Consequently, we would expect to find a student performing well in a course related to his or her strength area and poorly in courses relying on skills associ-ated with their weakness area.
In Statistical Methods II, 2,200 of the 2,808 students (78%) scored better than a D in the course. These were identified as Group 1, while those earning a grade of D or F
were identified as Group 2. In Principles of Management (MGMT 3610), 3120 of the 3475 students (90%) scored better than a D. Again, these students formed Group 1, while those with a D or F comprised Group 2. For the Sta-tistical Methods II (QM3620) course, there were significant differences in means for each ACT subscore as well as the ACT composite score. In every subscore, as well as com-posite, Group 1 had a higher average than Group 2. How-ever, the largest differential in means for each subscore was found in the ACT mathematics subscore (see Table 3). In descending order, the differentials were math 1.9, English 1.8, composite 1.6, reading 1.4, and science 1.1. The com-posite score is an average of the four subscores, so its place-ment in the median was expected. It is also not surprising to discover that the largest differential in ACT subscores was found in the mathematics section, considering the heavy emphasis on quantitative skills required in a statistics course. Science had the lowest differential, indicating the two groups were the most similar in this area of knowledge. That would seem logical, as a statistics course would most likely not depend heavily on a student’s knowledge of science.
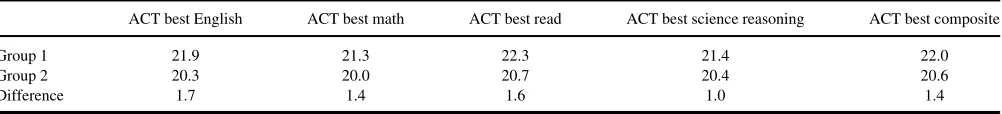
A similar analysis was performed on the nonquantitative course with the highest D/F rate, Principles of Management (MGMT 3610). As previously defined, the population of students who had taken the course was split into Group 1 and Group 2. The average ACT scores between the two groups were compared (see Table 4). In descending order the differentials were English 1.7, reading 1.6, composite 1.4, mathematics 1.4, and science 1.0. The highest differen-tial in English is consistent with the conceptual nature of the course and its emphasis on basic language usage and mechanics. Math skills would not expected to be as impor-tant in this course as they would be in a statistics course. TABLE 2
ACT Subscores and Ranges
English average 21.8
Math average 21.3
Reading average 22.2
Science average 21.4
Range of averages 0.9 points
Average of student ranges 6 points
TABLE 3
QM3620 ACT Subscores, by Group
ACT
Group 1 22.3 21.9 22.6 21.7 22.4 Group 2 20.5 20.0 21.2 20.6 20.8
Difference 1.8 1.9 1.4 1.1 1.6
TABLE 4
MGMT3610 ACT Subscores, by Group
ACT best English ACT best math ACT best read ACT best science reasoning ACT best composite
Group 1 21.9 21.3 22.3 21.4 22.0
Group 2 20.3 20.0 20.7 20.4 20.6
Difference 1.7 1.4 1.6 1.0 1.4
USING ACT SUBSCORES TO IDENTIFY AT RISK STUDENTS 331
A two samplet-test of means assuming unequal variance demonstrated significant differences with regard to the mathematics subscores across groups in the Statisticsstatis-tics II course (see Figure 1). A similar test demonstrated significant differences with regard to English subscores across groups in the Principles of Management course (see Figure 2).
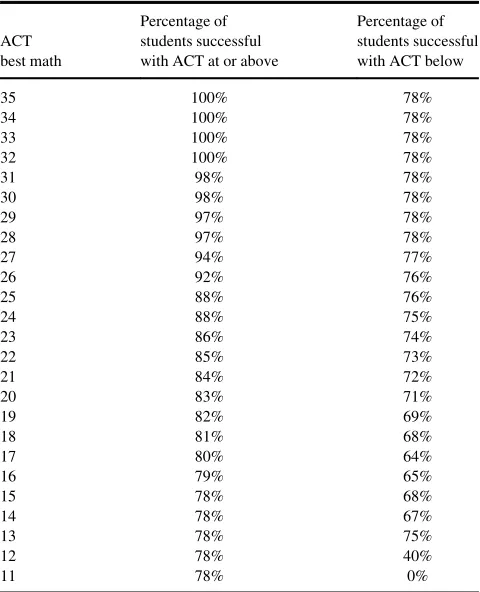
Ultimately, our objective is to use the ACT subscores to identify students who may encounter problems completing specific business courses. For Statistical Methods II (QM3620), students with an ACT math subscore at or above 18 had an 81% probability of scoring better than a D in the course (see Table 5 and Figure 3). Students with an ACT math subscore below 18 had only a 64% probability of scoring better than a D in QM3620.
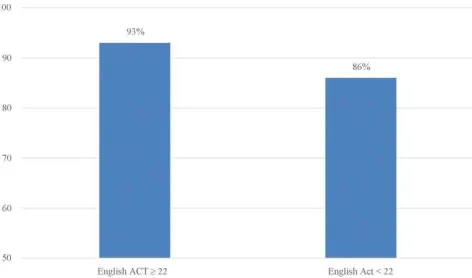
Similar results were found with the Principles of Manage-ment course (MGMT3610), where the ACT English sub-score most clearly predicted success. With an ACT English subscore of 22 or better, a student’s probability of earning a successful grade in the course is 93% (see Table 6 and Fig-ure 4). With an ACT English subscore below 22, their prob-ability of success drops to 86%.
DISCUSSION
Many colleges use the ACT composite score for overall admission criteria. The subscores on the ACT test can be
used to identify students who have a less than average prob-ability of success in a particular course. The ACT mathe-matics subscore is the best indicator of students who will be unsuccessful in the heavily quantitative course of Statistical Methods II. The ACT English subscore is the best predictor of success for the conceptual course of Principles of Management.
No criterion can always predict academic success for a student. Clearly, there are many factors that influence a student’s performance. Many of those factors may be out of the control of, and even unknown, by university
administra-TABLE 5
Statistical Methods II Success Rate by ACT Math Subscore
ACT best math
Percentage of students successful with ACT at or above
Percentage of students successful with ACT below
35 100% 78%
34 100% 78%
33 100% 78%
32 100% 78%
31 98% 78%
30 98% 78%
29 97% 78%
28 97% 78%
27 94% 77%
26 92% 76%
25 88% 76%
24 88% 75%
23 86% 74%
22 85% 73%
21 84% 72%
20 83% 71%
19 82% 69%
18 81% 68%
17 80% 64%
16 79% 65%
15 78% 68%
14 78% 67%
13 78% 75%
12 78% 40%
11 78% 0%
FIGURE 1. t-test for ACT Math in Statistical Methods II.
FIGURE 2. t-test for ACT English in Principles of Management. FIGURE 3. Statistical methods II success rate/critical math subscore.
tors. However, any improvement college administrators can make to help students achieve academic success is a step in the right direction.
Identifying students with a less than average probability of success in a course gives university administrators a chance to be proactive. Not every course requires the same skill set for success, so it is understandable that different screening criteria would be needed for different courses.
PRACTICAL IMPLICATIONS
Universities are faced with new and intensified pressure related to student retention and graduation rates. In many instances, education funding formulas are tied to these rates. Any technique that helps identify students who might have trouble passing a course and enables administrators and faculty to take proactive steps to support at-risk stu-dents should be considered.
Students experience difficulty one course at a time. A student will not necessarily struggle in every class. More likely, certain courses will fit with a student’s strengths while other courses will expose their weaknesses. Conse-quently, screening criteria and remediation efforts need to occur at the course level. This simple ACT subscore evalua-tion has proven to be a more accurate predictor of success in specific courses than the incumbent ACT composite score. University administrators can utilize knowledge of ACT subscores to identify students most likely to experi-ence difficulty. Ultimately, it is in the students’ and uni-versities’ best interest to implement strategies that improve student success in the classroom.
A practical, nonstatistical perspective on the results pre-sented herein warrants discussion. Although differences in ACT subscores were significantly linked to performance differences in the classroom, one could argue that the num-ber of affected students is relatively low, 81% versus 64% in Statistics II and 93% versus 86% in Principles of Man-agement. In Statistics II, this difference affects only about one in six students; in Principles of Management, it affects only about one in 14. Course pretests or other assessments could be developed and may have greater predictive power than the ACT subscores. Hence, while subscores represent a useful lens through which university officials can better understand student performance, they do not represent the only approach.
CONCLUSIONS AND FUTURE RESEARCH
This exploratory study focused only on two business courses, Statistical Methods II and Principles of Manage-ment. In each case, an ACT subscore was more effective than the composite ACT score in predicting success in the corresponding course. The ACT math subscore best pre-dicts success in the statistics course, while the ACT English subscore best predicts success in the Principles of Manage-ment course.
An undergraduate Business degree consists of a combi-nation of quantitative and qualitative courses. The approach employed in this study can be applied to other courses as well. It is likely that different subscores will best predict success in different courses. Future researchers should delineate these specific relationships, allowing university officials to intervene with at-risk students more effectively. TABLE 6
Principles of Management Success Rate by ACT English Subscore
ACT best English
Percentage of students successful with ACT at or above
Percentage of
FIGURE 4. Principles of management success rate/critical English subscore.
USING ACT SUBSCORES TO IDENTIFY AT RISK STUDENTS 333
REFERENCES
Bai, C., Chi, W., & Qian, X. (2014). Do college entrance examination scores predict undergraduate GPAs?China Economic Review,30, 632–647. Bettinger, E. P., Evans, B. J., & Pope, D. G. (2013). Improving college
per-formance and retention the easy way: Unpacking the ACT exam. Ameri-can Economic Journal: Economic Policy,5(2), 26–52.
Braunstein, A., McGrath, M., & Pescatrice, D. (2000). Measuring the impact of income and financial factors on college persistence.Journal of College Student Retention,2, 191–203.
Bryson, S., Smith, R., & Vineyard, G. (2002). Relationship of race, aca-demic and nonacaaca-demic information in predicting the first-year success of selected admissions first-year students. Journal of the First-year Experiences and Students in Transition,14, 65–80.
Cohn, E., Cohn, S., Balch, D., & Bradley, J. Jr. (2004). Determinants of undergraduate GPAs: SAT scores, high school GPA, and high school rank.Economics of Education Review,23, 577–586.
Davis, M., Proe, J., & Boxx, R. (2006). The millionaire mind: Implications for business school education.S.A.M. Advanced Management Journal,
71(4), 35–42.
Furr, S., & Elling, T. (2002). African-American students in a predomi-nantly-white university: Factors associated with retention. College Student Journal,36(2), 188–202.
Gilmore, M. (2008). Predictors of success in associate degree nursing.
Teaching and Learning in Nursing,3, 121–124.
Harackiewicz, J. M., Barron, K. E., Tauer, J. M., & Elliott, A. J. (2002). Pre-dicting success in college: A longitudinal study of achievement goals and ability measures as predictors of interest and performance from freshman year through graduation.Journal of Educational Psychology,94, 562–575.
Hashway, R. M., Jones, G., & Barnes, F. (1993). Identifying teacher candi-dates needing remedial services.Education,113, 563–567.
Heard, W. H., & Ayers, J. B. (1988). Validity of the American college test in predicting success on the Pre-Professional skills test.Psychological Measurement,48, 197–200.
Horton, S., Kher, N., Molstad, S., Autrey, K., & Juneau, G. (1999, November).Using discriminant-function analysis to predict student success in core English courses. Paper presented at the Annual Meet-ing of the Mid-South Educational Research Association, Point Clear, AL.
Jensen, S. C. (1989). Predictors of success in technical careers.Journal of Studies in Technical Careers,11, 297–304.
Kahn, J. H., & Nauta, M. N. (2001). Social-cognitive predictors of first-year college persistence: The importance of proximal assessment.
Research in Higher Education,42, 633–652.
Kirby, E., White, S., & Aruguete, M. (2007). Predictors of white and minority student success at a private women’s college.College Student Journal,41, 460–465.
Pharr, S., & Lawrence, J. (2007). Admission requirements for transfer and non-transfer students: Should one size fit all?Quality Assurance in Edu-cation,15, 162–177.
Popham, W. J. (2006). Branded by a test.Educational Leadership,63(7), 86–87.
Rothstein, J. (2004). College performance predictions and the SAT. Jour-nal of Econometrics,121, 297–317.
Stumpf, H., & Stanley, J. (2002). Group data on high school grade point averages and scores on academic aptitude tests as predictors of institu-tional graduation rates.Educational and Psychological Measurement,
62, 1042–1052.