Study of bundled fiber based displacement sensors using
theoretical model and fitting function approaches
M. YASINa,c*, S. W. HARUNb, KUSMINARTOc, KARYONOc, WARSONOd, A. H. ZAIDANa, H. AHMADe a
Department of Physics, Faculty of Science and Technology, Airlangga University, 60015 Surabaya, Indonesia b
Department of Electrical Engineering, Faculty of Engineering, University of Malaya 50603 Kuala Lumpur, Malaysia c
Department of Physics, Faculty of Mathematics and Natural Science, Gadjah Mada University, 55281 Yogyakarta, Indonesia
d
Department of Physics Education, Faculty of Mathematics and Natural Science, Yogyakarta State University, 55281 Yogyakarta, Indonesia
e
Photonics Laboratory, Department of Physics, University of Malaya, 50603 Kuala Lumpur, Malaysia.
The performance of optical fiber displacement sensors with a pair of probe is theoretically and experimentally demonstrated using a developed theoretical model and fitting function approaches. The displacement measurement is carry out by using the modulated 633nm light source in conjunction with lock-in amplifier to reduce the dc drift and interference of ambient stray light. Based on this measurement, a fitting curve is obtained, which is then compared with the theoretical results. The sensor has two slopes with a linearity of more than 99% for both theoretical and fitting approaches. With the fitting approach, linearity ranges of 500μm and 1450μm are obtained for the front and back slopes respectively. On the other hand, linearity ranges are obtained at 600μm and 1550μm for front and back slopes, respectively using the theoretical approach. The sensitivity (in arb. Units x 103) for the theoretical and fitting approaches are obtained at 1.70 and 1.92, respectively for the front slope and 0.36 and 0.40 respectively for the back slope.
(Received February 19, 2009; after revision February 3, 2009; accepted March 19, 2009)
Keywords: Optical fiber sensor, Displacement sensor, Bundled fiber
1. Introduction
In the last few years, great efforts have been made in the research on optical fiber system [1]. Optical fiber sensors are becoming an important field that attracted many applications in various field [2-4]. One of the applications of the sensor is in a high-precision non-contact displacement measurement, which is the key to micro-nano technologies. In a displacement sensor, there are three methods are commonly adopted, namely laser interferometry, wavelength and reflective intensity modulation techniques. Laser interferometry [5] which is
based on the fringe counting method has high resolution and stability, but its precision and stability is dependent on the wavelength of light. In wavelength modulation, a sophisticated equipment such as spectrum analyzers is needed to detect wavelength changes to power or current changes [6]. Comparatively, the reflective intensity modulation technique is a significantly simpler method for non-contact displacement measurements while at the same time being able to provide high resolutions. In this type of sensor the reflected light from the mirror is coupled back into a fiber from a reflecting surface and this power is compared to a portion of the power emitted by the same light source.
Multimode plastic fibers are in a great demand for the transmission and processing of optical signals in optical fiber communication system. They are also widely used in sensing applications because they provide better signal
coupling, have a large core radius and a high numerical aperture as well as able to receive the maximum reflected light from the target [7]. In this paper, a simple optical fiber displacement sensor is proposed using the intensity modulation technique to measure a displacement between a probe and target. The sensor uses a multimode plastic bundled fiber with a pair type as a probe and red He-Ne laser as a source.The sensitivity and linearity range of the sensor are theoretically and experimentally investigated.
2. Theoretical model
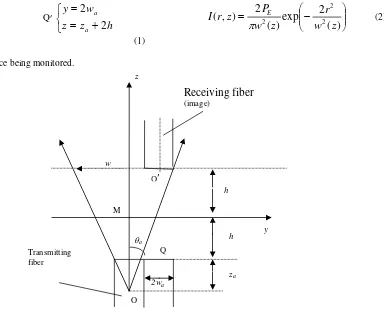
The basic set-up for a displacement sensor consists of a modulated light source, a detector and a Y- branch bundled fiber and a planar mirror. The bundled fiber consists of a pair of transmitting and receiving fibers as shown in Fig. 1. Displacement is measured by comparing the power of the reflected light, which is coupled back into a receiving fiber from a mirror, with a portion of power emitted by the same light source. The amount of light that returns to the detector depends on the distance between the end of the bundled fiber and the mirroring surface being monitored. In order to analyze the displacement sensing characteristic theoretically, the following assumptions are made [8-9]:
between them. Both the transmitting and receiving fibers are assumed to have perfectly circular cross sections with area Sa and radius wa as shown in Fig. 1.
ii. The light leaving the transmitting fiber is represented by a perfectly symmetrical cone with divergence
[image:2.612.135.476.159.238.2]angle θa, and vertex 0 located at a distance za inside the fiber, as shown in Fig. 2.
Fig.1. Front and side views of the transmitting and receiving fibers in a pair type of bundled fiber.
In order to evaluate the amount of light collected by the receiving fiber, the light cone is extended beyond the mirror as shown in Fig. 2 and the image position at the receiving end is analyzed. A z-coordinate is introduced which is aligned to the emitted light cone axis beginning at 0 and extending beyond the mirroring surface, M. The coordinate of the center point in the receiving fiber end is designated as Q′ as shown in Fig. 2 and is represented by:
Q′
⎩
⎨
⎧
+
=
=
h
z
z
w
y
a a
2
2
(1)
where h is the distance being monitored.
The theoretical approach is based on the electromagnetic theory of paraxial Gaussian beams, which is used to derive the transfer function that is dependent on the variance of the optical power collected by the receiving fiber bundle [6]. This approach describes the light leaving the transmitting fiber bundle as a paraxial beam with a Gaussian profile. The irradiance of the emitted light decreases over the beam cross-sections, obeying an exponential law according to
⎟⎟
⎠
⎞
⎜⎜
⎝
⎛
−
=
)
(
2
exp
)
(
2
)
,
(
22
2
w
z
r
z
w
P
z
r
I
Eπ
(2)Fig. 2. Cone of light exiting the transmitting fiber, the cone is extended beyond the mirror and the image position of the receiving end.
z
Receiving fiber
(image)
h
h
za Q
′
Q
O
y θa
M w
Transmitting fiber
2wa
transmitting fiber
receiving fiber wa
wa
2wa
[image:2.612.152.536.383.701.2]where r is the radial coordinate, z is the longitudinal coordinate, PE is the emitted power at origin and
radius
w
(
z
)
=
w
01
+
(
z
/
z
R)
2 is a measure of the beam width which is z dependence. The constants w0 and zR are the waist radius and Rayleigh range respectively and their relationship is given by;R
z
w
λ
π
2=
0 (3)
In the case of the points situated in the far-field zone (z >> zR), the beam resembles a spherical wave confined within a cone as depicted in Fig. 2. The cone is characterized by a divergence angle given by:
0 0
)
(
tan
w
z
w
z
z
w
R a aπ
λ
θ
θ
≈
=
=
=
(4)and the irradiance function can be simplified as:
⎟
⎟
⎠
⎞
⎜
⎜
⎝
⎛
−
=
2 2 2 2 22
exp
2
)
,
(
z
r
z
P
z
r
I
a a Eθ
πθ
(5)The optical power collected by the receiving fiber is evaluated by integrating I(r,z) over the fiber end surface Sa as shown below:
∫
=
Sb
I
r
z
dS
z
P
(
)
(
,
)
. (6)We assume that the irradiance I(r,z) is approximately constant across the receiving surface with area
2 a
a
w
S
=
π
, and equal to its value at the center of thereceiving fiber (point Q′) where
r
=
2
w
a≈
2
θ
az
a. In this case, we obtain⎟⎟
⎠
⎞
⎜⎜
⎝
⎛
−
=
=
2
2exp
8
2ζ
ζ
Eb
P
IS
P
(7)where N a a
h
z
h
z
z
2
1
2
1
+
=
+
=
=
ζ
(8)and hN is a relative displacement. By
analyzing
dP
/
d
ζ
=
0
, the collected power reaches itsmaximum value
P
max=
[(
P
E/
4
)
exp
−1]
when8
=
ζ
(i.e.,h
N=
0
.
9142
). Taking this into account,we may rewrite (Eq. 7) in normalized form
max
/
P
P
P
N=
as⎟⎟
⎠
⎞
⎜⎜
⎝
⎛
−
=
8
2exp
1
8
2ζ
ζ
N
P
(9)A relative displacement can be evaluated using this equation and Fig. 2. If, r = 0.5mm, λ = 633nm and w0= 0.46mm, za is calculated to be 1141mm. By using
a
N
h
z
h
=
/
, we obtainh
N=
[(
h
/
1141
)
×
10
−3]
in arb. units, where h is a displacement, which has been moved in step of 50μm in the experiment. For the portion of a linear curve, the sensor sensitivity is evaluated by deriving of PN with respect to hNN N
h
P
S
∂
∂
=
(10)Making use of Eq. 9, we get:
) ( 1 8 4
2 2
ζ
ζ
ζ
ζ
PN PNS ⎟⎟ ⎠ ⎞ ⎜⎜ ⎝ ⎛ − = ∂ ∂
= (11)
3. Fitting function model
Based on a theoretical approach, normalized output (PN) as function of relative displacement (ξ
2
) can be assumed by:
)
1
exp(
2 2ζ
ζ
B
A
P
N=
−
(12)where A and B are constant. By using a software mathematica version 7.0, a fitting function can be obtained and the result shows that the normalized power is given by;
)
23
.
6
1
exp(
20
.
6
2 2ζ
ζ
−
=
NP
(13)which is similar to the theoretical function of Eq. 9.
4. Experimental setup
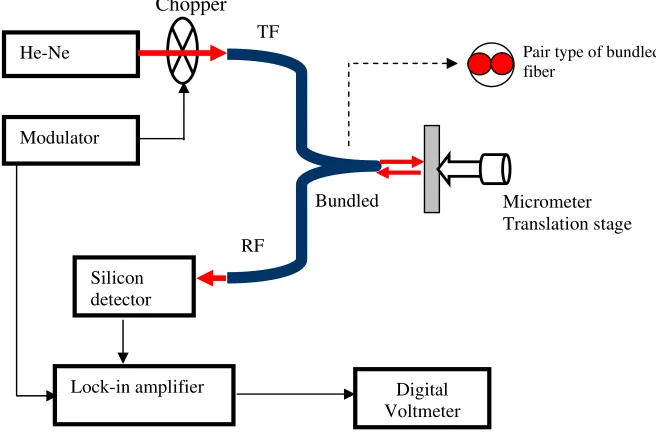
200Hz. The modulated light source is used in conjunction with lock-in amplifier to reduce the dc drift and interference of ambient stray light. In this displacement sensor, the intensity modulation technique is adopted and a real object is used as a reflecting target. The light from a light source enters a transmitting core and then radiates to the target, and the light reflected from object surface is transmitted through the receiving core to a photo-detector. The amount of light returning to detector depends on the distance between the end of the probe and the target being monitored.
[image:4.612.145.473.214.431.2]In the pair type of bundled fiber, the transmitting and receiving fibers are placed side by side. Static displacement of the target is achieved by mounting it on a translation stage. The distance between the optical fiber probe and the target is varied in successive steps of 50 μm. The signal from the detector is converted into a voltage and is measured using a digital voltmeter. The voltage is measured against the corresponding change in micrometer translation stage.
Fig.3. Experimental setup of optical fiber displacement sensor. (TF: transmitting fiber, RF: receiving fiber).
[image:4.612.316.537.525.676.2]5. Results and discussion
Fig. 4 shows the variation of the output voltage against the displacement of the target from the optical fiber probe using a pair type of bundled fiber based on a theoretical approach. The intensity of the detected light depends on the distance of the target from the fiber probe. All the curves exhibit a maximum with a steep linear at front slope and back slope which follows an almost inverse square law relationship for the reflected light intensity versus distance of the mirror from fiber optic probe. The signal is minima at zero distance because the light cone does not reach the receiving fiber (RF) cores. As the displacement increases, the size of the reflected cone of light at the plane of fiber increases and starts overlapping with the RF cores leading to a small output voltage. Further increases in the displacement lead to larger overlapping which in turn results in an increase in the output voltage. However, after reaching the maximum value, the output voltage starts decreasing even though the displacement increases. This is due to the large increase in the size of the light cone and the power density decreases with the increase in the size of the cone of light. The peak
intensity distance increases with the receiving fiber diameter and decreases as the ratio between the receiving and transmitting fiber diameter reduces as shown in Fig. 4.
0.0 0.2 0.4 0.6 0.8 1.0
0.0 1.0 2.0 3.0 4.0 5.0 A relative displacement (arb. Units x 0.001)
A
no
rm
a
liz
ed
oup
ut
(a
rb.
U
n
it
s
)
Fig. 4. Variation of the normalized output voltage (PN) with the relative displacement (hN) of the mirror from the optical fiber probe with a pair based on theoretical approaches.
Micrometer Translation stage He-Ne
Modulator
Silicon detector
Lock-in amplifier Digital
Voltmeter Bundled
Chopper TF
RF
A function of normalized output (PN) from a theoretical approach is used to assume a fitting function as described in Eq. 12. The fitting function is used to fit the experimental data, which is obtained from the displacement measurement. The fitting result is then compared with the theoretical result as shown in Fig. 5. This figure shows the variation of the normalized output voltage against the relative displacement of the target from the optical fiber probe. The fitting curve shows a similar pattern with the theoretical curve as shown in Fig. 5.
0.0 0.2 0.4 0.6 0.8 1.0
0.0 1.0 2.0 3.0 4.0 5.0
A relative displacement (arb. Units x 0.001)
A
n
or
m
al
iz
ed
out
put
(
ar
b.
u
ni
ts
)
[image:5.612.78.294.202.346.2]Theory Fitting
Fig. 5. Normalized output voltage (PN) as a function of relative displacement (hN) for a pair bundled probe obtained from fitting function and theoretical approaches
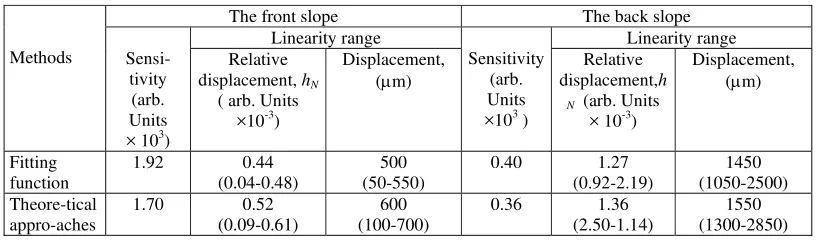
The curves have front and back slopes, which show a good linearity with a certain regions exhibits linearity of more than 99% for the theoretical and fitting approaches as shown in Fig. 5. The fitting curve shows a linearity range of 0.44 (0.04~0.48) for the front slope, which corresponds to 500μm (50-550μm). The back slope shows a higher linearity in the range of 1.27 (0.92~2.19) which corresponds to 1450μm (1050-2500μm). On the other hand, theoretical curve has a linearity range of 0.52 (0.09-0.61) which corresponds to 600μm (100-700μm) for front slope. The linearity range for the back slope is obtained at 1.36 (2.50-1.14) which corresponds to 1550μm (1300-2850μm). The sensitivity (in arb. Units x 103) for the theoretical and fitting results is obtained at 1.70 and 1.92, respectively for the front slope and 0.36 and 0.40, respectively for the back slope. Both fitting and theoretical approaches show a good function approximation due to the sensitivity and a linearity range are almost same. The performance of the optical fiber displacement sensor from fitting function and theoretical approaches is summarized in Table 1. The fitting curve is slightly different compared to the theoretical curve due to the neglecting of the Gaussian beam truncation effects which is caused by the opaque outer jacket that covers the emitting bundled in our simple model.
Table 1. Comparison of the performance of the sensor from fitting function and a theoretical approaches.
The front slope The back slope Linearity range Linearity range Methods Sensi-
tivity (arb. Units × 103)
Relative displacement, hN
( arb. Units ×10-3)
Displacement, (μm)
Sensitivity (arb. Units ×103 )
Relative displacement,h
N (arb. Units
× 10-3)
Displacement, (μm)
Fitting function
1.92 0.44 (0.04-0.48)
500 (50-550)
0.40 1.27 (0.92-2.19)
1450 (1050-2500) Theore-tical
appro-aches
1.70 0.52 (0.09-0.61)
600 (100-700)
0.36 1.36 (2.50-1.14)
1550 (1300-2850)
6. Conclusions
A simple and effective optical fiber micro displacement sensor is theoretically and experimentally demonstrated based on the intensity modulation technique. The sensor uses a pair type of bundled fiber, a 633 nm light source and lock-in amplifier system. The experimental data is fit using a proposed fitting function model which the result matches well with the theoretical result. The sensor has two slopes with a linearity of more than 99% for both theoretical and fitting approaches. With the fitting approach, linearity ranges of 500 μm and
[image:5.612.102.510.447.567.2]References
[1] J. M. Lopez Higuera, Handbook of optical fibers sensing technology, University of Cantabria,
Photonics, Spain, Part three: principles and techniques for sensing.
[2] Y. Kikutani, K. Mawatari, K. Katayama, M. Tokeshi, T. Fukuzawa, M. Mitaoka, T. Kitamor, Sensors and Actuators B, Article in Press, doi. 10.1016/j.snb.2008. 02.001., 2008.
[3] A. D. Mazzeo, A. J. Stein, D. L.Trumper,
R. J. Hocken, Precision Engineering, Article in Press, doi. 10.1016/j.precisioning.2008.04.007., 2008. [4] F. Ceysens, M. Driesen., K. Wouters, R. Puers, K. U. Leuven, Sensors and Actuators A, 145-146, 81 (2008).
[5] A. Bergamin, G. Cavagnero, G. Mana, Rev. Sci. Instrum., 64, 3076 (1993).
[6] Ng Jun Hong, X. Zhou, X. Yang, J. Hao, Optics Comm., 272, 398 (2007).
[7] S. Nalwa, Polymer optical fibres. California: American Scientific Publishers; 2004.
[8] M. Yasin, S. W. Harun, H. A. Abdul-Rashid, Kusminarto, Karyono, A. H, Zaidan, H. Ahmad, Optoelectron. Adv. Mater. - Rapid Comm. 1, (11), 549 (2007).
[9] J. B., Faria, IEEE Trans. and Meas., 47, (3), 742 (1998).
___________________________ *