www.elsevier.com / locate / livprodsci
Prevalence and indicators of post partum fatty infiltration of the
liver in nine commercial dairy herds in The Netherlands
a ,
*
b c d aR. Jorritsma
, H. Jorritsma , Y.H. Schukken , P.C. Bartlett , Th. Wensing ,
eG.H. Wentink
a
Ruminant Health Unit, Department of Farm Animal Health, Faculty of Veterinary Medicine, University of Utrecht, P.O. Box 80.151, 3508 TD Utrecht, The Netherlands
b
Veterinary Centre Oosterwolde, Oosterwolde, The Netherlands
c
Department of Population Medicine and Diagnostic Sciences, Cornell University, Ithaca, NY, USA
d
Department of Large Animal Clinical Sciences, College of Veterinary Medicine, Michigan State University, East Lansing, MI, USA
e
CR Delta, Arnhem, The Netherlands
Received 2 November 1999; received in revised form 18 April 2000; accepted 6 June 2000
Abstract
A field study was performed with 218 dairy cows in nine dairy herds in order to investigate the prevalence of post partum fatty infiltration of the liver and its relationship to subsequent body condition scores, blood variables and milk production. The mean concentration of triacylglycerols in the liver was 61.2 mg / g wet liver tissue. The prevalence of fatty liver (more than 50 mg triacylglycerol in 1 g wet liver tissue) was 54.1%. Serum non-esterified fatty acids, urea and blood glucose
2
concentrations appeared to be significant indicators of hepatic lipidosis between 6 and 17 days post partum (R 50.33). High milk production and large losses of body condition score in early lactation were significant indicators of hepatic lipidosis
2
from a retrospective point of view (R 50.22). Single body condition scores were not significantly related to the concentration of triacylglycerol in the liver. It was concluded that, according to the classification used, fatty liver seems to be fairly common in early lactating dairy cows. Although correlation coefficients were too low to enable a precise and accurate description of liver triacylglycerol content, we found some biologically explicable variables in commercial herds that were significantly related to the liver triacylglycerol content. 2001 Elsevier Science B.V. All rights reserved.
Keywords: Cattle; Pathology; Fatty liver; Prevalence; Body condition score
1. Introduction acterised by infiltration of triacylglycerol (TAG) in
the liver. It may be related to metabolic disorders Fatty liver syndrome or hepatic lipidosis is char- that are often associated with a variety of clinical abnormalities including reproductive and production disorders, and reduced immunity (Morrow et al., *Corresponding author. Tel.: 131-30-2531-248; fax:1
31-30-1979; Reid et al., 31-30-1979; Reid, 1980; Reid and 2521-887.
E-mail address: [email protected] (R. Jorritsma). Roberts, 1982; Higgins and Anderson, 1983; Gerlof
and Herdt, 1984; Wentink et al., 1997). High con- 2. Materials and methods
centrations of TAG in the liver are most often found
in early lactation, with the exception of heifers (Reid 2.1. Study population et al., 1979, 1983a,b; Reid, 1980; Gerloff et al.,
1986; Van den Top et al., 1996). Cases of high The field study was performed in nine dairy herds concentrations of TAG in the liver are rarely found during the housing seasons of 1995–1996 and 1996– in pregnant cows (Gerlof and Herdt, 1984). 1997. Of the nine herds, ranging in size from 50 to The fatty infiltration of the liver is due to a 120 cows, six herds were included in both seasons negative energy balance, arising from a relatively and three herds were included in only one season. low peri-parturient dry matter intake accompanied by The herds were selected as a convenience sample high energy demands for milk production (Bertics from those herds participating in a veterinary herd and Grummer, 1999). In most cows, the fatty health programme with monthly farm visits by infiltration seems to be transient and not pathological veterinary practitioners. All cows were housed in (Veenhuizen et al., 1991; Van den Top et al., 1996). freestalls with cubicles and were fed twice daily a The reason why the negative energy balance that ration in which grass silage was the main component affects almost every dairy cow results in some cases (.60% of dry matter). The dairy herds, as well as in fatty infiltration of the liver and is almost absent in the veterinary practice, were located in the dairy-other cases, is still not fully understood. orientated northern part of The Netherlands. The The amount of TAG in the liver is usually prevalence of fatty liver was not evaluated in the quantified by taking a liver biopsy. Gaal et al. (1983) herds before. There was, however, no history of showed that two commonly used techniques are abnormal disease incidence or confirmed fatty liver highly correlated. Testing of blood hepatic enzyme cases in any of the selected herds.
activities is poorly correlated with hepatic TAG with With the exception of heifers, all cows (no selec-the exception of elevated aspartate aminotransferase tion was executed) which calved during the housing (Reid et al., 1983b) and low glycerolphosphate season were included in the study. A total of 181 acyltransferase activities (Van den Top et al., 1996). healthy cows were included in the study in 1995– Hepatic lipidosis is frequently associated with in- 1996. Due to haemolysis of blood samples, only creased serum non-esterified fatty acid (NEFA) another 37 cows were included in 1996–1997. Only concentrations and low blood glucose concentrations 13 cows participated in both years. The number of (Higgins and Anderson, 1983; Reid et al., 1983b; cows from each herd during the two housing seasons Veenhuizen et al., 1991; Wentink et al., 1997). is presented in Table 1. The average 4% fat-cor-Although the negative impact of the TAG accumu- rected milk production of all herds in 1996 is given lation in the liver on health and reproduction of dairy in Table 1, in order to provide an approximate cows is commonly discussed, data on its prevalence indication of the production level of the participating under commercial field conditions is limited. Also, herds. These data were, however, not included in any more knowledge on the relationship of high liver of the analyses.
TAG with variables that can be measured under field
conditions, such as body condition scores (BCS) and 2.2. Sampling procedures blood values, would be of great relevance in order to
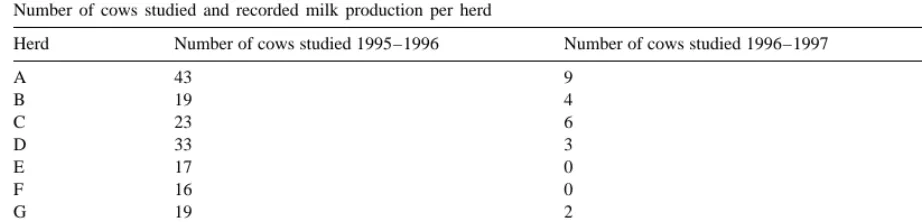
Table 1
Number of cows studied and recorded milk production per herd
a
Herd Number of cows studied 1995–1996 Number of cows studied 1996–1997 Milk yield
A 43 9 9284
B 19 4 9632
C 23 6 8853
D 33 3 9735
E 17 0 9484
F 16 0 9092
G 19 2 8619
H 11 6 9233
I 0 7 10 304
a
Average 4% fat-corrected milk yield per cow on each herd in 1996 (kg).
farmers ensured the permanent presence of feed in heparin / paraoxon tubes for NEFA determination. A the bunk during the day, resulting in a considerable tube without additive was used for serum urea amount of daily feed refusals. This reduced the risk analysis. Percutaneous biopsy of the liver was per-of a circumscript large feed intake that is most likely formed with a Urocut biopsy needle, without using the cause of the diurnal variation in serum NEFA the core of this instrument. Prior to the biopsy, concentration. Also, we were especially interested in clipping and desinfection was applied to the biopsy the use of some practically obtained variables to site. Subsequently, a stab incision was made at the estimate the liver TAG content rather than elucidat- level of the greater trochanter in the 11th intercostal ing its aetiology. This urged us to take samples space on the right side of the cow. The liver tissue, irrelevant of the time of the day. obtained by moving the biopsy needle several times At the same time as the sampling for blood and in the direction of the contralateral elbow, was kept liver tissue, a single BCS of the cows was recorded in physiologic saline under refrigeration until ana-(BCS 1) on a scale from 1 (emaciated) to 5 (very fat) lysed (there was no effect of this short term storage in steps of 0.25 (Edmonson et al., 1989). The on the measured TAG amount in liver tissue; un-recording of the BCS was repeated between 38 and published data). The unprocessed blood samples 50 days post partum (BCS 2). A regular daily milk were, together with the liver tissue, refrigerated recording by the Dutch dairy board (CR Delta / NRS) before and during transport to the laboratory, once was done on every herd, with an interval of 4 or 6 every week.
weeks (depending on the herd). We used only the Blood was analysed for glucose (mmol / l), serum second recording post partum in our models. This urea (mmol / l) and NEFA (mmol / l). The concen-uncorrected recording, which was thus done between tration of TAG was measured (mg / g) in the liver 4 and 12 weeks post partum, was judged to be a biopsy and classified as low (0–50 mg / g), moderate suitable and practically available variable for de- (51–100 mg / g) and severe (.100 mg / g) TAG termining individual milk production. There are of accumulation in the liver (Gaal et al., 1983). All course more accurate methods to describe the milk analyses were performed at the laboratory (Utrecht) production of dairy cows in early lactation. Never- by methods described elsewhere (Van den Top et al., theless, we decided to use the data which is present 1996).
on the farm without any adjustments, in order to
reflect field circumstances as much as possible. 2.3. Applied statistical methods Blood samples were taken from the coccygeal
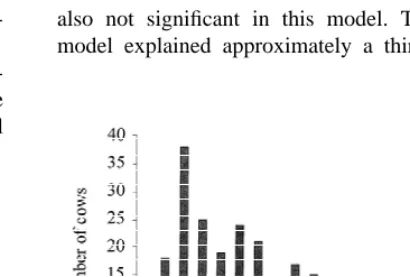
measurements (DBCS) was computed for each in- cases (45.9%), the moderate class 87 cases (39.9%) dividual cow and was included in one of the models and the severe class 31 cases (14.2%). The con-described below. centration of TAG in the liver varied between 12.7 Four general linear models were developed with and 208.6 mg / g wet weight with a mean of 61.2 the liver TAG as the dependent variable. Herd was mg / g (S.E. mean 2.6). A frequency histogram is included as a fixed-effect classification variable in all presented in Fig. 1.
models. All other variables were treated as fixed- The mean blood glucose concentration was 2.93 effect continuous variables. Main effects of each mmol / l (S.D.50.44), mean serum NEFA was 0.48 variable were evaluated before considering quadratic mequiv. / l (S.D.50.23) and mean serum urea was effects and two-way interactions. Only one variable 5.28 mmol / l (S.D.51.13).
was removed or entered manually at each step The mean BCS between 6 and 17 days post depending on their significance in the model. partum (BCS 1) was 3.0 (S.D.50.7) and between The first model, annotated as the estimation 38 and 50 days post partum (BCS 2) was 2.3 model, contained variables measured between 6 and (S.D.50.5). These two mean BCSs were different 17 days post partum in order to estimate with those from each other (P,0.0001) according to the t-test. variables the amount of TAG in the liver at that The mean difference between BCS 1 and BCS 2 was moment. Blood glucose, serum NEFA and serum 0.7 (S.D.50.5). The correlation between BCS 1 and urea concentrations were included in this model. DBCS was 0.6 (P,0.0001).
The second model, annotated as the retrospective Tables 2 and 3 present outcomes of the estimation model, contained variables available several weeks and retrospective models, respectively. Both analyses after the liver TAG measurement: the regular milk used the liver TAG content as the dependent vari-recording between 4 and 12 weeks post partum and able. Serum NEFA and urea concentrations and the change in BCS during the first period of lacta- blood glucose concentrations were the only signifi-tion. Interactions between these variables were also cant variables in the estimation model. No quadratic evaluated. This model may be used in retrospect to effects and two-way interactions were significant. In detect herds with a high prevalence of cows with the retrospective model, only the milk recorded elevated concentrations of TAG in the liver. between weeks 4 and 12 post partum and the Two other models (third and fourth model) con- difference between BCS 1 and BCS 2 were sig-tained only BCS 1 and BCS 2, respectively, as nificantly related to the hepatic TAG. Quadratic independent variables. Additionally, the correlation variables and interactions between the variables were (Pearson’s) between BCS 1 and DBCS was calcu- also not significant in this model. The estimation
2 lated. model explained approximately a third (R 50.33)
Residuals were output and examined for normali-ty. All analysis were done with the Statistix software (Statistix 4.1, Analytical Software) and statistical significance was defined at P,0.05.
3. Results
The milk production of the participating cows at week 4 to 12 post partum varied between 24.1 and 60.4 kg per day. The mean milk production of these cows in that period was 41.0 (S.D.56.71) kg per day.
The prevalence of moderate plus severe fatty liver
Table 2
Regression coefficients, standard errors (S.E.s) and P values of the estimation model for the description of the liver triacylglycerol content (mg / g) between 6 and 17 days post partum (n5218
2
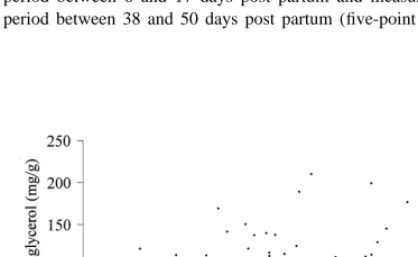
Serum non-esterified fatty acids between days 6 and 17 post
partum (mequiv. / ml). Fig. 3. The relationship between liver triacylglycerol between 6
b
Blood glucose between days 6 and 17 post partum (mmol / l). and 17 days post partum and the average milk yield per cow
c
Serum urea between days 6 and 17 post partum (mmol / l). between 4 and 12 weeks post partum (n5218 cows).
and the retrospective model explained approximately 2
a fifth (R 50.22) of the variation in TAG con-Table 3
Regression coefficients, standard errors (S.E.s) and P values of the centration. The relationships between the liver TAG retrospective model for the description of the liver triacylglycerol and the most significant variable in the estimation content (mg / g) between 6 and 17 days post partum (n5218
and retrospective models are depicted in Figs. 2 and
2
cows) (R of the model: 0.22)
3. Regression coefficient S.E. P
The BCS 1 and BCS 2 values that were included Intercept 229.40 18.90 0.12 in the third and fourth models, respectively, were not Herd – – – significant (P50.15 and P50.21).
Single day-recorded milk production between 4 and 12 weeks
4. Discussion
post partum (kg).
b
Difference in body condition score between measurement in
The percentage of moderate plus severe liver TAG period between 6 and 17 days post partum and measurement in
period between 38 and 50 days post partum (five-point scale). fatty liver of 54.1% found in this study is within the range of those reported in other studies (Reid, 1980; Reid et al., 1983a; Gerloff et al., 1986). It is not discussed in this paper whether the encountered severity of fatty liver is of clinical importance or not, as is suggested in many publications (Morrow et al., 1979; Reid et al., 1979; Reid, 1980; Reid and Roberts, 1982; Higgins and Anderson, 1983; Gerloff et al., 1986). The percentages obtained do not necessarily reflect the prevalences in the involved herds or in The Netherlands, as only a certain number of cows from nine dairy herds were used in this study. We expect, however, that these preval-ences are fairly typical, because the percentages of this study are comparable with percentages reported in other studies and cows were selected by calving Fig. 2. The relationship between liver triacylglycerol and serum
dates only. Thus, the potential impact of fatty liver non-esterified fatty acid (NEFA) concentration between 6 and 17
the cows in this study appeared to have severe fatty mobilisation process, there may be some effects of liver. BCS 1 on liver TAG that are completely modulated The combination of high serum NEFA and low by the DBCS, which in turn reflects how animals blood glucose concentrations is commonly seen and cope with NEB. Similar conclusions were drawn by biologically explicable during the negative energy other researchers (Reid, 1980).
balance (NEB) of post partum dairy cows, because it Minimising NEB in order to avoid high TAG reflects the shortage of energy and the subsequent concentrations in the liver is theoretically possible by mobilisation of body fat reserves. A relationship with either maximising energy uptake or minimising the these variables and with liver TAG content, which is demands for energy. The demands for energy are found in the estimation model, is therefore not necessary for the genetically-related high milk pro-surprising. The significant effect of low serum urea duction; therefore, high energy intake should be concentrations in the same model may be explained achieved. In order to achieve a high energy intake, it by a saving in NH3 metabolism due to NEB, is important to provide a palatable diet with a high although NEB could also evoke higher NH and urea3 energy concentration in early lactation. Restricting concentrations when proteins are metabolised for feed according to requirements in the dry period is energy supply. another factor that has impact on the post partum The two single BCS measurements were not feed intake. In comparison with an ad libitum significant in any of the models that described the feeding regime, restriction had no effect on total liver TAG. The differences between the two BCSs, milk production and resulted in higher blood levels DBCS, was significant in the retrospective model and of glucose, lower serum levels of NEFA post partum may therefore be of some use. Although cows with a and increased peri-parturient dry matter intake (Kunz high BCS have more fat to mobilise, which is et al., 1985; Van den Top et al., 1996). Post partum illustrated with our data, a lot of them did not have a energy deficit in the restricted feeding group was high concentration of TAG in the liver. It is theoret- also less marked.
ically possible that the cows with a high concen- Body condition score at parturition seems to be tration of liver TAG had an even higher BCS at another factor that modulates feed intake in early parturition and experienced already a severe loss in lactation. Investigations (Garnsworthy and Topps, BCS before our first measurement. It is also possible 1982; Garnsworthy and Jones, 1987) showed that that at least a part of the high TAG concentration cows with a higher BCS are more likely to have poor depends on differences between cows in how they appetites post partum and have a larger gap between cope with the high energy demands and concomitant calving and the time of maximum dry matter intake. NEFA mobilisation in early lactation. As a conse- This observation is, however, not demonstrated in quence of this theory, cows with high as well as with every study (Van den Top et al., 1996). Our data low BCS between 6 and 17 days post partum can showed that BCS 1 was indeed related to DBCS have high concentrations of TAG in the liver, which (correlation coefficient50.6), but a relationship would be in agreement with our results. Because a between BCS 1 and liver TAG was lacking. Because measurement of the BCS immediately before or after negative effects of a high BCS (relative to low) are parturition is lacking in this study, it is not possible more often reported, we would suggest a BCS of to discern between these two possibilities. 3–3.5 at calving to be a reasonable goal.
Goff and Horst, 1997; Dirksen et al., 1999). In The veterinary practice in Oosterwolde and Dr. T.H. Netherlands for example, a dry cow transition period Herdt for carefully reading the manuscript.
of 1 or 2 weeks is commonly advised.
Determining BCS at several times during
lacta-tion, in order to get aDBCS, may be useful function References
in monitoring the effect of the measures taken in the
dry period on NEB in early lactation in order to Bertics, S.J., Grummer, R.R., 1999. Effects of fat and methionine hydroxy analog on prevention or alleviation of fatty liver avoid a possible TAG accumulation in the liver.
induced by feed restriction. J. Dairy Sci. 82, 2731–2736. Bines, J.A., Hart, I.C., Morant, S.V., 1983. Endocrine control of
energy metabolism in the cow: diurnal variations in the concentrations of hormones and metabolites in the blood
5. Conclusion
plasma of beef and dairy cows. Horm. Metab. Res. 15, 330– 334.
Milk production in early lactation, together with Dirksen, G.H., Liebich, H.G., Mayer, E., 1999. Adaptive changes the DBCS, is a retrospective indicator and the of the ruminal mucosa and their functional and clinical
significance. Bov. Pract. 20, 116–120. combination of blood glucose, serum NEFA and
Edmonson, A.J., Lean, I.J., Weaver, L.D., Farver, T., Webster, G., serum urea is a good estimator of a high TAG
1989. A body condition scoring chart for Holstein dairy cows. concentration in the liver. This is probably useful as J. Dairy Res. 72, 68–78.
a first approach to suspected fatty liver herds in Gaal, T., Reid, I.M., Collins, R.A., Roberts, C.J., Pike, B.V., 1983. practice. Biopsy is, however, more accurate, but also Comparison of biochemical and histological methods of es-timating fat content of liver of dairy cows. Res. Vet. Sci. 34, more invasive in diagnosing high concentrations of
245–248. TAG in the liver than combined measurements of
Garnsworthy, P.C., Topps, J.H., 1982. The effect of body con-blood glucose, serum urea and NEFA concentrations dition of dairy cows at calving on their food intake and or the observation of milk production and BCS loss. performance when given complete diets. Anim. Prod. 35, Both to confirm a diagnosis in practice and in 113–119.
Garnsworthy, P.C., Jones, G.P., 1987. The influence of body research, biopsy will therefore remain preferable.
condition at calving and dietary protein supply on voluntary Because our data showed thatDBCS was, in contrast
food intake and performance in dairy cows. Anim. Prod. 44, to the BCS in early lactation, significantly associated 347–353.
with the liver TAG, suggests that the differences of Gerlof, B.J., Herdt, T.H., 1984. Hepatic lipidosis from dietary TAG between cows may be explained by differences restriction in non-lactating cows. J. Am. Vet. Med. Assoc. 185,
223–224. in how cows cope with NEB. Further research
Gerloff, B.J., Herdt, T.H., Emery, R.S., 1986. Relationship of should be focussed on elucidating the differences
hepatic lipidosis to health and performance in dairy cattle. J. between cows as to how they cope with NEB and on Am. Vet. Med. Assoc. 188, 845–850.
assessing the effects of post partum NEB and Goff, J.P., Horst, R.L., 1997. Physiological changes at parturition (subclinical) fatty liver on health and performance in and their relationship to metabolic disorders. J. Dairy Sci. 80,
1260–1268. dairy cows, as the prevalence of fatty liver is rather
Higgins, R.J., Anderson, W.S., 1983. Fat cow syndrome in a high.
British dairy herd. Vet. Rec. 113, 461–463.
Kunz, P.L., Blum, J.W., Hart, I.C., Bickel, H., Landis, J., 1985. Effects of different energy intakes before and after calving on food intake, performance and blood hormones and metabolites
Acknowledgements in dairy cows. Anim. Prod. 40, 219–231.
Morrow, D.A., Hillman, D., Dade, A.W., Kitchen, Y., 1979. This study was only possible with the generous Clinical investigation of a dairy herd with the fat cow
syndrome. J. Am. Vet. Med. Assoc. 174, 161–167. co-operation of the involved farmers: K. Gorter,
Reid, I.M., 1980. Incidence and severity of fatty liver in dairy A.H. van de Hengel, A. Hoekstra, A. Kuiper, H.J.
cows. Vet. Rec. 107, 281–284.
Neimeijer, T. Riedstra, P.H. Tjassing, J. Veenstra and Reid, I.M., Roberts, C.J., 1982. Fatty liver in dairy cows. In H. van de Vosse. We greatly appreciate the assistance Practice 4, 164–169.
associated with fatty liver in high yielding dairy cows. Vet. Sci. Miller, L.D., Young, J.W., 1991. Metabolic changes in blood Commun. 3, 231–236. and liver during development and early treatment of ex-Reid, I.M., Dew, S.M., Collins, R.A., Ducker, M.J., Bloomfield, perimental fatty liver and ketosis in cows. J. Dairy Sci. 74,
G.A., Morant, S.V., 1983a. The relationship between fatty liver 4238–4253.
and fertility in dairy cows: a farm investigation. J. Agric. Sci. Wentink, G.H., Rutten, V.P.M.G., van den Ingh, T.S.G.A.M., ¨
101, 499–502. Hoek, A., Muller, K.E., Wensing, Th., 1997. Impaired specific Reid, I.M., Rowlands, G.J., Dew, A.M., Collins, R.A., Roberts, immunoreactivity in cows with hepatic lipidosis. Vet. Immunol.
C.J., Manston, R., 1983b. The relationship between post-par- Immunopathol. 56, 77–83.
tum fatty liver and blood compositions in dairy cows. J. Agric. Van den Top, A.M., Geelen, M.J., Wensing, Th., Wentink, G.H., Sci. 101, 473–480. van ‘t-Klooster, A.T., Beynen, A.C., 1996. Higher postpartum Studer, V.A., Grummer, R.R., Bertics, S.J., Reynolds, C.K., 1993. hepatic triacylglycerol concentrations in dairy cows with free Effect of prepartum propylene glycol administration on rather than restricted access to feed during the dry period are periparturient fatty liver in dairy cows. J. Dairy Sci. 76, associated with lower activities of hepatic glycerolphosphate
2931–2939. acyltransferase. J. Nutr. 126, 76–85.