ENHANCED X-RAY ABSORPTION PROPERTY OF GOLD-DOPED
SINGLE WALL CARBON NANOTUBE
Alimin
1,2, Narsito
2, Indriana Kartini
2, and Sri Juari Santosa
2,* 1Department of Chemistry, Universitas Halu Oleo, Kampus Hijau Bumi Tridharma Anduonohu-Kendari 93232, Indonesia 2
Department of Chemistry, Faculty of Mathematics and Natural Sciences, Universitas Gadjah Mada Sekip Utara PO BOX BLS 21 Yogyakarta 55281, Indonesia
Received April 16, 2015; Accepted August 19, 2015
ABSTRACT
Enhanced X-ray absorption property of single wall carbon nanotube (SWCNT) through gold (Au) doping (Au@SWCNT) has been studied. Mass attenuation coefficient of SWCNT increased 5.2-fold after Au doping treatment. The use of ethanol in the liquid phase adsorption could produce Au nanoparticles as confirmed by the X-ray Diffraction (XRD) patterns. The possibility of gold nanoparticles encapsulated in the internal tube space of SWCNT was observed by transmission electron microscope technique. A significant decrease of nitrogen uptakes and upshifts of Radial Breathing Mode (RBM) of Au@SWCNT specimen suggest that the nanoparticles might be encapsulated in the internal tube spaces of the nanotube. In addition, a decrease intensity of XRD pattern of Au@SWCNT at around 2θ ≈ 2.6° supports the suggestion that Au nanoparticles are really encapsulated into SWCNT.
Keywords:X-ray absorption; mass attenuation coefficient; gold nanoparticles; SWCNT
ABSTRAK
Telah dikaji peningkatan sifat absorpsi single wall carbon nanotube (SWCNT) terhadap sinar-X melalui doping logam emas (Au@SWCNT). Koefisien atenuasi massa SWCNT mengalami peningkatan 5,2 kali lipat setelah penambahan dopan Au. Penggunaan etanol dalam adsorpsi fasa cair dapat menghasilkan nano-partikel Au seperti yang ditunjukkan oleh difraktogram XRD. Kemungkinan adanya nano-partikel Au yang terkapsulasi di bagian dalam dinding SWCNT diamati dengan menggunakan TEM. Penurunan serapan gas nitrogen dan pergeseran frekwensi Radial Breathing Mode (RBM) dari sampel Au@SWCNT mengindikasikan bahwa nano-partikel Au diduga telah terkapsulasi di ruang bagian dalam SWCNT. Disamping itu, penurunan intensitas difraktogram Au@SWCNT pada 2θ ≈ 2.6° memperkuat dugaan bahwa nano-partikel Au telah terkapsulasi di dalam SWCNT.
Kata Kunci:absorpsi sinar-X; koefisien atenuasi massa; nano-partikel Au; SWCNT
INTRODUCTION
Nowadays, many scientists and researchers concerned to nanotechnology are extensively studying fabrication of nanomaterials in order to generate the novel materials with the desired properties such as hard, strong but light-weight. Those materials could be applied in a wide variety of fields included short wave electromagnetic radiation area such as gamma-ray, ultraviolet and X-ray. It is well-known that electromagnetic radiation not only provides benefits to life but also can generate adverse effect to human life. Therefore, in order to obtain materials which are able to offer protection against electromagnetic radiation, great efforts have been extensively carried out by many researchers [1-5].
Single wall carbon nanotube (SWCNT) is envisaged to be one of the most promising candidates of the materials due to nanometric dimension, distinctive structure, extraordinary physical properties such as many-fold stronger than steel, harder than diamond, very lightweight, electrical conductivity higher than copper, thermal conductivity higher than diamond. It make them can be applied to generate new sustainable technology [6-7]. Carbon nanotube possessing cylindrical nanoscale space can offer a quite deep interaction potential for substances (e.g. atoms and molecules). Therefore, atoms and molecules tend to be concentrated in the internal tube space. Regarding the molecules adsorption, molecules adsorbed in the space of carbon nanotube form a high density assembly comparable to the bulk solid or liquid density even above the boiling temperature. In similar
Ret
ract
producing of 1D-metal, because well characterized SWCNT is available, providing better scientific results. As doping metal in the tube space of SWCNT often varies the electronic structure of SWCNT, metal-doped SWCNT is expected to demonstrate better catalysis, gas sensing, transparent conducting film, nanoelectronics.
Regarding the electromagnetic area, it has been reported that CNTs have been applied for electromagnetic shielding, particularly at high frequencies ranging in the GHz. In various types of CNT composites have been fabricated through mixing the tubes with polymer resins [1-3,8], ceramics [4] and metal powders [9]. These studies showed that CNTs could exhibit novel and outstanding electromagnetic effects [4-5]. It is crucial to be noted that SWCNT has cylindrical nanotubulites that can be nested, and the interaction of radiation with this nanotubulites appears to be very different when compared to their interaction with planar or stacked graphene sheets [10]. Interestingly, Fujimori et al. [10] found that SWCNT possesses high shielding of X-ray radiation even higher than highly oriented pyrolytic graphite (HOPG). Hence we need to continue fundamental studies on well-characterized nanocarbons. In this context, we report enhanced X-ray absorption property of gold (Au)-doped SWCNT (Au@SWCNT) in which Au is doped as a metallic in the internal tube space. It is believed that the X-ray mass absorption coefficient does not depend on the nanostructure but on the component atoms. However, Fujikawa and Kaneko [11] theoretically showed that the established rule on X-ray absorption is valid within the approximation of the dipole moment transition and the higher order momentum transition depends on nanoscale structure. The enhancement of X-ray absorption due to the nanostructure form is estimated to be 10–20% at best.
EXPERIMENTAL SECTION
Materials
Chemicals used in this research such as HAuCl4.6H2O (99.9 wt%), HCl 36 wt%, HNO3 (60 wt%)
and ethanol (99.5 wt%) were purchased from the Wako Chemical Co. The SWCNT-Meijo was purchased from Co. Ltd. This SWCNT was synthesized by the arc-discharge method using 1.03 wt% of nickel and 0.26 wt% of yttrium possessing 1.46–1.67 nm in diameter with 1–5 µm in length. It has high crystallinity and purity above 90 wt% and contains less than 3 wt% of catalyst remains. Besides, it has a dense bundles structure [12].
spectrophotometer (RAMAN Renishaw in via Raman microscope) equipped with red laser energy 1.58 eV, nitrogen adsorption apparatus (Quantachrome-Autosorb-iQ2-MP), Transmission electron microscopy (TEM-JEOL-JEM-2100).
Procedure
Opening end cap and purifying of the SWCNT The SWCNT samples were oxidized under air at 723 K for 30 min in order to obtain opened-end samples. The opened-end SWCNT was then chemically purified using sequential acid treatment technique. This technique consists of two stages i.e.; first stage, the opened-end SWCNT was dipped ultrasonically of 28 kHz in 1 M HCl for 15 min and stirred for 20 h. It was then filtered with a Millipore porous filter (0.45 µm) and washed with Distilled Water (DW) until neutral. The second stage is that the SWCNT was dispersed in 1 M HNO3 for 150 min and
then refluxed at 333 K for 6 h. Afterwards, the SWCNT was filtered with a Millipore porous filter (0.45 µm) and washed with DW until neutral and then rinsed with ethanol. The sample was dried in vacuum dryer at 383 K for 24 h. The treated SWCNT is denoted as ox-pur-SWCNT.
Doping of HAuCl4solution in the SWCNT
Prior to doping treatment, the ox-pur-SWCNT was evacuated at room temperature under 0.1 Pa for 24 h. The evacuated SWCNT of 5 mg was dipped in HAuCl4
solutions of 10 ppm containing 99.5 wt% ethanol and it was then dispersed ultrasonically by a 28 kHz ultrasound apparatus for 48 h at 298 K. It was then filtered with a Millipore porous filter (0.45 µm), rinsed with ethanol of 200 mL and dried at 383 K for 24 h. The obtained samples are denoted as Au@SWCNT.
Characterization of non-doped SWCNT and
Au@SWCNT
Thermal Gravimetric as well as differential thermal analysis were performed on TGA/DTA apparatus, RIGAKU Thermo plus TG 8120 under O2-N2
atmosphere. The gas flow and heating rate were 300 mL min-1 and 3 K min-1, respectively. X-ray diffraction patterns were measured at room temperature using XRD RIGAKU 2300 SF/RDF with voltage and current of 50 kV and 30 µA, respectively. The Raman spectrophotometer (RAMAN Renishaw in via Raman microscope) equipped with red laser (energy 1.58 eV, wavelength 785 nm) was used. In
Ret
ract
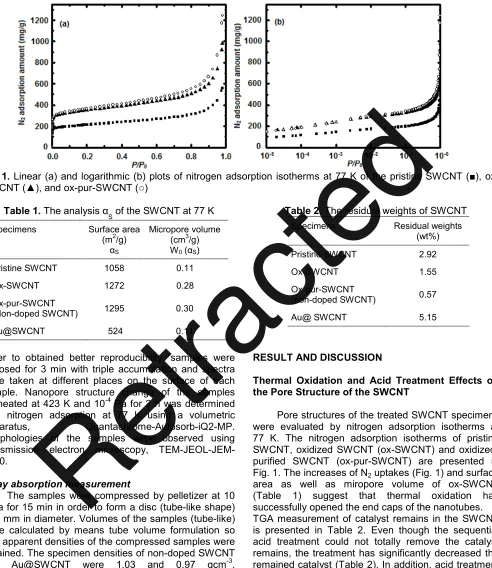
Fig 1. Linear (a) and logarithmic (b) plots of nitrogen adsorption isotherms at 77 K of the pristine SWCNT (■),
ox-SWCNT (▲), and ox-pur-ox-SWCNT (○)
Table 1. The analysis α
Sof the SWCNT at 77 K
Specimens Surface area (m2/g)
αS
Micropore volume (cm3/g) W0 (αS)
Pristine SWCNT 1058 0.11
Ox-SWCNT 1272 0.28
Ox-pur-SWCNT
(Non-doped SWCNT) 1295 0.30
Au@SWCNT 524 0.11
Table 2.The residual weights of SWCNT
Specimens Residual weights (wt%)
Pristine SWCNT 2.92
Ox-SWCNT 1.55
Ox-pur-SWCNT
(non-doped SWCNT) 0.57
Au@ SWCNT 5.15
order to obtained better reproducibility, samples were exposed for 3 min with triple accumulation and spectra were taken at different places on the surface of each sample. Nanopore structure change of the samples preheated at 423 K and 10-4Pa for 2 h was determined with nitrogen adsorption at 77 K using a volumetric apparatus, Quantachrome-Autosorb-iQ2-MP. Morphologies of the samples were observed using transmission electron microscopy, TEM-JEOL-JEM-2100.
X-ray absorption measurement
The samples were compressed by pelletizer at 10 MPa for 15 min in order to form a disc (tube-like shape) of 5 mm in diameter. Volumes of the samples (tube-like) were calculated by means tube volume formulation so that apparent densities of the compressed samples were obtained. The specimen densities of non-doped SWCNT and Au@SWCNT were 1.03 and 0.97 gcm-3, respectively. In the present work, measurement technique of X-ray absorption of the samples referred to work of Fujimori et al. [10].
RESULT AND DISCUSSION
Thermal Oxidation and Acid Treatment Effects on the Pore Structure of the SWCNT
Pore structures of the treated SWCNT specimens were evaluated by nitrogen adsorption isotherms at 77 K. The nitrogen adsorption isotherms of pristine SWCNT, oxidized SWCNT (ox-SWCNT) and oxidized-purified SWCNT (ox-pur-SWCNT) are presented in Fig. 1. The increases of N2uptakes (Fig. 1) and surface
area as well as miropore volume of ox-SWCNT (Table 1) suggest that thermal oxidation has successfully opened the end caps of the nanotubes. TGA measurement of catalyst remains in the SWCNT is presented in Table 2. Even though the sequential acid treatment could not totally remove the catalyst remains, the treatment has significantly decreased the remained catalyst (Table 2). In addition, acid treatment not only plays an important role for removing the catalyst remains but also for decapping of the nanotubes as demonstrated before in Fig. 1 and Table 1. Therefore, ox-pur-SWCNT denoted as non-doped SWCNT would be selected for doping treatment.
Ret
ract
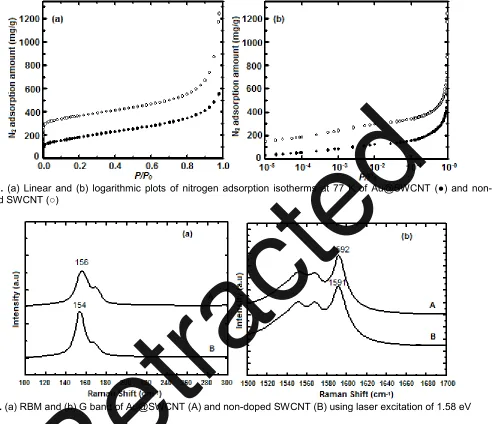
Fig 2. (a) Linear and (b) logarithmic plots of nitrogen adsorption isotherms at 77 K of Au@SWCNT (●) and
non-doped SWCNT (○)
Fig 3.(a) RBM and (b) G band of Au@SWCNT (A) and non-doped SWCNT (B) using laser excitation of 1.58 eV
Gold Nanoparticles Encapsulated SWCNT
Nitrogen adsorption isotherms of Au@SWCNT and non-doped SWCNT at 77 K are presented in Fig. 2. It is clearly seen that Au encapsulation treatment remarkably decreases the nitrogen adsorption amount at entire pressure range (Fig. 2a) indicating that Au was not only encapsulated into internal tube spaces but also doped onto external surface and interstitials spaces of the SWCNT. Nitrogen adsorption uptake at low pressure is associated with internal tube space of SWCNT. The adsorption isotherms in the lower P/Po region are clearly
presented in logarithmic plot (Fig. 2b). The N2adsorption
isotherms have a gradual jump around P/Po = 2 x 10 -2
. The N2 adsorption amount decrease clearly on the
Au-doping in particular below P/Po = 10 -1
. The N2
adsorption of SWCNT below P/Po = 10-2 should stem
from adsorption in the internal tube spaces and the
interstitial pore of the SWCNT bundle. When Au particles are doped in the internal tube spaces and interstitial sites, adsorption of N2 molecules are
intervened seriously, dropping the N2 adsorption in the
low pressure region. Actually, the N2 adsorption
amount on Au@SWCNT below P/Po= 10 -4
is almost nil. Hence Au should be doped in the internal tube spaces of the SWCNT and the interstitial pores of the SWCNT bundle. However, N2 adsorption amount of
Au@SWCNT almost coincides with that of non-doped SWCNT. Au@SWCNT must have a larger value of the external surface area than non-doped SWCNT. The pore structure parameters of non-doped SWCNT and Au@SWCNT are summarized in Table 1. It can be seen that the micropore volume of SWCNT depress about 2.5-fold after Au encapsulation treatment. The small amounts of nitrogen adsorption uptakes at low pressure and dramatic depress of micropore of the
Ret
ract
SWCNT suggest that Au nanoparticles have been encapsulated in the internal tube space of the nanotube.
The Au encapsulated in the internal tube space of SWCNT is also supported by shifting radial breathing mode (RBM) of Raman spectroscopy (Fig. 3a) because RBM frequency corresponds to diameter of SWCNT as given by equation (1) [13].
1
1
RBM cm A / dt nm cm
(1)
where the A is constant of 248 cm-1.
Fig. 3a shows that the RBM peak of SWCNT positioned at 154 cm-1 corresponds to the tubes diameter of 1.63 nm. It implies that the SWCNT is composed of nanotubes with similar diameter. Regarding the Au encapsulated SWCNT, it is clearly seen that Au encapsulation lead to shifting the RBM peak of SWCNT to the higher frequencies of 156 cm-1 that could be attributed to a decrease of the tube diameter. The origin of this shifting can be attributed either to an increase of C–C binding energy due to the charge transfer from SWCNT to Au agreeing with work of Eliseev et al. [14].The upshift of the RBM strongly corresponds to smaller tubes diameter as a result of Au particles encapsulated in the internal tube spaces of the nanotube. Raman spectroscopy also provides information on charge transfer property of carbon nanotube which can be acquired through interpretation of tangential mode (G band) of SWCNT at around 1590 cm-1[15-16]. Fig. 3b displays the G band of the SWCNT. It can be seen that Au encapsulation treatment modified the G band of the SWCNT to the higher frequency. The G band denoted as ωG+is sensitive to charge transfer from dopant additions to SWCNT in which upshifts in ωG+
for acceptors, and downshifts for donors. Therefore, the upshift of the G band in particularωG+in this study could be caused by the fact that Au particles act as an electron acceptor with respect to SWCNT and the
corresponding shift of the Fermi edge takes place. In the other word, SWCNT donates charge to Au particles so that the tangential modes (ωG+) of the SWCNT slightly shift to higher frequency. This phenomenon is good agreement with work of Eliseev et al. [14].
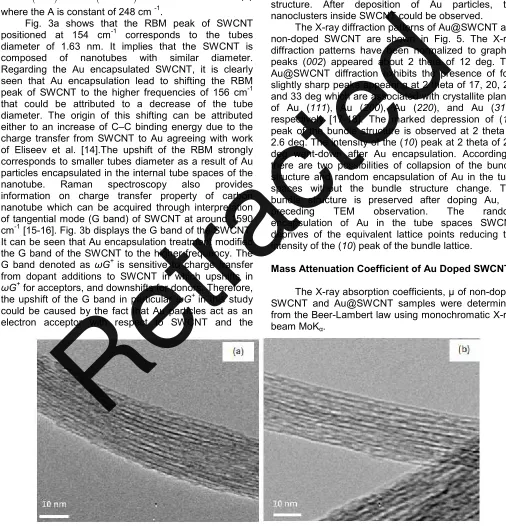
Fig. 4(a) and (b) show the TEM images of non-doped SWCNT and Au@SWCNT, respectively. The SWCNT possess a well-ordered and strong bundle structure. After deposition of Au particles, the nanoclusters inside SWCNT could be observed.
The X-ray diffraction patterns of Au@SWCNT and non-doped SWCNT are shown in Fig. 5. The X-ray diffraction patterns have been normalized to graphite peaks (002) appeared about 2 theta of 12 deg. The Au@SWCNT diffraction exhibits the presence of four slightly sharp peaks appearing at 2 theta of 17, 20, 28, and 33 deg which are associated with crystallite planes of Au (111), Au (200), Au (220), and Au (311), respectively [17-18]. The marked depression of (10) peak of the bundle structure is observed at 2 theta of 2.6 deg. The intensity of the (10) peak at 2 theta of 2.6 deg went-down after Au encapsulation. Accordingly, there are two possibilities of collapsion of the bundle structure and random encapsulation of Au in the tube spaces without the bundle structure change. The bundle structure is preserved after doping Au, as preceding TEM observation. The random encapsulation of Au in the tube spaces SWCNT deprives of the equivalent lattice points reducing the intensity of the (10) peak of the bundle lattice.
Mass Attenuation Coefficient of Au Doped SWCNT
The X-ray absorption coefficients, μ of non-doped
SWCNT and Au@SWCNT samples were determined from the Beer-Lambert law using monochromatic X-ray beam MoKα.
Fig 4.TEM images of (a) non-doped SWCNT, and (b) Au@SWCNT
Ret
ract
Fig 5.The X-ray diffraction patterns of Au@SWCNT (A) and non-doped SWCNT (B)
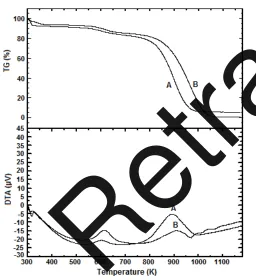
Fig 6. TGA and DTA profiles of Au@SWCNT (A) and non-doped SWCNT (B)
Table 3. Mass attenuation coefficient (μ/ρ) of the
samples
Specimens Observed
(cm2/g)
Calculated (cm2/g)
Non-doped SWCNT 0.518 0.515
Au@SWCNT 7.260 2.680
Here ρ and t are density of the material and the
thickness of the specimen for X-ray penetration,
respectively. The (μ/ρ) is the X-ray mass attenuation
coefficient [19]. We used specimen density as the material density. When the X-ray absorption property of the mixed solid follow the established law derived from
dipole transition approximation, the (μ/ρ) of the mixed
solid consisting of bi-components i and j is expressed by the linear relation of the x-ray mass attenuation coefficients of the components i and j together with component fraction of Ci and Cj as described in equation (3).
iCi
jCj (3)If we have data on Ci and Cj, (μ/ρ) can be evaluated using the established (μ/ρ) values of the components
atoms. This relation can be extended to a multicomponent-mixed solid by introduction of fraction of the fraction of each component.
The content of the metallic catalyst remained in SWCNT and the doped Au in Au@SWCNT were evaluated with thermal gravimetric analysis (TGA) while differential thermal analysis (DTA) was qualitatively used for approximating metal oxide species. As SWCNT was synthesized using 1.03 wt% of nickel and 0.26 wt% of yttrium catalysts according to Al-zubaidi et al. [12], the residual weights after burning of the SWCNT sample provide the fraction of the components.
Fig. 6 shows TGA and DTA profiles of non-doped SWCNT and Au@SWCNT under the flow of air of 350 mL/min at 3K/min. The weight loss of SWCNT begins at around 850 K, while Au@SWCNT loses weight at about 800 K. The weights of both samples become constant above 1100 K, giving the total weight of the metallic impurities. The residual weight of non-doped SWCNT is 0.57 wt%, which could be assigned to NiO and Y2O3. Hence, the x-ray mass attenuation
coefficient of Au-doped SWCNT can be calculated by using the residual amount of Au of 5.15 wt%.
Table 3 compares the observed (μ/ρ) with the
calculated one. The observed value of non-doped SWCNT of 0.518 cm2g-1 which is close to (μ/ρ) of highly oriented pyrolytic graphite of 0.576 ± 0.005 cm2/g [19] is slightly higher than the calculated value. However,
Au@SWCNT has a quite large (μ/ρ) value compared to
non-doped SWCNT. Interestingly, observed value of
Au@SWCNT is 2.7 times larger than the calculated (μ/ρ)
derived from the sample dipole-moment transition approximation.
Ret
ract
CONCLUSION
We have demonstrated enhanced X-ray absorption property of Au doped SWCNT. We found that the mass attenuation coefficient of SWCNT increased significantly of 5.2–fold due to Au nanoparticles doped in the nanotube. In addition, the upshift of G band of Raman spectroscopy suggested charge transfer from SWCNT to Au nanoparticles. The sequential acid treatment has significantly removed the remained catalyst and opened successfully the closed cap ends of the nanotube. Production of Au@SWCNT nano-composites would be promising and opening new avenue for fabricating protective electromagnetic radiation materials.
ACKNOWLEDGEMENT
The authors thank the Center for Energy and Environmental Science, Shinshu University-Japan for the research project. The authors deeply thank Professor Katsumi Kaneko for giving the great opportunity to study and research under his supervision at the Center for Energy and Environmental Science, Shinshu University-Japan. The authors thank Professor Morinobu Endo of Center for Energy and Environmental Science, Shinshu University-Japan for TEM, SEM and TGA equipment. The authors thank Professor K. Hata for supplying the SG-SWCNT. The authors thank Associate Professor Toshihiko Fujimori for his advices and intensive discussion of Raman spectroscopy and XRD theory. The authors thank Dr Daiki Minami for his great support of TEM observation. The authors thank Dr Ryusuke Futamura for his guidance of the XRD experiment. The authors thank Dr Fitri Khoerunnisa for her kindly experimental guidance and intensive discussion. The authors thank Dr H. Sakamoto, Dr Suwen Wang, Dr Fernando Vallejos Burgos, Radovan Kukobat and Li Xiaolin for their supports and advices.
REFERENCES
1. Liu, Z., Bai, G., Huang, Y., Ma, Y., Du, F., Li, F., Guo, T., and Chen, Y., 2007, Carbon. 45 (4), 821– 827.
2. Ye, Z., Deering, W.D., Krokhin, A., and Roberts, J.A., 2006, Phys. Rev. B: Condens. Matter, 74 (7), 075425.
3. Yang, Y., Gupta, M.C., Dudley, K.L., and Lawrence, R.W., 2005,Nano. Lett., 5 (11), 2131–2134.
4. Higginbotham, A.L., Moloney, P.G., Waid, M.C., Duque, J.G., Kittrell, C., Schmidt, H.K., Stephenson,
J.J., Arepalli, S., Yowell, L.L., and Tour, J.M., 2008, Compos. Sci. Technol., 68 (15-16), 3087–3092. 5. Imholt, T.J., Dyke, C.A., Hasslacher, B., Perez,
J.M., Price, D.W., Roberts J.A., Scott, A., Wadhawan, J.B., Ye, Z., and Tour, J.M., 2003, Chem. Mater., 15 (21), 3969–3970.
6. Kumar, M., and Yoshinori, A., 2010, J. Nanosci. Nanotechnol., 10 (6), 3739–3758.
7. Balasubramanian, K., and Burghard, M., 2005, Small, 1 (2), 180–192.
8. Grimes, C.A., Mungle, C., Kouzoudis, D., Fang, S., and Eklund, P.C., 2000,Chem. Phys. Lett., 319 (5-6), 460–464.
9. Wen, F., Zhang, F., and Liu, Z., 2011, J. Phys. Chem. C, 115 (29), 14025–14030.
10. Fujimori, T., Tsuruoka, S., Fugetsu, B., Maruyama, S., Tanioka, A., Terrones, M., Dresselhaus, M.S., Endo, M., and Kaneko, K., 2011,Mater. Express, 1 (4), 273–277.
11. Fujikawa, T., and Kaneko, K., 2012, J. Electron. Spectrosc. Relat. Phenom., 185 (11), 509–511. 12. Al-zubaidi, A., Inoue, T., Matsushita, T., Ishii, Y.,
Hashimoto, T., and Kawasaki, S., 2012, J. Phys. Chem. C, 116 (12), 7681−7686.
13. Jorio, A., Pimenta, M. A., Filho, A.G.S., Saito, R., Dresselhaus, G., and Dresselhaus, M.S., 2003, New J. Phys., 5 (1), 139.1–139.17.
14. Eliseev, A.A., Yashina, L.V., Brzhezinskaya, M.M., Chernysheva, M.V., Kharlamova, M.V., Verbitsky, N.I., Lukashin, A.V., Kiselev, N.A., Kumskov, A.S., Zakalyuhin, R.M., Hutchison, J.L., Freitag, B., and Vinogradov, A.S., 2010, Carbon, 48 (10), 2708– 2721.
15. Corio, P., Santos, A.P., Santos, P.S., Temperini, M.L.A., Brar, V.W., Pimenta, M.A., and Dresselhaus, M.S., 2004, Chem. Phys. Lett., 383 (5-6), 475–480.
16. Dresselhaus, M.S., Dresselhaus, G., Jorio, A., Filho, A.G.S., and Saito, R., 2002,Carbon, 40 (12), 2043–2061.
17. Ding, K., Yang, H., Wang, Y., and Guo, Z., 2012, Int. J. Electrochem. Sci., 7, 4663–4672.
18. Sirajuddin, Mechler, A., Torriero, A.A.J., Nafady, A., Lee, C-Y., Bond, A.M., O’Mullane, A.P., Bhargava, S.K., 2010, Colloids Surf., A, 370, 35– 41.
19. Hubbel, J.H., and Seltzer, S.M., 2004,Table of X-ray mass attenuation coefficient Mass Energy-Absorption coefficient from 1 keV to 20 MeV for elements Z = 1 to 92 and 48 additional substances of dosimetric Interest, NIST Standard Data Base 126, NIST, Gaithersburg, MD.