INTRODUCTION
Nepal is an independent, sovereign, landlocked, mountainous and one of the least developing countries with the target to graduate from the least developed to developing country by 2022. According to sustainable development goals (SDGs), the irst goal is about the poverty eradication in the country by 2030 [1].
Agriculture is the mainstay of the Nepalese economy, providing a livelihood for more than two-third of the population and contributing one-third of GDP [2]. Government efforts have been towards increasing food production with farmers' employment and
income for poverty reduction, and food security in the country. In this context, national and international development organizations have been working for more than decades. Among them, the international development enterprises (IDE Nepal) has developed a market-oriented intervention designing approach called the PRISM (Prosperity Realization through Irrigation and Smallholder Markets), which supports to create sustainable opportunities through market-oriented interventions, i.e. creating networks of small enterprises to provide agricultural supplies needed by the poor farmers, working with these farmers to improve their small-farm productivity, and linking them to markets their small-farm produce [3]. The PRISM projects were implemented by IDE Nepal both
in hills and the Terai district of Nepal and traditional farming converted to commercial farming with the collaboration of different stakeholders, such as input suppliers, who provided the necessary inputs to the vegetable farmers; the farmers received agri-inputs, technical know-how and other required services, like irrigation technologies, inances/funds for investment on vegetable production, and the output traders for selling their produce. The output traders market small farmers' farm produce at local,
Impact of PRISM Approach on Input Supply, Production and Produce
Marketing of Commercial Vegetable Farming in Kaski and Kapilvastu
District of Western Nepal
Bhimsen Gurung
1*, Punya Prasad Regmi
2, Resham Bahadur Thapa
2, Durga Mani Gautam
2, Ganesh
Man Gurung
3and Krishna Bahadur Karki
41
Agricultural Economic, IAAS, TU, Nepal
2Professor, IAAS, TU, Nepal
3
Central Department of Sociology, TU, Nepal
4Retired Chief Soil Scientist, NARC, Khumaltar, Nepal
Research Article
ABSTRACT
regional, national and international levels [4]. Therefore, the present study was conducted to assess the impact of vegetable
sub-sector before and after the vegetable program through the PRISM approach especially in input supply, production and output marketing.
MATERIALS AND METHODS
The study was conducted in two randomly selected districts, which represented different ecological regions, i.e. Kaski in hills and Kapilavastu in Terai in the Western Development Regions of Nepal. In Kaski district, there were 96 groups with 1846 households, of which 15 farmers’ groups with 105 household head (7 from each group). Similarly, in Kapilvastu there were 168 groups with 3433 households, of which 24 groups with 168 household head were randomly selected for the interview. Random table number was used for the selection of districts, groups and household heads. Sample households were interviewed with pre-tested and improved questionnaires. Information was collected on inputs and technology availability, irrigation management, crop husbandry and post-harvest marketing, which was based on memory power of the respondents. The six point Likert-type scales were used for each statement to measure improvement on input supply, production and output marketing of various agricultural activities. The score given in the scale were: 1=Very poor, 2=Poor, 3=Averages, 4=Good, 5=Very Good and 6=Excellent.
The data were analyzed using the statistical package for the social sciences (SPSS). The descriptive statistical tools, such as means, mode, frequencies, percentage and inferential statistics such as t -test and regression analysis were used for data analyses. The Likert-type scaling was used to express various degrees of opinion and perception of the respondents. Then, conditions or situations on different aspects of the vegetable farming through the PRISM approach pre- and post-project periods were compared. As PRISM projects were in operation since a decade, comparisons of before and after ten years were made. Hence, transformations/positive changes brought about by the PRISM project were noted and inferences drawn based on these comparisons.
RESULTS AND DISCUSSION
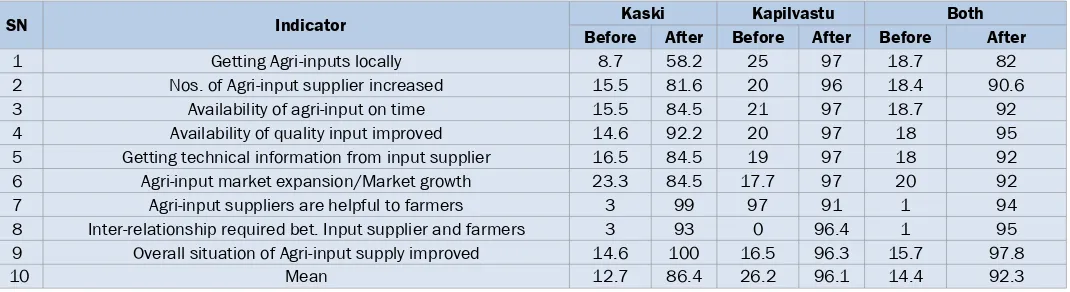
Input Supply SituationThe study showed a positive impact in all the nine indicators in Kaski, Kapilvastu and both districts together in the area of input supply (Table 1). The positive responses increased in both districts, after the project intervention. The project beneitted
poor farmers directly by increasing their production; beneitted small farmers and landless laborers through higher employment, lowered food prices and opened better opportunities for the poor; beneitted the rural and urban poor through growth in the rural and urban non-farm economy; led to access to crops that were high in nutrients; empowered the poor by increasing their access to decision-making processes, increasing their capacity for collective action, and reducing their vulnerability to shocks via asset accumulation.
SN Indicator Kaski Kapilvastu Both
Before After Before After Before After
1 Getting Agri-inputs locally 8.7 58.2 25 97 18.7 82
2 Nos. of Agri-input supplier increased 15.5 81.6 20 96 18.4 90.6
3 Availability of agri-input on time 15.5 84.5 21 97 18.7 92
4 Availability of quality input improved 14.6 92.2 20 97 18 95
5 Getting technical information from input supplier 16.5 84.5 19 97 18 92
6 Agri-input market expansion/Market growth 23.3 84.5 17.7 97 20 92
7 Agri-input suppliers are helpful to farmers 3 99 97 91 1 94
8 Inter-relationship required bet. Input supplier and farmers 3 93 0 96.4 1 95
9 Overall situation of Agri-input supply improved 14.6 100 16.5 96.3 15.7 97.8
10 Mean 12.7 86.4 26.2 96.1 14.4 92.3
Table 1. Perception of respondents in agricultural input supply in Kaski and Kapilvastu districts.
Farmers travelled long distance to buy agri-inputs before the project, because there were very few agro-vets to supply inputs. The situation of the supply and suppliers was better after the project. On an average, the situation of input supply was better in Kapilvastu (26.2%) before the project as compared to Kaski (12.7%) and the result was quite higher after the project in Kapilvastu (96.1%). Both together, the inding revealed that there was tremendous improvement in the area of input supply. The inding shows that 92.3% of respondents replied better situation in the area of input supply.
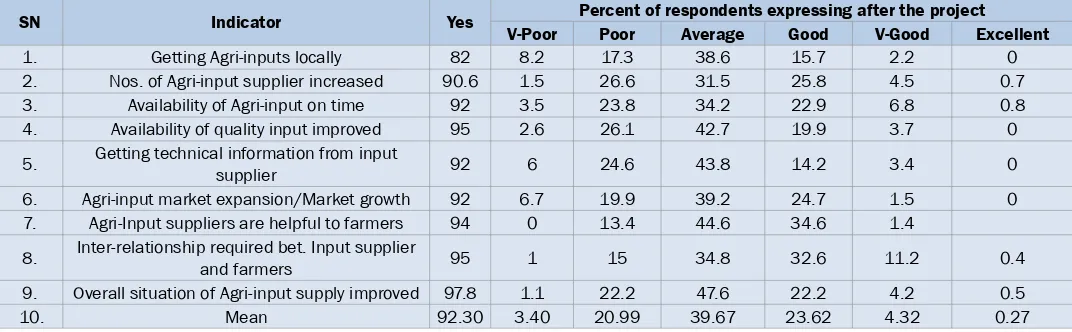
The beneit obtained and the area of improvement received by the respondents is given in Table 2 for both districts. The average positive respondents of nine indicators were 92.27%. On an average, the scale of beneit received in both the districts by respondents ranged from very poor (3.4%) to excellent (0.27%) and mostly in the range of average to good (Table 2).
SN Indicator Yes Percent of respondents expressing after the project V-Poor Poor Average Good V-Good Excellent
1. Getting Agri-inputs locally 82 8.2 17.3 38.6 15.7 2.2 0
2. Nos. of Agri-input supplier increased 90.6 1.5 26.6 31.5 25.8 4.5 0.7
3. Availability of Agri-input on time 92 3.5 23.8 34.2 22.9 6.8 0.8
4. Availability of quality input improved 95 2.6 26.1 42.7 19.9 3.7 0
5. Getting technical information from input supplier 92 6 24.6 43.8 14.2 3.4 0
6. Agri-input market expansion/Market growth 92 6.7 19.9 39.2 24.7 1.5 0
7. Agri-Input suppliers are helpful to farmers 94 0 13.4 44.6 34.6 1.4
8. Inter-relationship required bet. Input supplier
and farmers 95 1 15 34.8 32.6 11.2 0.4
9. Overall situation of Agri-input supply improved 97.8 1.1 22.2 47.6 22.2 4.2 0.5
10. Mean 92.30 3.40 20.99 39.67 23.62 4.32 0.27
Table 2. Perceived beneits in the area of agricultural input supply in Kaski and Kapilvastu districts.
Such networking combined with leadership is an indispensable kind of social network not only necessary to properly run the business or project, but also to differentiate the business from similar projects [5]. The SME in developing countries usually suffer from market failures due to lack of formal institutions in the long-term business relationships. Policy interventions is imperative to improve the platform for relation-based governance mechanisms and to address the exclusionary effects of strong networks
[6]. Generally, the development of SMEs is seen as an accelerating factor for achievement of wider economic and socio-economic
objectives, including poverty alleviation.
Access to irrigation water and improving farm productivity is vital to farmers for increasing cropping area, crop production, incomes and their household food security. A new spectrum of drip irrigation systems to different income levels and farm sizes aimed speciically at the poor farmers in developing countries, which is widely used in [7]. This irrigation system was widely used
by the vegetable growers of Kaski and Kapilvastu districts that increased production, productivity and household income of the farmers.
Accessibility of agricultural inputs and outputs for an individual farmer is very dificult and expensive. If the marketing organized in network, information sharing/communication as well as forming cooperatives is less expensive and inputs are available in time [8]. Due to unavailability of necessary inputs on time, Nepalese farmers have shifted to other alternatives, such
as farming through the use of local resources [9]. Vegetable Production Situation
Participation in decision making and group formulation
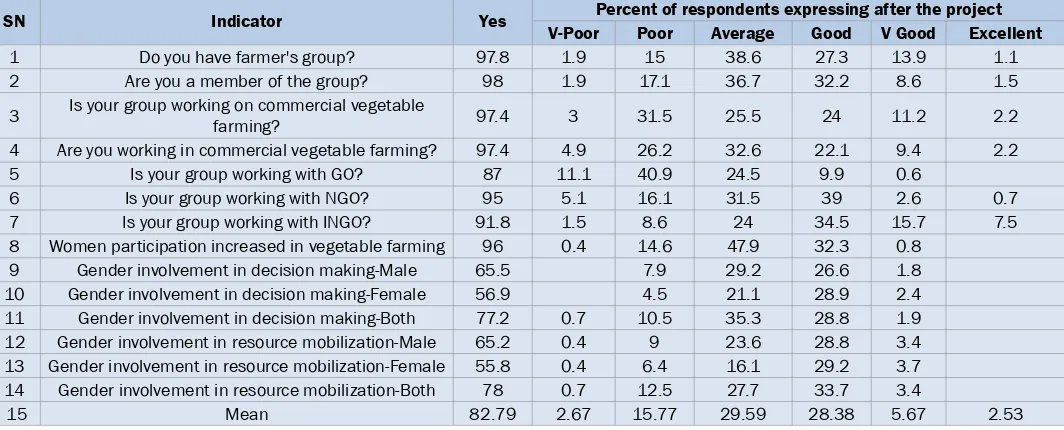
Table 3 indicates that about 5% of respondents gave positive response before the PRISM project, while it increased to 83%
after the project. Very low percentage (3%) of the farmers received very poor services and 16% were poorly beneited from the project. The rest of the farmers (64%) were between average and above in receiving beneits (Table 4). The beneits were mostly in terms of women participation, group formation and decision making in relation to vegetable production. Hence, collective action through farmer groups is an important strategy for smallholders to compete in rapidly changing markets. When participated in group, each member was positively inluenced for participation in group meetings and collective marketing. Farmers participation in groups have been found beneicial in several aspects including socio-economic aspect [10,11].
Table 3. Perception of respondents on vegetable farm production in terms of participation in program and decision making in both the district in percent.
SN Indicator
Kaski Kapilvastu Both
Before After Before After Before After
Yes Yes Yes Yes Yes Yes
1 Do you have farmer's group? 5 100 0.6 96.4 2.2 97.8
2 Are you a member of the group? 5 100 0 97 2 98
3 Is your group working on commercial vegetable farming? 1 100 0.6 95.7 0.7 97.4
4 Are you working in commercial vegetable farming? 2 99 0 96.3 0.7 97.4
5 Is your group working with GO? 5.8 85.4 12.2 88 9.8 87
6 Is your group working with NGO? 4 93.2 8 96 6 95
7 Is your group working with INGO? 1 84.5 1.3 96.4 1.1 91.8
8 Women participation increased in vegetable farming 42.7 100 17.7 94 27.3 96
9 Gender involvement in decision making-Male 6.8 58.3 0.6 70.1 3.4 65.5
10 Gender involvement in decision making-Female 9.7 58.2 0 56 3.7 56.9
11 Gender involvement in decision making-Both 6.8 67 0.6 84 3 77.2
13 Gender involvement in resource mobilization-Female 8.7 55.3 1.8 56.1 4.5 55.8
14 Gender involvement in resource mobilization-Both 7.7 68 1.8 84.1 4 78
15 Mean 8.00 80.37 3.36 84.34 5.13 82.79
SN Indicator Yes Percent of respondents expressing after the project
V-Poor Poor Average Good V Good Excellent
1 Do you have farmer's group? 97.8 1.9 15 38.6 27.3 13.9 1.1
2 Are you a member of the group? 98 1.9 17.1 36.7 32.2 8.6 1.5
3 Is your group working on commercial vegetable
farming? 97.4 3 31.5 25.5 24 11.2 2.2
4 Are you working in commercial vegetable farming? 97.4 4.9 26.2 32.6 22.1 9.4 2.2
5 Is your group working with GO? 87 11.1 40.9 24.5 9.9 0.6
6 Is your group working with NGO? 95 5.1 16.1 31.5 39 2.6 0.7
7 Is your group working with INGO? 91.8 1.5 8.6 24 34.5 15.7 7.5
8 Women participation increased in vegetable farming 96 0.4 14.6 47.9 32.3 0.8
9 Gender involvement in decision making-Male 65.5 7.9 29.2 26.6 1.8
10 Gender involvement in decision making-Female 56.9 4.5 21.1 28.9 2.4
11 Gender involvement in decision making-Both 77.2 0.7 10.5 35.3 28.8 1.9
12 Gender involvement in resource mobilization-Male 65.2 0.4 9 23.6 28.8 3.4
13 Gender involvement in resource mobilization-Female 55.8 0.4 6.4 16.1 29.2 3.7
14 Gender involvement in resource mobilization-Both 78 0.7 12.5 27.7 33.7 3.4
15 Mean 82.79 2.67 15.77 29.59 28.38 5.67 2.53
Table 4. Perceived beneit on vegetable farm production in terms of participation in program and decision making (%) in both districts.
Services provided for vegetable farming
Before the PRISM project, nearly 10% of the participating farmers were getting services from the service providers in commercial vegetable farming, which increased to 93% after the project in both the districts (Table 5). Almost all the respondents (>96%) were satisied with the services they were getting from the project, which was found to be more effective from the point of enhancing farm production. Farmers ield school is one of the successful example in Nepal [12]. Similar success stories are
common in Africa and other African countries [13-15]. Therefore, it is easy to support the farmers through the service providers to enhance the farm production.
SN Indicator
Kaski Kapilvastu Both
Before After Before After Before After
Yes Yes Yes Yes Yes Yes
1 Did you see the good market opportunity of vegetables 49.5 100 17 96.3 29.6 97.8
2 Are you getting regular technical support and services for the successful
cultivation of commercial vegetable farming? 0 95 2.4 97 1.5 96.3
3 Technical support provided by IDE staff 2 99 1.3 90.2 1.5 93.6
4 Technical support provided by JT/JTA 15.5 80.6 14.7 81 15 81
5 Technical support provided by NGO staff 2 89 8.5 95.7 6 93.3
6 If you are willing to get the technical and non-technical services on fee basis,
is it available at local level? 3 97 0 85.4 1 90
7 Access to fund/capital /credit 42.7 99 22 91.5 30 94.4
8
Intervention for addressing the constraints of input traders, vegetable producers and output traders are required for the growth and development
of whole vegetable subsector
0 100 0 96.3 0 97.8
9 You and your group members are making good proit from the commercial
vegetable farming 4 97 0 96.5 1.5 96.6
10 Mean 13.19 95.18 7.32 92.21 9.57 93.42
Table 5. Perception of respondents in relation to services obtained on vegetable farm production (%) in both districts.
The beneit received by the respondents expressed at different level for both the districts are presented in Table 6. The situation was improved after the project as replied by 93% of the respondents. Further, over two-third (67%) of the respondents expressed that the services received were at more than average level, while 26% of respondents expressed that the services were poor and at the lower level.
Adoption of vegetable farming technology
SN Indicator Yes Percent of respondents expressing after the project V-Poor Poor Average Good V Good Excellent
1 Did you see the good market opportunity of vegetables 97.8 1 17.1 31.5 32.6 10 5.6
2 Are you getting regular technical support and services for the
successful cultivation of commercial vegetable farming? 96.3 5.2 27.3 33 20.6 10.2 0
3 Technical support provided by IDE staff 93.6 0 13.1 15.6 41.1 17.1 6.7
4 Technical support provided by JT/JTA 81 12.8 33.5 23.7 9.8 1.2
5 Technical support provided by NGO staff 93.3 5.6 18 26.4 30.4 11.4 1.5
6 If you are willing to get the technical and non-technical services
on fee basis, is it available at local level? 90 4.9 25.5 45.8 12.5 0.8 0.5
7 Access to fund/capital/credit 94.4 2.6 25.5 46.1 20.2
8
Intervention for addressing the constraints of input traders, vegetable producers and output traders are required for the
growth and development of whole vegetable subsector
97.8 0.7 23.3 41.9 29.6 1.2 1.1
9 You and your group members are making good proit from the
commercial vegetable farming 96.6 4.1 18 34.8 34.1 5.6
10 Mean 93.4 4.1 22.4 33.2 25.66 7.19 2.57
Table 6. Perceived beneit in relation to services obtained on vegetable farm production (%) in both districts.
Growing off-season vegetables and fruits mean improving the diet and increasing the household income. The tunnel technology offered good environment to vegetables crops both in summer and in winter with maximum crop yields, maintenance of the fertility and water conservation, controlled temperature and humidity, protection from wild animals and insects. Crops, such as cucumber, capsicum, tomato, pepper, bitter gourds, melons, brinjal (egg plant) and watermelon were highly valued vegetables that showed signiicant increase in yield when grown in tunnel farming. Thus, farmers were encouraged to grow off-season vegetables.
In this study, the farmers were supported with suitable crop varieties, training, plastic house, and irrigation technology, IPM, harvesting and handling the products, which helped them in commercial vegetables farming (Tables 7 and 8). Before the project in both the districts, less than 2% of respondents received improved vegetable farming technology, while over 85% of the respondents beneitted with improved vegetable farming technology after the project.
SN Indicator
Kaski Kapilvastu Both
Before After Before After Before After
Yes Yes Yes Yes Yes Yes
1 Are you getting the basic technical training on commercial vegetable farming? 2 99 3.7 97 3 97.8
2 Do you use suitable varieties for the production of off season vegetable? 6.8 96 0.6 97 3 96.6
3 Do you use plastic house/tunnel for the production of off season vegetable
farming? 2 54.4 0 31.8 0.7 40.4
4 Do you use low cost irrigation technologies such as Drip/TP/micro-sprinkler
for the production of off season vegetable farming? 0 100 0.6 98.2 0.4 97.4
5 Do you use IPM technologies for the production of off season vegetable farming? 1 72.8 0 68.3 0.4 70
6 Do you use different harvesting technologies such as cleaning, sorting,
grading and standardization for the production of off season vegetable? 1 99 0 76.3 0.4 85
7 Is the situation of successful vegetable production improved or better? 5.8 100 0.7 96.3 2.6 97.8
8 Overall situation in total vegetable production improved? 11.7 100 0 95.7 4.5 97.4
9 Mean 3.79 90.15 0.7 82.58 1.88 85.30
Table 7. Perception of respondents in relation to technology used on vegetable farm production (%) in both districts.
Table 8. Perceived beneit in terms of technology used in both district in percent.
SN Indicator Yes Percent of respondents expressing after the project
V-Poor Poor Average Good V-Good Excellent
1 Are you getting the basic technical training on commercial
vegetable farming? 97.8 3.4 17.6 49.8 24.4 2.2 0.4
2 Do you use suitable varieties for the production of off season
vegetable? 96.6 3.3 29.1 39.2 24 1
3 Do you use plastic house/tunnel for the production of off season
vegetable farming? 40.4 2.4 9.1 12.6 15.8 0.5
4 Do you use low cost irrigation technologies such as
Drip/TP/micro-sprinkler for the production of off season vegetable farming? 97.4 0.7 16.5 35.6 31.5 13.1 0
6
Do you use different harvesting technologies such as cleaning, sorting, grading and standardization for the production of off
season vegetable?
85 0.4 26.2 29.2 21.7 7.5
7 Is the situation of successful vegetable production improved or
better? 97.8 1.5 29.6 37.8 23.4 4.5 1
8 Overall situation in total vegetable production improved? 97.4 1.9 19.5 36.7 27.7 10.5 1.1
9 Mean 85.30 1.83 21.45 34.99 21.81 4.91 0.63
The perceived technological beneits and their scale are given in Table 8. It indicated that about 32% and 25% of respondents
were at the level of average and good receivers of technology, respectively. About 23% farmers were poor and less beneitted with the technologies that were disseminated through the project. Such types of success stories are also common elsewhere in the world [16,17].
Irrigation management was another important aspect of vegetables production whether in open ield as seasonal crops or under tunnels as off-season crops. In water shortage areas, the best way of irrigation was drip/Treadle Pump/micro-sprinklers irrigation [18]. These irrigation methods improved the water use eficiency and fertilizers applied though drips offered splits of
fertilizers, even including micro-nutrients at the initial growth periods. The PRISM project helped farmers in its command areas to avail these materials through local entrepreneurs. Hence after the project, the farmers relied on technology, such as irrigation materials, IPM technology, post-harvest cleaning, sorting, grading and standardization for the production of off-season vegetables. There were different organizations involved in supporting with technical staffs to transfer the technology and help the farmers, such as JT/JTA, IDE staffs, and NGOs. In some instances, farmers also paid for the service provided by the technicians in both the districts, where 100% farmers were ready to pay the fees for the technical support. In the PRISM command project area, farmers cooperated to each other and worked with governmental and non-governmental agencies for technology transfer in commercial vegetable production.
Transmission of technology constituted a major source of productivity growth for intervention and addressing the constraints of input traders, vegetable producers and output traders as required for the growth and development of whole vegetable sub-sector. During the adaptation of new technology, shortfalls and constraints were addressed immediately for their solutions. In this regards, information from the farmers were collected if the intervention for addressing the constraints of input traders, vegetable producers and output traders were required for the growth and development of whole vegetable sub-sector; both the districts farmers gave positive response in this regards. Involvement of women in farming is a tradition in the Nepalese community, which is an age old practice. Ploughing and heavy works was generally performed by the male members of the family and light works, such as planting, weeding, harvesting, grading and sorting were generally carried by the women farmers. In this program, the women participation was 100% in Kaski and 94% in Kapilvastu in vegetable farming after the project. Then decision making and resources mobilization in vegetables farming was done both by male and female members of the family.
The vegetable sector has an immense poverty reduction potential in Nepal because of high, unmet domestic demand and the potential for net import substitution from neighboring countries, especially India [19]. This sector also has high potential to
beneit disadvantaged communities. However, the vegetable sub-sector is constrained by low adoption rate of high quality seeds; lack of access to and informed choice of the use of other inputs, such as agro-chemicals; highly informal and fragmented trade in inputs and produce, and limited collection of vegetables at local level. To address these constraints, the PRISM worked to improve the functioning of the inputs market by stimulating demand and supply of high quality seeds and other inputs, and facilitated private sector investment in organized way for marketing of produces. In the study areas, the small vegetable farmers earned annually net NRs. 25241 in Kaski and NRs. 20425 in Kapilvastu per household, which is quite high and that helped the farmers having suficient money to send their children to better school, take care of their health and even purchase luxury household items
[1]. also, presented similar picture following off-season vegetable production and market linkages [20-22]. Similar activities are also
run by MEDEP (2011) and other agencies working in vegetables farming especially tunnel farming in Nepal and in entrepreneur development by FAO for sustainable development.
Vegetable Marketing
There were nine indicators of agricultural product marketing and perception of the respondents as given in Table 9. The result shows that the agricultural product marketing was a bit better in Kaski district as compared to Kapilvastu district before the PRISM project. Around 87% of respondents in Kaski and 96% of respondents in Kapilvastu had no access to agricultural produce marketing. The situation changed remarkably after the project, i.e. almost 94% of respondents had access to agricultural product marketing services.
Earlier to the PRISM project, the farmers were not organized in groups; afterwards, all farmers were organized in groups, and turned to a commercial vegetable farming. Before the project, 8% farmers in both districts responded having market access but after the project 94% respondents of both districts replied good access to market their produce (Table 9).
SN Indicator
Kaski Kapilvastu Both
Before After Before After Before After
1 You and your group is producing veg. as per market demand? 7.8 97.1 3.6 97 5 97
2 Are you able to sell all your vegetable? 23.3 99 1.2 96.4 9.7 97.4
3 Do you sell your vegetable by yourself & your family? 27.2 98 0 97 10.4 97.4
4 Are there suficient traders to buy your vegetable? 12.6 89 1.8 97 6.7 94
5 Is there a vegetable collection center? 4.8 70 15.9 97 11.6 86.5
6 Is trader coming to your farm to buy your produce? 9.7 82.6 0 84 3.7 83.6
7 Do you think traders are helpful to make your farming business
successful? 3 100 0 96.3 1 97.8
8 Is marketing situation for selling of your produce improved? 18.4 100 13.5 95.7 15.4 97.4
9 Do you think a trader is important to expand your farming business? 13.6 89.4 2.4 97 6.7 94
10 Mean 13.4 91.7 4.27 95.3 7.8 93.9
Table 9. Perception of respondents in percent on agricultural product marketing.
SN Indicator Yes Percent of respondents expressing after the project
V-Poor Poor Average Good V-Good Excellent
1. You and your group is producing veg. as per market
demand? 97 3 18 41 34 1 0
2. Are you able to sell all your vegetable? 97.4 1.5 23.2 28.5 27.7 14.6 1.9
3. Do you sell your vegetable by yourself & your family? 97.4 4.1 15.4 36.3 35.6 6 0
4. Are there suficient traders to buy your vegetable? 94 7.9 21.3 40.1 21 3.7 0
5. Is there a vegetable collection center? 86.5 2.2 25.8 40.1 16.9 1.5 0
6. Is trader coming to your farm to buy your produce? 83.6 5.6 36 30 10.1 1.9 0
7. Do you think trader is helpful to make your farming
business successful? 97.8 1.1 17.6 41.2 34.5 3.4 0
8. Is marketing situation for selling of your produce
improved? 97.4 2.2 21 35.6 31.8 6.4 0.4
9. Do you think a trader is important to expand your
farming business? 94 7.9 21.3 40.1 21 3.7 0
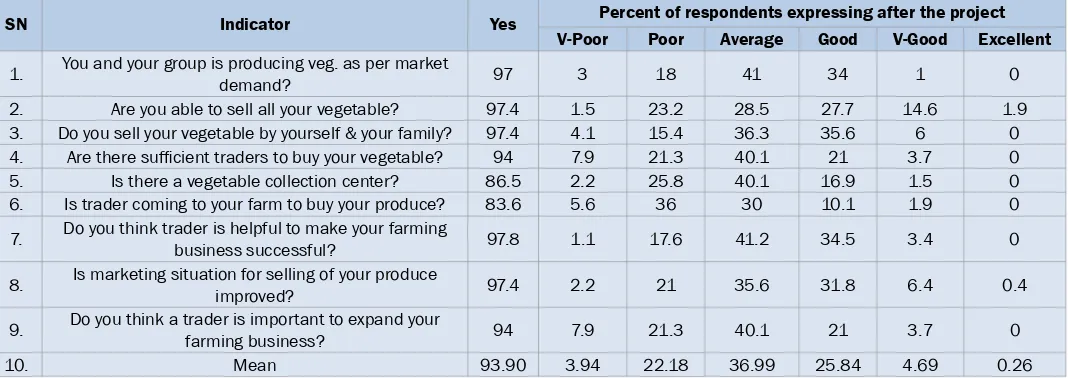
10. Mean 93.90 3.94 22.18 36.99 25.84 4.69 0.26
Table 10. Perceived beneit on agricultural product marketing (%) in Kaski and Kapilvastu districts.
Well organized marketing promotes effective vegetable production and sales [23]. Relevant stakeholders were involved to
analyze the challenges of market access for safe vegetables marketing. The main leverage points for systemic interventions include: awareness rising for all parties concerned, organized production in groups for reduced input costs, addressing consumer demands, market actor linkages and quality control. The participatory approach created a co-learning environment where participating members can share their views, concerns and learn from other throughout the discussion and decision making processes. This types of organized market in increasing farmer’s income is also implemented in Vietnam [24]. Access to markets
for agricultural products is a primary concern to increase income and improve the livelihoods of all farming households in Nepal. Demand and supply also governs the agricultural production and marketing. Information collected from the farmers of their produce was not according to the consumers’ demand because earlier to the project, demand aspect of agricultural production was not considered but after the project, 97% of the respondents in both districts were well aware of the demand and their production. The farmers were able to sell their produce by themselves easily. Over 90% of the farmers claimed that they brought traders at their farm gate to buy their produce. The producers had better access to the collection centers and the retailer/ wholesaler came to the collection centers.
Getting the farmers around the negotiating table with buyers is a rewarding challenge. To enter the market and trade with commercial entities, farmers needed to become a legal entity, and consequently they have to organize themselves in associations. This is one way of facilitating the creation of farmers’ association, organized marketing committees and equipped farmers to conduct market research and develop market linkages [25]. By doing this, the farmers got support through marketing, production specialists and supervisors, who provided continuous technical assistance in vegetable farming. The associations now are supported by a marketing committee responsible for coordinating production and marketing activities.
The farmers are organized in a group of 15 to 20 members. They have their own contact person who collects and transmits the information to other members of the groups. The main group is registered with the District Agricultural Development Ofice. By doing so the group has the legal identity. This types of organization is found in many countries [26]. These groups collect their
products in the collection centers and the traders come and negotiate product price themselves. The groups also have the information collected from the consumers prices from the vegetable marketing centers at the grass root levels [27,28]. They also
Nepal, mostly women farmers are the members of groups in Australia with emphasis in gender aspect in grouping [29]. It is well
recognized, however, that market participation is crucial for farm households to ensure a low of cash income, leading to poverty alleviation and improved livelihoods. Thus, it is meaningful to understand what factors affect farm households' decision to sell food crops, which is important for strengthening their linkages with markets [28].
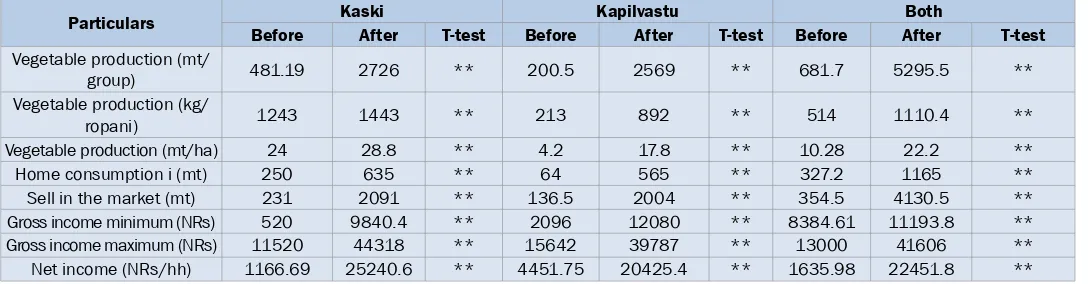
Impact on Production, Consumption and Net Return
Total production, consumption and net-return received by the respondents from vegetable growing in Kaski and Kapilvastu districts are presented in Table 11. The increase in production, consumption, sale, gross and net income of vegetables farming in surveyed area over the period of ten years was highly signiicant.
Particulars Kaski Kapilvastu Both
Before After T-test Before After T-test Before After T-test Vegetable production (mt/
group) 481.19 2726 ** 200.5 2569 ** 681.7 5295.5 **
Vegetable production (kg/
ropani) 1243 1443 ** 213 892 ** 514 1110.4 **
Vegetable production (mt/ha) 24 28.8 ** 4.2 17.8 ** 10.28 22.2 **
Home consumption i (mt) 250 635 ** 64 565 ** 327.2 1165 **
Sell in the market (mt) 231 2091 ** 136.5 2004 ** 354.5 4130.5 **
Gross income minimum (NRs) 520 9840.4 ** 2096 12080 ** 8384.61 11193.8 **
Gross income maximum (NRs) 11520 44318 ** 15642 39787 ** 13000 41606 **
Net income (NRs/hh) 1166.69 25240.6 ** 4451.75 20425.4 ** 1635.98 22451.8 **
Table 11. Total production, consumption and net-return received by the respondents from vegetable growing in Kaski and Kapilvastu districts.
It was about 6 times increase in Kaski and 12 times in Kapilvastu. The productivity of vegetables increased from 24 mt to 28.8 mt in Kaski and 4.2 mt to 17.8 mt in Kapilvastu over the project period of ten years. Both together, increase in productivity was 10.28 mt to 22.2 mt per ha over the project period. Before ten years, on an average, about 48% of vegetable produced was consumed while only 22% of vegetable produced was consumed after ten years indicating that about 78% of vegetable produced was sold at the market. The consumption of vegetables was higher in Kaski as compared to Kapilvastu. Over the period of ten years time, the net income increased per household from the sale of vegetable was NRs. 1166 to NRs. 25240. and from NRs. 4451 to NRs. 20425 in Kaski and Kapilvastu, respectively. On an average, the net increase in household income of the surveyed area from the sale of vegetable was NRs. 1635 to NRs. 22451 (Table 11).
Regression analysis was performed on the vegetable production as contributing results of winter plus summer vegetables farming and labor utilization, thereby diversifying different kinds of vegetables during winter and summer seasons, with labor employment opportunity (both farm and hired labors) during vegetable growing and sale of the produce in the market through cooperative management. The analysis of variance and the multiple regressed F-values pooled of both districts are shown in Tables 12 and 13. It was highly signiicant (p<0.01). This explained nearly 2/3rd of the vegetable production contributed by the seasonal vegetable growing farm plus hired labors (R2= 64.55) working on the farm.
df SS MS F Signiicance F
Regression 2 5.54E+14 2.77E+14 245.83 1.57E-61
Residual 270 3.04E+14 1.13E+12
Total 272 8.59E+14
Table 12. Analysis of Variance for regression.
Coeficients SE t Stat P-value Lower 95% Upper 95%
Intercept (Y=Production) -329977.28 99185.59 -3.33 0.00 -525252.78 -134701.78
X Variable 1 (W+S VF) 556.70 25.41 21.91 0.00 506.67 606.73
X Variable 2 (Labour) 5002.34 1568.53 3.19 0.00 1914.23 8090.44
*W=Winter, S= Summer, VF=Vegetable farming
Multiple R=0.8034, R Square=0.6455, Adjusted R Square=0.6428, N=273.
Table 13. Coeficient estimate of multiple regression.
CONCLUSIONS
The project mainly intervened in networking of agricultural supplies to facilitate the small farmers and increase production and productivity. After the production increased, marketing channel was developed, where traders directly contacted the growers on their ield and commodity price was ixed. This project played facilitating role to all the actors involved in input supply, production and marketing of the farm produce. Comparing the input supply, production, and marketing situations before and after the project, there was a tremendous improvement in this area showing the positive impact of the PRISM model.
were 92%, over 82% and 94% improvement, respectively. Therefore, the PRISM can be taken as market led approach that helps analyze all the actors involved, their relationship and all the factors related to commercial vegetable and the success of the PRISM approach needs to be extended in the country for commercial vegetable farming and poverty reduction. Agricultural production policy should be market oriented making all the stakeholders equally responsible and capable of delivering services for input supply, production technologies and output marketing, for which linkage with middlemen and other marketing agents should be well established and farmers should be trained to market their product eficiently.
ACKNOWLEDGEMENTS
Thanks, are due to the IDE-International, NGO, Denver, USA that prepared the detailed PRISM Manual for PRISM application in different IDE program countries across the world. Appreciation goes to respondents of Kapilvastu and Kaski districts who provided information during the ield survey. The authors are highly grateful to those organizations and institutions that provided invaluable suggestions and information to make the study a success.
REFERENCES
1. Upadhyaya HK. Sustainable poverty alleviation and mountain development in Nepal: Status, experience and strategy. Growth, poverty alleviation and sustainable resource management in the mountain areas of South Asia. 2000;195. 2. Branisa B, et al. The institutional basis of gender inequality: The social institutions and gender index (SIGI). Fem Eco.
2014;20:29-64.
3. IDE. Guidelines for developing and implementing poverty reduction through irrigation and smallholder markets (PRISM) programs. EDS Enterprises, Denver, Colorado. 2005;30.
4. Nepal R and Thapa GB. Determinants of agricultural commercialization and mechanization in the hinterland of a city in Nepal. Appl Geogr. 2009;29:377-389.
5. Johannisson B and Nilsson A. Community entrepreneurs: Networking for local development. Entrepreneurship and Regional Development. 1989;1:3-19.
6. Biggs T and Shah MK. African small and medium enterprises, networks, and manufacturing performance. World Bank Policy Research Working Paper. 2006;3855.
7. Postel S, et al. Drip irrigation for small farmers. Water International. 2001;26:3-13.
8. Thapa P. Comparative study on market access of smallholder farmers in hills and plains of Nepal. Nepalese J Agri Sci. 2014;12:164-171.
9. Petersen ME. Seed sovereignty-how can organic agriculture contribute to the development and protection of the seed, a case study of Nepal. Arhus University, Denmark. 2014.
10. Rong K, et al. Factors affecting farmers participation in China group guarantee lending program. China. Agri Eco Rev. 2015;7:45-64.
11. Afolami CA, et al. Socioeconomic analysis of rice farmers and effects of group formation on rice production in Ekiti and Ogun States of South-West Nigeria. J Agri Sci. 2012;4:233-244.
12. Bartlett A. Farmer ield schools to promote integrated pest management in Asia: The FAO Experience. FFS to promote IPM in Asia-case for IRRI ws on scaling up. Manila. IRRI. (2005).
13. Guo M, et al. Farmer ield school and farmer knowledge acquisition in rice production: Experimental evaluation in China. Agric Ecosyst Environ. 2015;209:100-107.
14. Yamada H, et al. Importance of informal training for the spread of agricultural technologies: Farmers as in-residence extension workers and their motivation for sustainable development. Sust Dev. 2015;23:124-134.
15. Inyang OG. The role of information and female vegetable farmers in Calabar Municipal Council area, Nigeria, Libri. 2015. 16. Fountas S, et al. Farm management information systems: Current situation and future perspectives. Comput Electron Agric.
2015;115:40-50.
17. Chopin P, et al. A new method to assess farming system evolution at the landscape scale. Agron Sustainable Dev. 2014;35:325-337.
18. Goldberg D, et al. Drip irrigation: Principles, design and agricultural practices. 1976; Available on www.cabdirect.org/ abstracts/19780360141.html.
19. Brown S and Kennedy G. A case study of cash cropping in Nepal: Poverty alleviation or inequity? Agric Human Values. 2005; 22:105-116.
21. Pariyar A. Tunnel farming for off-season vegetable cultivation in Nepal. In: UNDP/FAO/IFAD (Eds.), Agricultural Organization of the Unites Nations. 2015; Available on TECA (http://teca.fao.org)
22. MEDEP. Micro-Enterprises. Development for Poverty Alleviation. Kathmandu, Nepal: Micro-Enterprise Development Programme (MEDEP)/UNDP Ministry of Industry (MOI). Nepal. 2011.
23. Hellin J, et al. Farmer organization, collective action and market access in Meso-America. Food Policy. 2009;34:16-22. 24. Tuan MH, et al. Systemic interventions addressing market access challenges of smallholder vegetable farmers in Northern
Vietnam. Int J Market Bus Sys. 2015;1:136-158.
25. Shepherd AW. Experiences with the "Linking Farmers to Markets" approach in enhancing. The Performance of Horticultural Supply Chains in The Transitional Economies. ISHS Acta Horticulturae 794: II International Symposium on Improving the Performance of Supply Chains in the Transitional Economies. FAO, Rome. 2007;66.
26. Farmer SM, et al. The behavioral impact of entrepreneur identity aspiration and prior entrepreneurial experience. Entrep Theory Pract. 2011;35:245-273.
27. Pastakia A. Grassroots ecopreneurs: Change agents for a sustainable society. J Organ Change Manag. 1998;11:157-173. 28. Mottaleb KA, et al. Strengthening market linkages of farm households in developing countries. Appl Econ Perspect Policy.
2015;37:226-242.