1
The Impact of Customer Experience toward Customer Satisfaction and Loyalty
of Ciputra World Surabaya
Silvana Chandra
International Business Management Program, Petra Christian University Jl. Siwalankerto 121-131, Surabaya
E-mail: [email protected]
ABSTRACT
Ciputra World Surabaya is facing a tense competition, especially with the upcoming new shopping malls. Author believes that customer satisfaction and loyalty is the ultimate solutions to maintain the visitors traffic, which can be achieved by encouraging customer experience. The research succeeds to gather 142 respondents using simple random sampling method. Thus, by applying the Path Analysis with Regression, it is able to prove that customer experience has significant impact toward customer satisfaction of Ciputra World Surabaya. Then, customer satisfaction has significant impact toward customer loyalty of Ciputra World Surabaya. Author also tested customer satisfaction as mediating variable, however, the result shows that customer experience has no significant impact toward customer loyalty, mediated by customer satisfaction of Ciputra World Surabaya.
Keywords: Customer Experience,Customer Satisfaction, Customer Loyalty, Ciputra World Surabaya
ABSTRAK
Ciputra World Surabaya sedang menghadapi persaingan dengan pusat-pusat perbelanjaan baru yang bermunculan di Surabaya. Penulis dalam permasalahan ini percaya apabila peningkatan kepuasan dan loyalitas pelanggan adalah solusi yang tepat dalam mempertahankan visitors traffic, dengan cara meningkatkan pengalaman pelanggan. Penelitian ini berhasil mengumpulkan data dari 142 reponden dengan metode simple random sampling. Data tersebut diolah menggunakan regresi dengan analisis jalur, yang berhasil membuktikan apabila pengalaman pelanggan memiliki pengaruh signifikan terhadap kepuasan pelanggan dan kepuasan pelanggan memiliki pengaruh signifikan terhadap loyalitas pelanggan dari Ciputra World Surabaya. Penulis juga melihat kepuasan pelanggan sebagai mediator, akan tetapi, hasil penelitian ini gagal membuktikan apabila pengalaman pelanggan memiliki signifikansi terhadap loyalitas pelanggan, melalui kepuasan pelanggan Ciputra World Surabaya.
Kata Kunci: Pengalaman Pelanggan,Kepuasan Pelanggan,Loyalitas Pelanggan,Ciputra World Surabaya
INTRODUCTION
Ciputra World Surabaya is one of the latest shopping mall in Surabaya, which is one of the projects of Ciputra Group superblock plan in West Surabaya. The shopping mall has the advantages of sole stores options (Metro Department Store, Salvatore Ferragamo, Tommy Hilfiger, etc), and the strategic location of the new central business district, which only takes minutes to residential, hotels, and highway. According to promotion and event division of Ciputra World Surabaya, it has reached almost 100% occupancy and high shopping mall visitor traffic. Therefore, it becomes one of the tough competitors for other shopping malls to attract international brands or tenants and visitors.
However, there are upcoming new shopping malls, who are preparing themselves to win the visitors traffic of Ciputra World Surabaya. There are Tunjungan Plaza 6 and Supermall extension. These shopping malls will target the similar target market and have the same offers as Ciputra World Surabaya is today. According to Minarto, one of the company directors, there are nearly 100 brands, mostly foreign high-end brands, on their waiting list for Tunjungan Plaza 4, will be accommodated by the new plaza.
(“Pakuwon to Build New Shopping Complex”, 2011,
June).
2 apartment. Therefore, management cannot rely on this expansion to win the competition. Ciputra World Surabaya has to prepare the other movement of focus to maintain their visitors traffic.
Therefore, author proposed that Ciputra World Surabaya should increase the customer satisfaction and build customer loyalty. In fact, customer’s satisfaction is a mindset where customer’s needs, wants, also expectations on a product or services have met or exceeded, which resulted in repeating purchase and also loyalty (Sondoh et al., 2007). Customer satisfaction perceived to have numbers of benefits, such as enhancing customer loyalty, improving reputation, lowering down price elasticity, lowering the cost in future transaction and also increasing employees competence (Sondoh et al., 2007). Loyalty is also viewed as retention of the brand or company (Kumar, 2012). Then, the most important part is that loyalty is a committed and affect-laden partnership between consumers and brands (Touzani and Temessek, 2009). Both, customer satisfaction and loyalty are the competitive advantage that Ciputra World needed to win the competition
Here, the solution to achieve customer satisfaction and customer loyalty is through customer experience. The theory has been attracted many marketers in the world and applied to many companies and brands (Pine and Gilmore, 1998; Schmitt, 1999). The customer experience dimensions are proposed from Bernd Schmitt in 1999. Therefore, these are the important questions to be answered through the research:
Does the customer experience (sensory experience, emotional experience, social experience) have an impact toward customer satisfaction of Ciputra World Surabaya?
Does the customer satisfaction have an impact toward customer loyalty of Ciputra World Surabaya?
Does the customer experience have an impact toward customer loyalty, mediated by customer satisfaction of Ciputra World Surabaya?
LITERATURE REVIEW
The topic of this research report is the impact of customer experience toward customer satisfaction and loyalty of Ciputra World Surabaya. In order to create an analysis through a strong theory basis, author has conducted theoretical background that will discuss and elaborate the theories of concepts. There will be three main concepts or ideas to be understood, which are customer experience, customer satisfaction, and customer loyalty.
Customer Experience
Customer experience originates from a set of interactions between a customer and a product, a company, or any part of its organization, which
provoke a reaction (Schmitt, 1999). Later, Meyer and Schwager (2007) defined it as a personal and subjective response from a customer to any direct and indirect contact with the company or product. It means that customer experience will have different
result to different individuals. “Its evaluation depends on the comparison between a customer’s expectations
and the stimuli coming from the interaction with the company and the offering in correspondence of the different moments of contacts or touch-points” (Gentile, Spiller, and Noci, 2007, p. 397).
Specifically for the research, author chooses to apply the theory of customer experience from Bernd Schmitt in 1999, with title of Experiential Marketing
“How to Get Your Customers Sense, Feel, Think, Act and Relate, to Your Companies and Brands”. Here,
Schmitt (1999) identified five different types of experiences: sensory experiences (sense), affective experiences (feel), creative cognitive experiences (think), physical experiences, behaviors and lifestyles (act) and social-identity experiences that result from relating to a reference group or culture (relate).
According to Schmitt (1999), “sense marketing”
appeals to customers senses (sight, sound, touch, taste, and smell), “feel marketing” appeals to
customers’ inner feelings and emotions, ranging from
mildly positive moods linked to a brand to strong emotions of joy and pride, “Think marketing” appeals to the intellect in order to deliver cognitive, problem-solving experiences that engage customers creatively,
“act marketing” targets physical behaviors, lifestyles,
and interactions, and finally, “relate marketing”
creates experiences by taking into account
individuals’ desires to be part of a social context
(self-esteem, being part of a subculture, or a brand community).
Schmitt (1999) along with Verhoef et al (2009) generated the dimensions for customer experience from these five types of experiences. The dimensions are sensory experience, emotional experience, and social experience. Basically, the dimensions represent the five types of experience. Therefore, companies, which apply these dimensions able to get the customers sense, feel, think, act, and relate. These dimensions have been chosen by many studies for many industries and companies, including shopping mall, which means that the validity and reliability have been tested true for the research scope (Ardyan, 2012; Yang and He, 2011; Nasermoadeli, 2013). 1. Sensory Experience
Schmitt (1999) believed that sensory experience is the aesthetic and sensory perceptions about the shopping environment, atmosphere, products and service. In other words, sensory experience focuses on
the human five senses, such as customer’s sight,
hearing, smell, touch, and taste. Human five senses cannot be measured directly, but through the reaction of people, which results have been proven.
3 indicator of sensory experience by referring to one of previous study from Yang and He (2011), where the attributes for sensory experience is applied from Wen
(2007), which are “The shopping process would arouse my strong sensations”, “The shopping trip would bring me great interest”, “The shopping trip is
very attractive”, and “The shopping trip is quite
worthwhile” (Yang and He, 2011, p.4). Yang and He
(2011) is not the only one, who chose these indicators. Recently, Nasermoadeli et al. (2013) also applied the same indicators on their research about customer experience toward purchasing intention.
2. Emotional Experience
For emotional experience, it includes the moods and emotions generated during the shopping trip (Schmitt, 1999). Therefore, it is described as how a company is able to create emotions and how it can be explained based on response, central, cognitive, and arousal theories.
Author of the research also refers to the study from Yang and He (2011), where the attributes for sensory experience is applied from Guens (2004), The attributes for emotional experiences are the mood or feeling of customers during the visitation or shopping
at Ciputra World Surabaya, such as “I feel contented”, “I feel happy”, “I feel satisfied”, “I feel pleased”, “I feel relaxed”, “I feel hopeful” (Yang and He, 2011;
Nasermoadeli et al., 2013). 3. Social Experience
Social experience emphasizes the relationships with others and society. Schmitt (2003) argued that every social experience could create impacts toward individual in the socializing procedure through family, schooling, peer groups, and mass media.
Finally, author of the research decides to determine the indicators of social experience from study of Yang and He (2011) as well. The attributes proposed for social experience is coming from Fan
and Li (2006), which are “the shopping trip can
promote my relationships with others or friendship”, “By shopping in these supermarkets/shopping marts, I can get recognition”, “By shopping in these
supermarkets/shopping marts, I can find a sense of
belonging”, and “By shopping in these
supermarkets/shopping marts, I can position my social
status” (Yang and He, 2011, p.4). Furthermore,
Nasermoadeli et al. (2013) also applied these indicators on their research about customer experience toward purchasing intention. For the research, author will alter the word of supermarkets/shopping mart to Ciputra World Surabaya as the research scope.
Customer Satisfaction
Customer satisfaction is seen as a post-consumption evaluative judgment of a particular purchase experience or activity (Bae, 2012). In Oxford Dictionary, satisfaction is defined as
fulfillment of one’s wishes, expectations, needs, or
pleasure derived from this. Therefore, customer
satisfaction occurs when the customer’s expectation is
fulfilled. Sondoh et al. (2007) supported the statement that customer satisfaction is delineated as the
customer’s evaluation that products or services meet or fall to meet the customer’s expectations concluded
that customers are satisfied when shopping mall offers able to impress them. For instance, if customers have no initial expectation toward the shopping mall attributes, such as tenant mix, customer service, they would feel a sense of satisfaction coming from the fact that the shopping mall had exceeded their initial expectation. Furthermore, Kumar (2013) also confirmed that customer satisfaction is derived psychologically from comparing the initial expectation of the customers to their actual experience in the shopping mall. Moreover Hosany and Witham (2009) said that satisfaction collectively with other factors play an important role on consumer buying and behavioral phenomenon. Satisfaction plays a central role in marketing because it is a good predictor of purchase behavior (repurchase, purchase intentions, brand choice and switching behavior) (McQuitty et al., 2000).
Customer Loyalty
Referring to Oliver (1997), Walsh et al. (2008)
loyalty definition is “A deeply held commitment to
re-buy or re-patronize a preferred product or service consistently in the future, which causes repetitive same-brand or same-brand set purchasing, despite any situational influences and marketing efforts that might
cause switching behavior” (Chaudhuri and Holbrook,
2001, p. 82). Customer loyalty has been defined early as the willingness of customer to maintain their relations with a particular firm or service or product (Rai and Medha, 2013). In reality, loyalty should be explained as a customer commitment dealing with a particular firm, buying their products and services and referring it to colleagues. For instance, customer loyalty can be analyzed by the repetitive actions of customer toward product or services. Caruana (2002) support the argument that behavior is a full expression of loyalty to the brand and not just thoughts.
However, behavior standards (such as repetitive visit or purchase) have been criticized, due to the lack of a conceptual basis of a dynamic process (Mosahab et al., 2010). In the case of shopping mall, the absence of brands or tenants preference can change
customer’s decision not to visit Ciputra World
Surabaya. Therefore, this indicator should be supported with other indicator, such as willingness to recommend by customers. The willingness of customer to talk good things about shopping mall or positive word-of-mouth (WOM), and giving recommendation to visit Ciputra World Surabaya able to become one of the factor of customer loyalty. On the firm level, WOM is viewed as being part of firm loyalty (Dithan, 2009). Thus positive WOM that is
4 Emotional
Experience
Social Experience
Sensory Experience
Customer Experience
Customer Loyalty Customer
Satisfaction
profitability, because positive WOM attracts new customers. As noted by Dithan (2009), the real value of those customers most loyal to a firm (customer loyalty) is not so much the business that they personally generate but rather their impact on others in the marketplace. Therefore, other than repetitive actions by customer, such as visitation and purchase, positive WOM spread by the customer will be included as the indicators of customer loyalty as well.
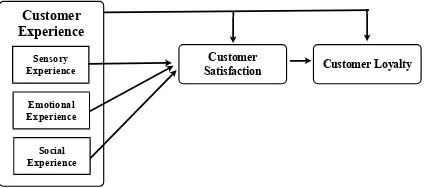
Therefore, to answer the research problems, the hypotheses are constructed, such as following:
Figure 1. Relationship Between Concepts Hypothesis 1 (H1): Customer Experience
(Sensory Experience, Emotional Experience, Social Experience) simultaneously has significant impact to Customer Satisfaction of Ciputra World Surabaya.
Hypothesis 2 (H2): Customer Experience
(Sensory Experience, Emotional Experience, Social Experience) individually has significant impact to Customer Satisfaction of Ciputra World Surabaya.
Hypothesis 3 (H3): Customer Satisfaction has
significant impact to Customer Loyalty of Ciputra World Surabaya.
Hypothesis 4 (H4): Customer Experience has
significant impact toward Customer Loyalty, mediated by Customer Satisfaction of Ciputra World Surabaya.
RESEARCH METHOD
The research will apply causal study as the research design and using the quantitative study as the research method. Causal study is chosen because author will analyze the impact of customer experience in service industry, especially for Ciputra World Surabaya shopping mall toward the customer satisfaction and customer loyalty. Thus, author able to manage the independent variable to test the impact toward the dependent variables. Therefore, the relationship result from causal study will clarify the concepts impact to each other. In conclusion, causal study is the best method to test the proposed hypotheses for this research design to answer the research problem.
Furthermore, quantitative study is chosen due to
research’s result objective of a precise measurement
for each concept and the relationship to each other. It is important that the result will not be biased toward subjectivity, where it usually happens in qualitative study. Because, satisfaction and loyalty measurement has to be objective, therefore the result may be applicable to the company. Furthermore, author will test the hypotheses for several concepts to answer the question of customer experience impact toward customer satisfaction and loyalty of Ciputra World Surabaya. Thus, it is obvious that quantitative study is applicable to this research.
For this research, the independent variable is customer experience, with the dimension of sensory experience, emotional experience, and social experience. The intervening variable or mediating variable is the customer satisfaction that connects the main independent variable to dependent variable. The dependent is customer loyalty.
The research aims to construct and find the key of customer loyalty concept for Ciputra World Surabaya. Therefore, the ultimate objective is to measure and understand the customer loyalty, which is the dependent variable of this research.
According to the relevance journals and previous studies, author has chosen the indicators of customer loyalty that applicable for Ciputra World Surabaya. Thus, these indicators will be measured through the Likert scale in the questionnaire to understand the loyalty of Ciputra World Surabaya customers. Here, the indicators of customer loyalty of Ciputra World Surabaya: “I am giving positive comments about Ciputra World Surabaya, “I will give recommendation to other parties, such as my family and friends to shop
at Ciputra World Surabaya”, “There is a bigger
chance that I will shop at Ciputra World Surabaya
again”, “I rarely shop at other shopping malls in
Surabaya”, “Ciputra World Surabaya is my first
choice of shopping mall”, “I believe that Ciputra
World Surabaya is the best shopping mall in
Surabaya” (Aryani and Rosinta., 2010)
There are four independent variables of this research, which are sensory experience, emotional experience, and social experience and the customer experience in overall.
Thus, author of the research determines the indicator of sensory experience by referring to one of previous study from Yang and He (2011), where the attributes for sensory experience is applied from Wen
(2007), which are “The shopping process would arouse my strong sensations”, “The shopping trip would bring me great interest”, “The shopping trip is very attractive”, and “The shopping trip is quite
worthwhile” (Yang and He, 2011, p.4).
Author of the research also refers to the study from Yang and He (2011), where the attributes for sensory experience is applied from Guens (2004), The attributes for emotional experiences are the mood or feeling of customers during the visitation or shopping
5
“I feel happy”, “I feel satisfied”, “I feel pleased”, “I feel relaxed”, “I feel hopeful” (Yang and He, 2010;
Nasermoadeli et al., 2013).
While, the other two dimension focus on visitor as individual, this dimension will construct the experience from the social life point of view of shopping at Ciputra World Surabaya. Therefore, the indicators focus on the social benefit received by visitors by visiting Ciputra World Surabaya. Finally, author of the research decides to determine the indicators of social experience from study of Yang and He (2011) as well. The attributes proposed for social experience is coming from Fan and Li (2006), which are “the shopping trip can promote my
relationships with others or friendship”, “By shopping
in these supermarkets/shopping marts, I can get
recognition”, “By shopping in these
supermarkets/shopping marts, I can find a sense of
belonging”, and “By shopping in these
supermarkets/shopping marts, I can position my social
status” (Yang and He, 2011, p.4). Furthermore,
Nasermoadel et al. (2013) also applied these indicators on their research about customer experience toward purchasing intention. For the research, author will alter the word of supermarkets/shopping mart to Ciputra World Surabaya as the research scope.
In the end, to understand the overall customer experience impact toward customer loyalty, mediated by customer satisfaction, author needs to have the total average of dimensions. Therefore, author calculates the total average of sensory experience, emotional experience, and social experience for the score of customer experience.
According to the journal references, researchers mentioned that customer loyalty is built through customer satisfaction. Therefore, it acts as the mediating variable to the ultimate objective of understanding customer loyalty. Customer satisfaction has several indicators that also come from previous studies, which are: “I am happy with my decision shopping at Ciputra World Surabaya” (Hosany and Witham, 2012; Bae 2012), “The experience from Ciputra World Surabaya as a shopping mall is beyond
my expectation” (Bae 2012; Kumar, 2013), “I have
spent more money for shopping, when I am shopping
at Ciputra World Surabaya” (Wang, 2009).
Specifically for this research, author will use dichotomous scale, category scale, and Likert scale. First, dichotomous scale is usually utilized to elicit a yes or no answer or two mutually exclusive options or getting nominal data the input (Cooper and Schindler, 2011). For example in this research is the Ciputra World Surabaya visitation and gender. While, category scale uses multiple items to finally get a single response from the respondents, or more universally known as a multiple choice question, with only one option eligible to be chosen (Cooper and Schindler, 2011). For this research, it will be useful
toward respondent’s profile, such as age, personal
shopping expenditure, shopping mall visitation frequency, Ciputra World Surabaya visitation frequency, and most frequent visited shopping mall. The Likert scale itself consists of statement, which expresses either a favorable or an unfavorable attitude toward the subject in question (Cooper and Schindler, 2011). The respondent would be asked to show their level of agreement or disagreement with each statement. Each response would be given a numerical scoring to reflect its degree of attitudinal favorableness and the scores may be summed to measure the respondent’s overall attitude. In this research, Likert scale is applied to the agreement or disagreement of customer experience customer satisfaction and customer loyalty indicators.
This research will use the probability sampling, with simple random sampling method. Simple random sampling means every one in the population has the same or equal chance to be selected as the sample (Cooper and Schinler, 2011). Then, the population of the sample is:
Age more than 17 years old
Have visited Ciputra World Surabaya at least once.
RESULTS AND DISCUSSION
Author of the research will use statistical program of Statistical Product and Service Solution or SPSS version 21.0 for Macintosh to run the statistic data and analyze the results. For the processing data method, author will apply path analysis with regressions. The method explains the relationship of independent variables to dependent variables. The particular technique for carrying out the regression analysis is Ordinary Least Squares (OLS), which was first introduced by Carl Friedrich Gauss. Furthermore, the result of Best Linear Unbiased Estimator (BLUE) is used to maximize and fulfill the OLS by testing the multicollinearity of the independent variables, autocorrelation in residuals, heteroscedasticity of
residuals, and normality of the residual’s variance.
The next step is to utilize the coefficient multiple determinations to see the goodness of fit of the statistical model by taking a closer look at the Adjusted R Square. Furthermore, the author also needs to conduct the F-Test to understand the independent variables simultaneous impact toward the dependent variables. In the end, t-Test is used to investigate the impact of each independent variable to the dependent variables.
There are five variables that are being tested for the validity and reliability, which are sensory experience, emotional experience, social experience, customer satisfaction, and customer loyalty. First, the reliability
test is understood through Cronbach’s Alpha
6 correlation value. The value is expected to be above the r table (Appendix H). Since there are 142 respondents with significance level of 5%, the r-table is 0.165 (df=140). Therefore, if the criterions are met, then variable is stated as reliable and valid.
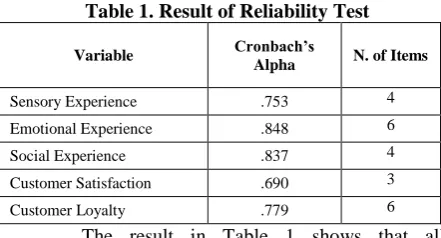
Table 1. Result of Reliability Test
Variable Cronbach’s
Alpha N. of Items
Sensory Experience .753 4
Emotional Experience .848 6
Social Experience .837 4
Customer Satisfaction .690 3
Customer Loyalty .779 6
The result in Table 1 shows that all
Cronbach’s Alpha (� is higher than 0.6, therefore all
indicators are reliable.
Table 2. Result of Validity Test
Variables Indicators
Corrected Item-Total Correlation
Sensory Experience
Sensation 0.559
Interest 0.528
Attractive 0.6
Worthwhile 0.519
Emotional Experience
Contended 0.628
Happy 0.669
Satisfied 0.691
Pleased 0.556
Relaxed 0.601
Hopeful 0.642
Social Experience
Relationship 0.561
Recognition 0.733
Sense of Belonging 0.645 Social Status 0.746
Customer Satisfaction
Happy Decision 0.545 Beyond Expectation 0.557 Spend More than
Intention 0.431
Customer Loyalty
Positive Comments 0.641 Recommendation 0.57
Re-Visit 0.505
Rare Visit to Other
Shopping Malls 0.449 First Choice of
Shopping Mall 0.488
Best Shopping Mall 0.519
The result in Table 2 shows that all Corrected Item-Total Correlation scores above 0.165. Therefore all indicators are valid.
Ghozali (2011) added that tolerance valueand variance inflation factor (VIF) can indicate multicolinearity. Tolerance measures the variability of the independent variable, which is not explained by the other independent variable. When, VIF is equal to 1 divided by tolerance, low tolerance value will have the equal meaning Thus, Ghozali (2011) mentioned that multicolinearity occurred if:
Tolerance < 0.10 or VIF > 10
There is no presence of Tolerance value below 0.10, which means that there is no correlation between independent variables analyzed. The smallest Tolerance value is 0.390, which is above 0.1. Furthermore, the result Variance Inflation Factors (VIF) is below 10. In fact, the biggest VIF values of the variables are within 2.563. Therefore, there is no multicollinearity presents among the three independent variables for the first regression, which are sensory experience, emotional experience, and social experience and two independent variables for the fourth regressions, which are customer experience and customer satisfaction.
Author chooses to apply Durbin-Watson test to detect auto correlation in the regression model (Ghozali, 2011). The result of d value will be, with the decision making of (Santosa, 2005, p.41):
DW value < -2 : There is negative autocorrelation
-2 > DW value > +2: There is no autocorrelation DW value > +2 : There is positive
correlation
Table 3. Result of Autocorrelation Test
Regressions Watson Durbin 1 Y = SE + EE + SoE + e 1.888
2 Y = CS + e 1.924
3 Y = CE + e 1.991
4 Y = + CE + CS + e 1.928
Table 3 above shows the result of Durbin-Watson of the research models. According to the result from table below, the Durbin-Watson values from four regressions in the model are 1.888, 1.924, 1.991, 1.928, which are between -2 and +2. Therefore, there is no autocorrelation in the model or there is no correlation between the errors periodically.
7 Asymp. Sig.-value should be greater than 0.05 (Ghozali, 2011). The Kolmogorov Smirnov results for four regression models are 0.714, 0.584, 0.381, 0.693. Since all of them are above 0.05. Therefore residual variables in the regression model are having normal distribution.
Table 4. Kolmogorov Smirnov results
Table 5. Result of Adjusted R Square
After all of the assumptions are fulfilled, author will continue the data processing. The next step will be to test Adjusted �2. Adjusted �2is the adjusted value of �2. It will explain how much the variation of dependent variable being explained by the variation of independent variables. The Table 5 shows the result of Adjusted �2for four regression models of the research. For the first regression, the result of adjusted �2is 0.532. It means that 53.2% of the variation in
customer satisfaction can be explained by the variation of customer experience dimensions, which are sensory experience, emotional experience, and social experience, while the rest of 47% is explained by other factors that are not included in the model. Thus, for the second regression, the result of adjusted �2is 0.539, or 53.9% of variation in customer loyalty can be explained by variation of customer satisfaction, while the other 46% is explained by other factors, which are not in the model. The third regression mentions that adjusted �2 is 0.510 or 51% of variation of customer satisfaction can be explained by variation of customer experience, and approximately 49% is
explained by other factors, which are not included in the model. Last but not least, the fourth regression states that adjusted � 2is 0.535 or 53.5% of variation of customer loyalty can be explained by variation of customer experience and customer satisfaction, and more or less 46% is explained by other variations, which are not in the model.
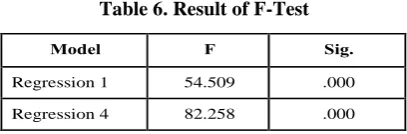
Table 6. Result of F-Test
Regression 1 is to test the impact of customer experience (sensory experience, emotional experience, and social experience) simultaneously toward customer satisfaction of Ciputra World Surabaya. Table 6 above shows that the F value is model reflects that independent variables (sensory experience, emotional experience, and social experience) simultaneously have significant impact toward the dependent variable (customer satisfaction) of Ciputra World Surabaya.
Furthermore, for regression 4, which is to test the impact of customer experience and customer satisfaction toward customer loyalty of Ciputra World Surabaya, F value is 82.258. Therefore, the F-value is greater than F-table. Then, author also checks the probability result, which is 0.000. Because the Sig F (p-value) is much smaller than 0.05, this regression model reflects that independent variables (customer experience, customer satisfaction) simultaneously have significant impact toward the dependent variable (customer loyalty) of Ciputra World Surabaya.
Table 7. Result of T-Test
According to the Table 7, the result from
Model Independent Variable Dependent Variable
Unstandardized
Regression 2 Satisfaction Customer Customer Loyalty .628 .049 12.870 .000
Regression 3 Experience Customer Satisfaction Customer .818 0.067 12.155 .000
8 customer satisfaction is 1.023, which is not greater than t-table value, 1.656. Then, the significance result of sensory experience is also greater than 0.05, which is 0.308. It concludes that the null hypothesis fails to be rejected, which means that sensory experience has no significant impact toward customer satisfaction of Ciputra World Surabaya.
Then, emotional experience t-value is 5.817, which is greater than t-table value of 1.656. Thus, the result of t significance is 0.00, which is lower than 0.05. It concludes that the null hypothesis is rejected, and emotional experience has significant impact toward customer satisfaction of Ciputra World Surabaya.
Furthermore, social experience to customer satisfaction t-value is 2.792, which is greater than 1.656. Thus, the significance result of emotional experience is 0.007 is lower than 0.05. Therefore, it concludes that null hypothesis is rejected, which means that social experience has significant impact toward customer satisfaction of Ciputra World Surabaya. For regression 2, customer satisfaction to customer loyalty t-value is 0.736. This result is bigger than 1.656 from t-table. Then, the significance t is 0.00, which is lower than 0.05. Therefore, null hypothesis is rejected and concludes that customer satisfaction has significant impact to customer loyalty. In the end, according to the result of regression 4 in Table 7, customer experience to customer satisfaction, the result of t-value is 12.115, which is greater than t-table value, 1.656. Thus, the significance t is also 0.00, is lower than 0.05. It concludes that model succeeds to rejects null hypotheses and concludes that customer experience has significant impact to customer satisfaction.
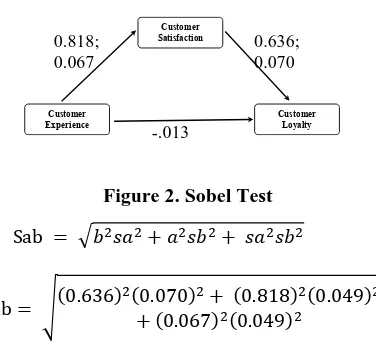
The mediating variable hypothesis was
introduced by Sobel (1982), which is also known as Sobel test (2011). This test is appropriate only for large sample sizes. The Sobel (1982) test is relatively conservative, and among the procedures reviewed by Fritz and MacKinnon (2012), it had moderately good statistical power.
Figure 2. Sobel Test Sab = √ 2� 2+ 2� 2+ � 2� 2
Sab = √ . 2+ .. 2+ .2 . 22 . 2
Sab = 0.44790046 ab = . x . = .
t = 0.0. 20200 = .
Since t-value is 1.16152595 is not higher that 1.96 (significance level =5%), then the research fails to reject Ho, and customer experience has no significant impact toward customer loyalty, mediated by customer satisfaction.
CONCLUSION
In conclusion, the research shows that customer experience (sensory experience, emotional experience) simultaneously has significant impact toward customer satisfaction. Individually, emotional experience and social experience has significant impact toward customer satisfaction. However, the research fails to prove that sensory experience individually has significance toward customer satisfaction. Furthermore, the research also able to prove that customer satisfaction has significant impact toward customer loyalty. Then, the research fails to prove that customer experience has significant impact toward customer loyalty, mediated by customer satisfaction.
Therefore, Ciputra World Surabaya should enhance the customer experience to increase the customer satisfaction and build customer loyalty to win the tense competition between current and new shopping malls in Surabaya. The strategies should focus on emotional experience and social experience, such as building customer focus culture and building relationship with communities.
There have been several limitations of the research, which may affect the research result, such as:
a. Respondent’s Honesty
During the questionnaire distribution, author noticed that not all the respondents are having the sincere willingness to fill the questionnaire. It gives the possibility that the respondents do not read the questionnaire carefully and giving their honest or true answers. Furthermore, many of them also refuse to fill the questionnaire, which makes the unequal distribution of questionnaire for the simple random sampling method.
b. Other Satisfaction and Loyalty Factors or Determinants
According to the research result, customer experience has significant toward the customer loyalty, mediated by the customer satisfaction. However, there are other journals had mentioned that shopping mall attributes, such as tenants mix, service quality, music, etc could affect the customer satisfaction or loyalty as well. Since, they are not Customer
Satisfaction
Customer Loyalty Customer
Experience 0.818; 0.067
0.636; 0.070
9 being discussed in the research, there is a probability that the existence of mall attributes also affect the result of satisfaction and loyalty for Ciputra World Surabaya.
In the end, author also gives suggestion to the further research in the future to able giving better result and impact to the business world, such as incentives for filling the questionnaire, expanding the variable of customer satisfaction and customer loyalty factors. And apply structural equation method. c. Statistical Method
Journal references from Ardyan (2012) clearly mentioned that Structural Equation Method was applied to achieve the result. The different statistical method by this research and previous research may cause different result. Structural Equation Method may allow the research to test the data simultaneously and gives author more complete data to be analyzed. Unfortunately, author of the research cannot apply this method due to limitation of facility.
Thereofore, for the future research, author suggest to give tackle these limitations by giving incentives to respondents, expanding the variable of customer satisfaction and customer loyalty factors and apply Sturctural Equation Method as the statistical method.
REFERENCES
Ardyan, E. (2012). Pengalaman konsumen membangun kepuasan dan loyalitas konsumen (studi empiris pada konsumen Paragon Mall Semarang). Graduasi Vol. 28, 47-58.
Aryani, D & Rosinta F. (2010). Pengaruh kualitas layanan terhadap kepuasan pelanggan dalam membentuk loyalitas pelanggan. Bisnis & Birokrasi, Jurnal Ilmu Administrasi dan Organisasi Vol.17 No.2 pp 114-126. Badan Perencanaan Pembangunan. (2010). Rencana
Pembangunan Jangka Menengah Daerah Daerah Kota Surabaya Th. 2010-2015. Retrieved February 25, 2014, from http://www.surabaya.go.id/dinamis/?id=3721 Bae, Y.H. (2012). Three essays on the
customer-customer loyalty association. University of Iowa, Iowa Research Online.
Baron, R. M., & Kenny, D. A. (1986). The moderator-mediator variable distinction in social psychological research: Conceptual, strategic, and statistical considerations. Journal of Personality and Social Psychology, 51, 1173-1182.
Brakus J J, Schmitt B H and Zarantonello L (2009). Brand experience: What is it? How is it measured? Does it affect loyalty? Journal of Marketing, Vol. 73, May, pp. 52- 68.
Boulding, W. et al. (1993). A dynamic process model of service quality: From expectations to behavioral intentions. Journal of Marketing Research, 30.
Carter, N. (2012, August). Multi-sensory retail: Why stores must appeal to all five senses.
Retrieved March 11, 2014, from
http://www.theguardian.com.
Caruana, A., & Malta, M. (2002). Service loyalty: The effects of service quality and the mediating role of customer satisfaction. European Journal of Marketing, 36, 811–828.
Chaudhuri, Arjun, and Holbrook, M.B. (2001). The chain of effects from brand trust and brand affect to brand performance: the role of brand loyalty. The Journal of Marketing, 81-93.
Choi, Y.G., Ok, C,H., & Hyun, S.S. (2011). Evaluating relationships among brand experience, brand personality, brand prestige, brand relationship quality, and brand loyalty: An empirical study of coffeehouse brands.
Ciputra World Surabaya (2013). Laporan Divisi Promosi 2013. Surabaya. Promotion , 2013. Citra, A. (2011, August 4). APPBI khawatirkan
pertumbuhan mal di Surabaya. Antara News. Retrieved February 25, 2014, from http://www.antarajatim.com.
Cooper, D. & Schindler, P. (2011). Business research methods. (13th edition). New York: McGraw-Hill Education.
Cronin, J. J. and Taylor, S. A. (1992). Measuring service quality: A re-examination and extension. Journal of Marketing. Vol. 56, No. 3, pp. 55-68.
Dithan, N.P. (2009). Relationship marketing, word of mouth communication and customer loyalty in the telecommunication industry of Uganda. Makerere University. HD10/17740U
East, R., Gendall, P., Hammond, K., & Lomax, W. (2005). Consumer loyalty: singular, additive or interactive? Australian Marketing Journal. 13(2).
Economic Profile (n.d.) Retrieved February 25, 2014, from http://smart.surabaya.go.id.
Fan XC, Li JZ (2006). Analysis of customers' restaurant experiences: an Empirical research. Tour tribune, 21(3): 56-61. (Published in Chinese).
Fatima, Hira & Rasheed, M. (2012). Determining the factors affecting consumer loyalty towards shopping malls. Global Advanced Research Journal of Management and Business Studies Vol. 1 No.4 pp134-140.
Ferdinand, A. (2006). Metode penelitian manajemen: Pedoman penelitian untuk penulisan skripsi, tesis dan disertasi ilmu manajemen. Badan Penerbit Universitas Diponegoro, Semarang. Fritz, M. S., Taylor, A. B., & MacKinnon, D. P.
10 results in statistical mediation analysis. Multivariate behavioral research. 47, 61-87. Gentile, Chiara, Nicola Spiller and Giulano Noci
(2007). How to sustain the customer experience: an overview of experience components that co- create value with the customer. European management journal. 25 (5), 395–410.
Ghafoor, M.M., Iqbal, H.K., Tariq, U., & Murtaza. F. (2012). Impact of customer satisfaction and brand image on brand loyalty. 002, 069-077. Ghozali, I. (2011). Aplikasi analisis multivariate
dengan program IBM SPSS 19.(5th ed).
Semarang: Badan Penerbit Universitas Diponegoro.
Gobé M. (2001). Emotional branding: The new paradigm for connecting brands to people. New York: Allworth.
Hair, J. R., R.E. Anderson, R. Thatam and Balcak W. 2010. Multivariat data analysis with reading (7th ed.). New Jersey.
Hasan, I.M. (2012). Pokok-pokok materi statistik 2 (statistic inferensif). Jakarta: Bumi Aksara Holbrook, M. B. and Hirschman, E. C., (1982). The
experiential aspects of consumption: Consumer fantasy, feelings a nd fun. Journal of Consumer Research. Vol. 9 No. 2, pp. 132-140.
Hosany, S. and Witham, M. (2009). Dimensions of cruisers experiences, satisfaction, and intention to recommend. Schhol of Management, royal Holloway university of London. http://www.mbsportal.bl.uk. Ismail, A.R. (2008). An investigation into the
relationship between customer experience and brand loyalty: A study in the service sector, paper presented at Brunel Business School, PhD Doctoral Symposium 2008, Brunel University.
Ismail, A.R. (2010). Investigating British customer’s experience to maximize brand loyalty within the context of tourism in Egypt: Netnography & structural modeling approach. Brunel University.
Jakpar, S., Angel, & Na, G.S. (2012). Examining t.he product quality attributes that influences customer satisfaction most when the price was discounted: A case study in Kuching, Sarawak. International journal of business and social science. 3(23).
Kotler, P., & Keller, K. L. (2009). Marketing management. Upper Saddle River, N.J: Pearson Prentice Hall.
Kumar, S. (2012). Do retail stores' attributes influence customer satisfaction in India? TRANS Asian Journal of Marketing & Management Research, vol. 2 no. 2.
Kumar, S. R. (2009). Consumer behaviour and branding: concepts, readings and cases - the
Indian context. Pearson Education in India. Latan, H., and Temalagi, S. (2013). Analisis
multivariate teknik dan aplikasi menggunakan program IBM SPSS 20.0. Bandung: Alfabeta.
Lindstrom, M. (2005). Brand Sense: Build Powerful Brands through Touch, Taste, Smell, Sight and Sound. New York: Free Press.
Lomax, W., East, E., Gendall, P., Hammond, K. (2005). Consumer loyalty: Singular, additive or interactive? Australian Marketing Journal 12 (2), 2005.
Maslow, Abraham H. (1943). A theory of human motivation. Psychology Review. Vol.50, pp. 370-396.
Hoolbrook, M.B. and Hirchman, E.C., (1982). “The
experiential aspects of consumption: Consumer fantasies, feelings and fun. Journal of Consumer Research.
Malhotra, N. (2005). Review of marketing research. M. E. Sharpe.
MacKinnon, D. P., Lockwood, C. M., Hoffman, J. M., West, S. G., & Sheets, V. (2002). A comparison of methods to test mediation and other intervening variable effects. Psychological Methods, 7, 83-104.
Meyer, C., & Schwager, A., (2007). Understanding customer experience. Harvard Business Review, 85(2), 116-126.
Mosahab, R., Mahamad, O., Ramayah, T. (2010). Service quality, customer satisfaction and loyalty: A test of mediation. Vol.3, No. 4, pp. 72-80.
McQuitty, S., Finn, A. & Wiley, J.B. (2000) Systematically varying consumer satisfaction and its implications for product choice. Academy of Marketing Science Review (on line). http://www.amsreview.org/ articles/mcquity10–2000.pdf.
Nasermoadeli, A. Ling, K.C., Maghnati, F. (2013). Evaluating the impacts of customer experience on purchase intention. International journal of Business and Management. Vol. 8 No. 6, pp. 128-138. Nauert, R (2010, February). Mood influences
shopping decision. Retrieved March 11, 2014, from http://psychcentral.com.
Nawaz, N.U.A., & Usman, A. (2011). What makes customers brand loyal: A study on telecommunication sector in Pakistan. International Journal of Business and Social Science. 2(14), 213-221.
Oliver, R. L. (1980). A cognitive model of the antecedents and consequences of satisfaction decisions. Journal of Marketing Research, Vol. 17, November, pp. 460-469.
11 Olsen, S. O. (2002). Comparative evaluation and the
relationship between quality, satisfaction, and repurchase loyalty. Journal of the Academy of Marketing Science. Vol. 30, No. 3, pp. 240-249
Prayoga, L., 2008 March 12, Mall untuk wisata, Kenapa Tidak?, Indonesia Tourism News, 11.
Pakuwon to spend Rp 1.3T on five projects. (2012, March 14). The Jakarta Post.
Pakuwon to build new shopping complex. (2011, June 25). The Jakarta Post.
Petermans, A., Janssens, W., & Van Cleempoel, K. (2013). A holistic framework for conceptualizing customer experiences in retail environments. International Journal of Design. 7(12), 1-18.
Pine, B. J. II. and Gilmore, J. H. (1998). Welcome to the Experience Economy. Harvard Business Review. 76 (4): 96-105.
Rai, A.K., and Medha, S. (2013). The antecedents of customer loyalty: An empirical investigation on life insurance context. Journal of Competitivess. Vol.5, Issue 2, pp.139-163. Sugiyono. (2004). Metode penelitian bisnis. Alfabeta:
CV. Bandung.
Schmitt, B.H. (1999). Experiential marketing. New York: Free Press.
Schmitt, B.H. (2003). Customer experience management. New York: Wiley.
Sarwono, J. (2006). Analisis data penelitian menggunakan SPSS. Yogyakarta: Andi Offset.
Setiawan, B. (2013). Menganalisa statistik bisnis dan ekonomi dengan SPSS 21. Yogjakarta, Andi Yogyakarta.
Sekaran, U. & Bougie, R. (2010). Research methods for business: a skill building approach. (5th edition). United Kingdom, John Wiley & Sons Ltd.
Sondoh, S.L., Omar, M.W., Wahid, N.A., Ismail, I. Harun, A. (2007). The effect of brand image on overall satisfaction and loyalty intention in the context of color cosmetic. Asian Academy of Management Journal. Vol.12, No.1, pp. 83-107.
Tabachnick, B. G, & Fidell, L. S. (2001). Using multivariate statistics. (4th edition). New
York, Harper Collins.
Touzani, M. & Tmessek, A. (2009). Brand loyalty impact of cognitive and affective variables. University of Galati. 1, 227-242.
Verhoef, P.C., Lemon, K.N., Parasuraman, A., Roggeveen, A., Tsiros, M., & Shlesinger, L.A. (2009). Customer experience creation: Determinants, dynamics and management strategies. Journal of Retailling. 85, 31-41. Walter, N., Cleff, T., & Chu, G. (2013). Brand
experience’s influence on customer
satisfaction and loyalty: A mirage in marketing research. International Journal of Management Research and Business Strategy. Vol. 2 No.1, pp.129-144.
Walsh, G., Evanschitzky, H., & Wunderlich, M. (2008). Identification and analysis of moderator variables: Investigating the customer satisfaction-loyalty link. European Journal of Marketing, 42(9), pp. 977-1004. Wang, S. M. (2012). Chinese tourists' satisfaction
with international shopping centers: a case study of the Taipei 101 building shopping mall. Quality Management and Practices, Dr. Kim-Soon Ng (Ed.). pp. 139-156.
Wong, C. B., Ng, H. C, Wong, K. L., & Wong, M. H. (2012). The relationship between shopping mall attributes, customer satisfaction and positive word of-mouth: China visitors in Hong Kong. Global Journal of Management and Business Research Vol. 12 No. 3. Wijaithammarit, S & Taechamaneestit, T. (2012).
Customer experience management influences customer ase study of supercenters in Thailand. Faculty of Business Administration, Rangsit University, Thailand Vol. 50 No.11.