40
Exploring the Impact of Brand Equity, Corporate Reputation,
and Product Quality on Customer Loyalty toward a National Newspaper
in Surabaya
Merlin Cecilia
International Business Management Program, Petra Christian University Jl. Siwalankerto 121-131, Surabaya
E-mail: [email protected]
ABSTRACT
National and local newspaper competes for gaining more market share. It is also happened with XYZ newspaper. XYZ newspaper as the biggest national newspaper in Indonesia tends to have low market share in other area outside Jakarta, especially in Surabaya. Previous researches showed that brand equity, corporate reputation, and product quality are able to influence customer loyalty which can lead to increasing number of customer and market share. Therefore, this research is conducted to examine the influence of brand equity, corporate reputation, and product quality on customer loyalty toward XYZ newspaper in Surabaya.
Quantitative method is used and multiple regression is chosen as the analytical method. With 95 samples collected through simple random sampling method, the result of the research shows that brand equity, corporate reputation, and product quality simultaneously have significant influence on customer loyalty toward XYZ newspaper in Surabaya. Also, corporate reputation and product quality individually have significant influence on customer loyalty toward XYZ newspaper in Surabaya. But, brand equity as individual has no significant influence on customer loyalty toward XYZ newspaper in Surabaya. Based on this fact, author concludes that XYZ newspaper should focus on improving corporate reputation and product quality, while also enhances its brand equity in order to increase the customer loyalty.
Keywords: Brand Equity, Corporate Reputation, Product Quality, Customer Loyalty, Newspaper
ABSTRAK
Koran nasional dan lokal bersaing untuk mendapatkan pangsa pasar. Hal ini juga terjadi pada koran XYZ. Koran XYZ sebagai koran nasional terbesar di Indonesia cenderung memiliki pangsa pasar yang rendah di area di luar Jakarta, terutama di Surabaya. Penelitian terdahulu menunjukkan bahwa ekuitas merek, reputasi perusahaan, dan kualitas produk dapat mempengaruhi loyalitas pelanggan di mana hal tersebut dapat meningkatkan jumlah pelanggan dan pangsa pasar. Maka dari itu, penelitian ini dilaksanakan dengan tujuan untuk mengkaji pengaruh ekuitas merek, reputasi perusahaan, dan kualitas produk pada loyalitas pelanggan terhadap koran XYZ di Surabaya.
Metode yang digunakan adalah metode kuantitatif dengan teknik analisa regresi berganda. Dengan 95 sampel yang dikumpulkan melalui metode pengambilan sampel acak sederhana, hasil dari penelitian menunjukkan bahwa ekuitas merek, reputasi perusahaan, dan kualitas produk secara bersamaan memiliki dampak yang signifikan pada loyalitas pelanggan terhadap koran XYZ di Surabaya. Secara individu reputasi perusahaan dan kualitas produk juga memiliki dampak yang signifikan pada loyalitas pelanggan terhadap koran XYZ di Surabaya. Tetapi, ekuitas merek secara individu tidak memilik dampak yang signifikan pada kesetiaan pelanggan terhadap koran XYZ di Surabaya. Berdasarkan hasil penelitian ini, penulis menyimpulkan bahwa koran XYZ sebaiknya berfokus pada peningkatan reputasi perusahaan dan kualitas produknya, serta tetap memperbaiki ekuitas merek sehingga kesetiaan pelanggan dapat terus meningkat.
Kata Kunci: Ekuitas Merek, Reputasi Perusahaan, Kualitas Produk, Keloyalitasan
41
INTRODUCTION
As the most sold printed media in Indonesia, newspaper business has been a stiff competition (Hitipeuw, January 28, 2012; Wikan, 2011). Outside the newspaper industry, other media such as television, radio, and Internet receive more and more attention from people as a source of information other than newspaper (Pew Research Center for the People & the Press, 2012). In addition, internally in newspaper industry, one newspaper competes with others to get newspaper buyers and advertisers. The competition is happened not only between national newspapers but also between national and local newspapers (Wikan, 2011). According to survey from Serikat Penerbit Suratkabar (SPS) Pusat n the mid-2009, it is found that 91.4% of the respondents read local newspaper, while the other 8.6% read national newspaper (Wikan, 2011).
Challenges from outside and within the newspaper industry are also faced by XYZ newspaper especially in Surabaya. XYZ newspaper is one of the biggest Indonesia national newspapers with 540.000 sold exemplars and 1.5 million readers today (A. Hendarta, personal communication, January 6, 2014). With hundred thousands of paid exemplar and millions of readership, XYZ newspaper is still the winner in national environment (A. Hendarta, personal communication, January 6, 2014), but it should also be careful with their market share in every region due to the competition with local newspaper. At Surabaya, XYZ newspaper is on the second rank with 3.8% of market share only. In contrast with XYZ newspaper market share, from the survey result by MARS Indonesia 2009 (Zumar, n.d., para. 9) and confirmed by Mr. Ardani Hendarta, business representative manager of PT XYZ newspaper East Java bureau, the biggest market share of about 90% is owned by Jawa Pos which headquarter is in Surabaya (A. Hendarta, personal communication, January 6, 2014). Differ than XYZ newspaper as a national newspaper, Jawa Pos contents are focused on local news.
Reflecting from the fact that XYZ newspaper has very low market share in Surabaya, the second most populous city in Indonesia, XYZ newspaper should be aware with the effect of this condition to its sales performance. Therefore, it is important for XYZ newspaper to know the reason behind the low market share starting from observing why XYZ newspaper buyer keep buying and loyal to XYZ newspaper as loyal customer can be a source for additional market share.
Loyal customer can increase market share since the customer becomes one of the referral sources for the company (Durkin, 2005). Customer referral is a good sign of customer loyalty. They, the loyal customer, will tell people around them their pleasant experience and why they buy products from the company. It is most likely that the other people will become the company’s customer and retain the existing customers all at once. This positive word-of-mouth will be a very effective marketing tool for the company yet no cost to be incurred (Lori, 2007). As the
long-term relationship is established between the customers and the company, the customers will become familiar and feel comfortable to buy products from the company. Thus, loyal customers also have a tendency to buy more from the company over time (Malekian, n.d.; Malaval, 2001).
Customers have reasons to make a repeat purchase and to be loyal to the company. The loyalty itself is “the result of constant investment in the customer” (Malaval, 2001, p. 98). Hu (2011) and Chen and Myagmarsuren (2011), in their research, suggest that brand equity is one of the reasons why customers become loyal. Brand equity has become the reflection of customer loyalty and it shows “their willingness to pay a premium price for the brand and/or willingness to continue to purchase.” (Ambler, 2008, p. 416)
In addition to brand equity, recently researchers also found a positive effect of corporate reputation to customer loyalty (Zaman, Bibi, Arshad & Shahzad, 2012; Nguyen, Leclerc & LeBlance, 2013). Both Zaman, Bibi, Arshad, and Shahzad (2012) and Nguyen, Leclerc, and LeBlance (2013) research found that corporate reputation has a direct effect on customer loyalty. Corporate reputation can conveys the signals to customer to show the quality of goods and services the company provides (Lu, Shao & Chen, 2011), thus it leads to customer loyalty.
There is another factor that may increase customer loyalty that is product quality. Customer will expect to get certain level of quality for the price they pay. It is found that the higher the product quality, the higher the level of customer loyalty (Devaraj, Matta & Conlon, 2001; Shum, 2010). This is happened since the quality of the product determines the customer value provided by the company for the customer. The higher customer value will lead to satisfaction and loyalty (Duchessi, 2002).
Thus, this research aims to discuss and analyze how brand equity, corporate reputation, and product quality can influence customer loyalty toward XYZ newspaper in Surabaya.
LITERATURE REVIEW
Brand Equity
Keller (2008) introduced customer-based brand equity concept which highlights the perspective of the customer toward the brand as he believed that “the power of a brand lies in what resides in the minds of customers” (p. 48). With this approach, Keller (2008) defined customer-based brand equity as “the differential effect that brand knowledge has on consumer response to the marketing of that brand” (p. 48). He also added that positive customer-based brand equity happened “when consumers react more favorably to a product and the way it is marketed when the brand is identified than when it is not” (p. 48).
42 as its dimensions. The power of this model lies in “what customers have learned, felt, seen, and heard about the brand as a result of their experiences over time” (p. 48).
Elliott and Percy (2007) defined brand awareness as how likely consumers familiar with a brand either they are stimulated by seeing the brand at the point-of-purchase or they remember the brand when the need of products or services occur. Brand awareness is indicated when “someone sees the product in a store and decides they want it or are reminded that they need it” (p. 237) and “one must remember the brand name in order to ask for the product” (p. 238). Keller (2008) has similar opinion to describe brand awareness. It “is related to the strength of the brand in memory, as reflected by consumers’ ability to identify various brand elements like the brand name, logo, symbol, characters, packaging, and slogan under different situation” (p. 374).
According to Keller (2008), brand image is “consumers’ perception about a brand, as reflected by the brand associations held in consumer memory” (p. 51). Shimp (2010) described brand image as “the associations that are activated in memory when people think about a particular brand” (p. 39). Kotler and Pfoertsch (2010) argue that brand image “consists of the attributes and associations that consumers connect to a brand; then can be ‘hard’, specific tangible, functional attributes of the brand, or ‘soft, emotional-based attributes of the brand such as trustworthiness or dullness” (p. 314).
For a brand to have positive customer-based brand equity, the consumer image toward the brand have to be stronger, more favorable, and unique (Keller, 2008; Heding, Knudtzen & Bjerre, 2009). In order to enhance the strength of brand image, the image of a brand should be personal relevance and consistent (Keller, 2008). Next, the favorability of brand image depends on how desirable the relevant attributes are and how consistent the attributes able to be delivered (Keller, 2008; Heding, Knudtzen & Bjerre, 2009). For the uniqueness of brand image, a brand has to have attributes which become unique selling point of the brand. The uniqueness “should ideally not be shared by competing brands” (Heding, Knudtzen & Bjerre, 2009, p. 95).
Corporate Reputation
According to Hannington (2004), corporate reputation is “a perception of an organization’s ability to meet the expectations of its stakeholders. It describes the rational and emotional attachments that they form with the organization” (p. 9). Davies (2011) explained corporate reputation in two complementary ways which are “as our expectations of an organization’s future actions based upon out prior experience and as the accumulated impression that stakeholders form of the firm, resulting from their interactions with, and any communications they receive about, the firm” (p. 50).
Based on the Reputation Quotient model of corporate reputation (Fombrun & Foss, 2001), there are six dimensions of reputation namely product and services, financial performance, vision and leadership, working
environment, social responsibility, and emotional appeal. In this research author focuses on consumer perspective of corporate reputation, thus author takes three dimensions of corporate reputation in terms of its products and services, social responsibility, and emotional appeal as the construct of corporate reputation.
According to Pride and Ferrell (2014) a product is “a good, a service, and idea, or any combination of the three received in an exchange” (p. 286). Products and services can be indicated based on the perceptions of the quality, innovation of the company toward its products and services, value of the company products and services (Fombrun & Foss, 2001).
Carroll and Buchholtz (2008) defined social responsibility by corporate as “seriously considering the impact of the company’s actions on society” (p. 39) and it reflects “the obligation of decision makers to take actions which protect and improve the welfare of society as a whole along with their own interests” (p. 39). Social responsibility can be measured by the perceptions of the company as a good citizen in its dealings with communities, employees, and the environment (Fombrun & Foss, 2001).
Jorgensen (1998) defined emotional appeal as “a quality of a message” (p. 408). It preceded the experiences and onset of emotion. Emotional appeals are “designed to persuade people by playing on their feelings rather than appealing to their intellect” (Wrick, 2012, p. 293). Fombrun and Riel (2004) argued that “there’s no reputation building without emotional appeal” (p. 91) and they have studied that emotional appeal is one of the primary driver of reputation. To define emotional appeal in corporate context, based on their study Fombrun and Riel (2004) said “you simply like, admire, or trust the company” (p. 52).
Product Quality
According to Garvin (1984) product quality based on user-based approach is a personal view of quality focuses on the capacity of goods or services to satisfy or exceed the wants of specific consumer as each individual has their own preferences (Garvin, 1984; as cited in Kelemen 2003).
There are eight dimensions or indicator of product quality by Garvin (1984) which is also adopted by other authors and researchers (Kelemen, 2003; Omachonu & Ross, 2004; Yuen & Chan, 2010). The eight dimensions are namely performance, features, reliability, conformance, durability, serviceability, aesthetics, and perceived quality. Reliability, conformance, durability, and serviceability dimension of product quality shows the dimension for durable and non-directly consumed product, while newspaper is a non-durable and directly consumed product in terms of its primary function which is providing news (Strydom, 2004). Thus, in this research author uses performance, features, aesthetics, and perceived quality as the construct of product quality.
43 primary operating characteristics of a product. For newspaper, the primary function is to give information through news to help people learn about their environment (Applegate, 2011). The information is served in the major news story (Friedlander, 1982). Applegate (2011) believed that the treatment of the information should be straightforward, factual, and impersonal. Keeble (1998) added notions of accuracy, objectivity, and neutrality as the measurement for primary operating characteristics of newspaper.
Features are “the added characteristics of a physical good” and “such added characteristics do not contribute to the actual operation of the physical good but add more comfort to it” (Kelemen, 2003, p. 54). At newspaper, feature includes the rubric aside the main news such as comic strips, games, puzzles, competitions, and feature stories Granato (2002). Thus the features will be measured by its creativity, interest, and entertainment.
Aesthetics emphasize on “how a product looks, feels, sounds, tastes, or smells” (Garvin, 1987, p. 105). Mazzalovo (2012) measured aesthetics through two dimensions which is complexity and structural order. Complexity includes multiplicity and diversity, while structural order includes harmony, unity, and order.
The last dimension is perceived quality. Here, “products will be evaluated less on their objective characteristics than on their image, advertising, or brand names” (Garvin, 1984, p. 32). Chumpitaz and Paparoidamis (2009) mentioned that to measure perceived quality customer will compare expectations against perceived performance and do overall evaluation on product’s superiority.
Customer Loyalty
Griffin (2005) defined loyal customer as customer who make repeated purchase regularly, buy products and services across brand from the same company, give referral to other people, and show immunity to other competitor attraction. Sugandhi (2003) saw customer loyalty as “the measure of success of the supplier to retain the customer with him” (p. 139). The customer sticks to the seller although there are other options available. He concluded that customer loyalty also can be described as “the tendency of a customer to choose voluntarily a particular supplier repetitively for his requirement” (p. 139).
For having loyal customer, there are some positive outcomes and the outcomes of loyalty is long-term and cumulative (Griffin, 2005). The longer the term of customer loyalty, the more profit the company will get. The company will be able to cut cost in some activities such as marketing cost to attract new customer, transaction cost, and customer turnover cost. In addition, as the loyal customer has high familiarity toward the company and the product, cross-selling sale and repurchase possibility will increase, while attrition or customer defection rates will decrease (Griffin, 2005; Allen & Wilburn, 2002). Satisfied customer is also most likely to tell their pleasant experience to other people which increase the word-of-mouth (Griffin, 2005).
Word-of-mouth itself is known as one of the most effective marketing strategy to attract new customer (Lori, 2007).
Research Hypotheses
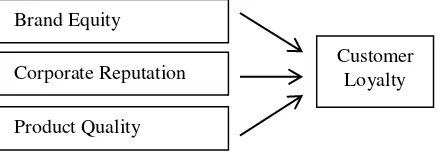
Brand equity, corporate reputation, and product quality are believed to be the factors that can influence customer loyalty. Brand equity is able to increase the value of the brand so that the customer can get more value when buying the product where this can lead to customer loyalty. In addition, corporate reputation signals the quality of goods and services that the company provides and it is able to increase the confidence of the customer toward the product therefore it can influence the customer loyalty. Furthermore, the product quality can enhance the customer experience when using the product and is able to stimulate customer to be more loyal. As brand equity, corporate reputation, and product quality individually are able to influence the customer loyalty, then it is believed that the three factors altogether is also able to influence the customer loyalty.
Figure 1. Hypothesized Model
H1: Brand equity, corporate reputation, and product quality simultaneously have significant influence on customer loyalty toward XYZ newspaper in Surabaya
H2a: Brand equity has significant influence on customer loyalty toward XYZ newspaper in Surabaya
H2b: Corporate reputation has significant influence on customer loyalty toward XYZ newspaper in Surabaya
H2c: Product quality has significant influence on customer loyalty toward XYZ newspaper in Surabaya
RESEARCH METHOD
Quantitative research method is adopted in this research since through quantitative research author will be able to achieve the research objective by describing and explaining the strength and direction of cause-effect relationship between the independent and dependent variables in precise measurement (Cooper & Schindler, 2011). As numerical data is needed to explain certain phenomena, in this research questionnaires will be the instrument of numerical data collection.
In this research, author uses comparative causal research as it analyzes the cause and effect relationship between brand equity, corporate reputation, and product quality on customer loyalty toward XYZ newspaper in Surabaya where brand equity, corporate reputation, and
Brand Equity Corporate Reputation Product Quality
44 product quality as the independent variables and customer loyalty as the dependent variable (Kuncoro, 2009).
The measurement items for customer loyalty are adapted from the previous studies measuring customer loyalty from Griffin (2005). The measurement items for brand equity are adapted from the previous studies measuring brand equity from Elliott and Percy (2007), Kotler and Pfoertsch (2010), and Keller (2008). The measurement items for corporate reputation are adapted from the previous studies measuring corporate reputation from Fombrun and Foss (2001) and Fombrun and Riel (2004). The measurement items for product quality are adapted from the previous studies measuring product quality from Applegate (2011), Keeble (1998), Garrison (2010), Granato (2002), Mazzalovo (2012), and Chumpitaz and Paparoidamis (2009).
At the questionnaires, the screening questions use simple attitude scale to gain the data. At the screening questions, author provides multiple-choice answers for the respondent. Thus, the screening questions’ type of data is nominal scales. In the other hand, the target questions where the data regarding the respondents’ response toward XYZ newspaper’ brand equity, corporate reputation, product quality, and customer loyalty is gathered using 5-point Likert scales where 1 refers to “strongly disagree” and 5 refers to “strongly agree” reflecting the use of interval data (Cooper & Schindler, 2011).
In this research, primary data will be gathered from the respondents as the primary source of data through questionnaires. To complement the analysis of primary data, author takes other data from secondary data from secondary sources such as books, journals, newspaper and internet articles, website, and other literatures. From secondary source of data, author believes it can support the data analysis of the primary data and construct a comprehensive analysis of the effect of brand equity, corporate reputation, and product quality of XYZ newspaper on the customer loyalty.
The questionnaires will be distributed based on random sampling method to the population which is the customers of XYZ newspaper which domicile in Surabaya. Customers of XYZ newspaper refer to the people who ever purchased and read XYZ newspaper. The time limit for buying and read XYZ newspaper is in the last 3 months to make sure that the customer still remembers about the content of the product. To increase the accuracy of the research, for the population, author gives minimum age limit which is 17 years old as it is considered as the target market of XYZ newspaper according to Mr. Ardani Hendarta, as the business representative manager of PT XYZ newspaper East Java bureau (A. Hendarta, personal communication, March 20, 2014). The minimum sample is N ≥ 50 + 8m (Green, 1991) where m represents the number of predictors or independent variables. In this research, there are three independent variables which are brand equity, corporate reputation, and product quality. It means the minimum sample size of this research should be 74 so that the analysis can be run.
In order to have a comprehensive and good research, good measurement tool should be used (Cooper & Schindler, 2011). Validity and reliability of data are two tools that can evaluate whether a measurement tool is good enough. Validity of data refers to the state whether a research instrument is able to measure for what it means to measure (Cooper & Schindler, 2011). To test the validity of data, the calculated r of all indicators should be compared to a critical r, which can be found in r table (Di Fabio, 2013).
Reliability of data refers to the evidence that a measure supplies consistent results over time and over conditions (Cooper & Schindler, 2011). Reliability of data of this research is tested through the coefficient alpha or Cronbach’s alpha. If the value of Cronbach’s alpha is higher than 0.7, it can be expected that the measurement tool is reliable (Mujis, 2011).
Multiple regression is chosen for the analysis technique as this research has one dependent variable with more than one independent variable and both variables are metric. Following is the equation developed to explain the how multiple regression works (Cooper & Schindler, 2011):
= � + � + � + ⋯ + �� �+ �
In multiple regression analysis, there are three criteria of goodness-of-fit to determine the significant of the statistic model which are F-test, t-test, and coefficient of determination (Kuncoro, 2009) which all will be used to test the hypotheses that have been developed.
RESULTS AND DISCUSSION
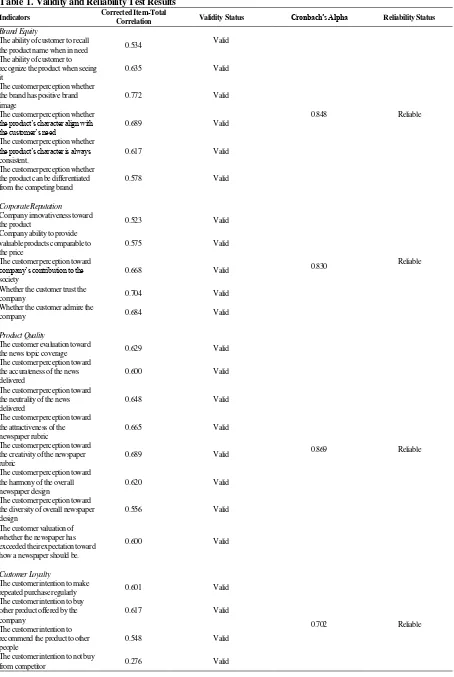
The fitness of brand equity, corporate reputation, product quality, and customer loyalty measurement items are measured through several steps. As the first step, the validity test for measurement items are conducted by comparing the calculated r to critical r (Di Fabio, 2013). The calculated r available in column Corrected Item-Total Correlatiion (Table 1) of all measurement items is more than the critical r which is 0.239. Thus, it indicates that the indicators of the variables are valid.
The reliability test for measurement items are conducted by comparing the Cronbach’s Alpha with the critical value which is 0.7 (Mujis, 2011). The calculated Cronbach’s Alpha (Table 1) of every variable is more than 0.7. Thus, it can be concluded that the indicators of the variables are reliable.
45 Table 1. Validity and Reliability Test Results
Indicators Corrected Item-Total
Correlation Validity Status Cronbach’s Alpha Reliability Status
Brand Equity
The ability of customer to recall
the product name when in need 0.534
Valid
0.848 Reliable
The ability of customer to recognize the product when seeing it
0.635 Valid
The customer perception whether the brand has positive brand image
0.772 Valid
The customer perception whether
the product’s character align with
the customer’s need 0.689 Valid
The customer perception whether
the product’s character is always
consistent.
0.617 Valid
The customer perception whether the product can be differentiated from the competing brand
0.578 Valid
Corporate Reputation
Reliable Company innovativeness toward
the product 0.523 Valid
0.830 Company ability to provide
valuable products comparable to the price
0.575 Valid
The customer perception toward
company’s contribution to the
society
0.668 Valid
Whether the customer trust the
company 0.704 Valid
Whether the customer admire the
company 0.684 Valid
Product Quality
The customer evaluation toward
the news topic coverage 0.629 Valid
0.869 Reliable
The customer perception toward the accurateness of the news delivered
0.600 Valid
The customer perception toward the neutrality of the news delivered
0.648 Valid
The customer perception toward the attractiveness of the newspaper rubric
0.665 Valid
The customer perception toward the creativity of the newspaper rubric
0.689 Valid
The customer perception toward the harmony of the overall newspaper design
0.620 Valid
The customer perception toward the diversity of overall newspaper design
0.556 Valid
The customer valuation of whether the newspaper has exceeded their expectation toward how a newspaper should be.
0.600 Valid
Customer Loyalty
The customer intention to make
repeated purchase regularly 0.601 Valid
0.702 Reliable
The customer intention to buy other product offered by the company
0.617 Valid
The customer intention to recommend the product to other people
0.548 Valid
The customer intention to not buy
46
Table 4. Coefficents Table of Regression Model Unstadardized
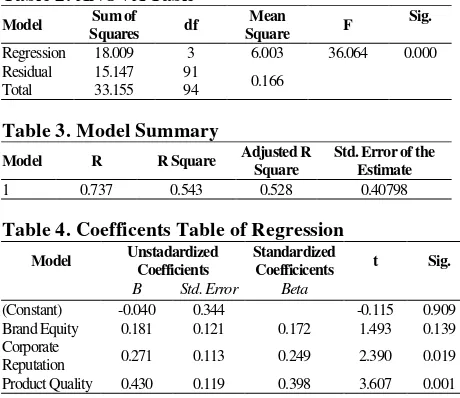
customer loyalty toward XYZ newspaper in Surabaya. As shown in Table 3, the adjusted R2 is 0.528 or 52.8%.
This indicates that brand equity, corporate reputation, and product quality as the three independent variables can explain the variation of customer loyalty as dependent variables for 52.8%. The remaining 47.2% is explained by other factors that are not included in the regression model.
For the next three hypothesis testing, t-test is used. The t value of each variable is 1.493, 2.390, and 3.607 for brand equity, corporate reputation, and product quality respectively as shown in Table 4. The critical t value with 0.05 alpha level and degrees of freedom by 94 is 1.9855. The t value of brand equity is lower than the calculated t, thus the null hypothesis for H2a fails to be rejected. This indicates that brand equity does not have significant influence on customer loyalty toward XYZ newspaper in Surabaya. For H2b and H2c, both null hypotheses are rejected since the value of calculated t is higher than the value of critical t. Thus, it is accepted that corporate reputation and product quality individually have significant influence on customer loyalty toward XYZ newspaper in Surabaya. From the standardized coefficient beta, it tells which of variable having the most influence on the dependent variable by directly comparing the value variable (Jr., Celsi, Money, Samouel & Page, 2011). Corporate reputation and product quality has standardized coefficient beta of 0.249 and 0.398. From this value, it can be determined that in the regression model, product quality has the highest influence on customer loyalty toward XYZ newspaper in Surabaya. If the other two independent variables are constant, for a one-standard deviation increase in product quality, the standard deviation of customer loyalty will increase for 0.398.
According to previous studies by Hu (2011), Zaman, Bibi, Arshad, and Shahzad (2012), Nguyen, Leclerc, and LeBlance (2011), and Shum (2010), brand equity, corporate reputation, and product
quality individually have significant influence on customer loyalty toward XYZ newspaper in Surabaya. The findings of this research found that all of those three factors are able to influence customer loyalty toward XYZ newspaper in Surabaya significantly and 52.8% variation of customer loyalty toward XYZ newspaper in Surabaya can be explained by those three factors.
The other findings of this research suggest that brand equity individually does not have significant influence on customer loyalty. Comparing the result with the previous research journal about brand equity, there is a difference in it. Hu (2011) made a research regarding brand equity and customer loyalty. It is hypothesized that brand equity has significant and positive relationship to customer loyalty. The regression analysis toward the variables confirmed that it is true that brand equity has significant and positive relationship to customer loyalty.
In contrary to Hu’s research, in this current research brand equity of XYZ newspaper does not have significant influence on customer loyalty toward XYZ newspaper in Surabaya. The possible reason behind this difference is due to the research object. Hu’s research focused on electrical consumer products which is digital camera, while the current research object is a media product which is newspaper. In buying electrical consumer products, it involves higher risks such as risk of cost and time. In the other hand, when buying newspaper there is lower risk of cost and time compare to the situation when consumer buy electrical products (Chan-Olmsted, 2008). It suggests that consumers might “less likely to depend on familiar brands to reduce risk of bad purchases” (Chan-Olmsted, 2008, p. 70) and this makes the effect of brand equity on customer loyalty is matter more in buying electrical consumer products compare to in buying media product such as newspaper.
For corporate reputation and product quality, both individually have significant influence on customer loyalty toward XYZ newspaper in Surabaya. Previously in their studies, Zaman, Bibi, Arshad, and Shahzad (2012) hypothesized that corporate reputation has a direct effect on customer loyalty and Nguyen, Leclerc, and LeBlance (2011) hypothesized that the more positive the customer’s perception is of a firm’s reputation, the greater is the trust in the firm. Both of previous journals about corporate reputation confirm the result of current research that corporate reputation has significant influence to customer loyalty of XYZ newspaper’ buyer in Surabaya.
47 increase wellness of the society. Customer might also compare the ability of the company in providing valuable and innovative product to the product price. If the customer has a good impression toward the reputation of the company, customer tends to be more loyal as how this research result shows.
Regarding the product quality Shum (2010), in his previous research, he hypothesized that product quality has a positive effect on customer satisfaction for fast fashion retailers. It is also hypothesized that customer satisfaction has a positive effect on customer loyalty for fast fashion retailer. From the analysis, it is found that product quality significantly affects customer satisfaction and customer satisfaction significantly affects customer loyalty. This previous research journal about product quality confirms the result of current research that product quality has influence on customer loyalty.
CONCLUSION
This research aims to know the influence of brand equity, corporate reputation, and product quality simultaneously and individually on customer loyalty toward XYZ newspaper in Surabaya. To achieve the research objectives, several hypotheses about brand equity, corporate reputation, product quality, and customer loyalty have been tested throughout this research. The hypotheses are that brand equity, corporate reputation, and product quality simultaneously and individually have significant influence on customer loyalty toward XYZ newspaper in Surabaya. Primary data collections to test the hypotheses have been done through questionnaires filled by respondents. Based on the result of multiple regression analysis through the 95 collected questionnaires that have been distributed among the research population, brand equity, corporate reputation, and product quality simultaneously have significant influence on customer loyalty toward XYZ newspaper in Surabaya. It indicates that customer experience and evaluation toward brand equity, corporate reputation, and product quality of XYZ newspaper altogether will affect their loyalty toward XYZ newspaper.
Another analysis through multiple regression is also done to know the effect of each factor individually on customer loyalty toward XYZ newspaper in Surabaya. According to the result of the analysis, brand equity as individual does not have significant influence on customer loyalty toward XYZ newspaper in Surabaya. But the other two factors namely corporate reputation and product quality individually have significant influence on customer loyalty toward XYZ newspaper in Surabaya.
Based on the result of data analysis, in the model, product quality becomes the factor that has highest influence on customer loyalty. If the customer evaluation toward the newspaper quality has an increasing score, the chance of the customer to become loyal is higher. There are some dimensions of product quality used in this research namely performance, features, aesthetics, and perceived quality. XYZ newspaper can enhance its product quality through its feature which is the newspaper rubric. The suggestions made regarding the newspaper rubric is by
conducting a rubric proposal competition. Such competition will enable XYZ newspaper to increase the creativity and attractiveness of the rubric as the participant will compete to make the best rubric concept.
Regarding the corporate reputation, one of the indicators of corporate reputation is how customer evaluates the company’s contribution to the society. It is suggested to do a CSR in a form of open discussion which is purported to educate the society for their literacy of economics, politic, social and other issue. This can be a great opportunity for XYZ newspaper to contribute to the society. The open discussion can invite university student or people from higher group of age once a month takes place in different university or other convenient places.
Based on the result of the first hypothesis testing, brand equity, corporate reputation, and product quality can simultaneously influence the customer loyalty level. Therefore, it is also important for XYZ newspaper to make a strategy which elaborate brand equity, corporate reputation, and product quality where positive brand image, product innovation, give more value, and exceeding customer expectation are some of their indicators. Hence, author suggests improving and re-introducing XYZ newspaper ePaper. XYZ newspaper ePaper facilitates its customer who has subscribed the printed XYZ newspaper with the digital newspaper. The ePaper gives new alternative for its customer by allowing them to read what is printed in printed XYZ newspaper in laptop, tablet, or smartphone and have news update through XYZ newspaper Siang. The ePaper itself can also give customer more valuable product relative to the subscription price as it gives more facility to the customer. As the research result have shown, if customer evaluation toward brand equity, corporate reputation, and product quality increase, the customer loyalty will increase. Thus, it is worth for XYZ newspaper to improve and re-introduce its ePaper.
There are also some limitations of the research that should be understood. The first is the topic coverage. This research discusses the customer loyalty of XYZ newspaper in Surabaya and the hypotheses are built by three factors which are brand equity, corporate reputation, and product quality. But based on the finding of adjusted R2 which is
52.8%, the three factors do not explain the whole customer loyalty variance. Those factors apparently only explain half of the customer loyalty variance. It indicates that there are many other factors that can be explored related to customer loyalty other than those three. The further research can apply similar independent variable with different population such as people domicile in other cities where XYZ newspaper has low market share but is considered as a potential source of revenue.
48 Further research for similar topic can apply the qualitative research method where the research will aim to have a deeper understanding and result in deeper explanation why the customer becomes loyal to XYZ newspaper.
The third limitation of the research is the sample size. According to the theory about sample size used in this research, it requires only minimum 74 respondents. Author is able to collect 95 questionnaires completely filled by respondents. For other needs, such as a more detailed analysis based on certain subgroups and compliance to standard of XYZ newspaper’ Litbang, sample size of 95 may not an enough sample size. The further research may want to add the number of sample.
REFERENCES
Allen, D. R. & Wilburn, M. (2002). Linking customer and employee satisfaction to the bottom line. Wisconsin: ASQ.
Ambler, T. (2008). Marketing metrics (21). In Baker, M. & Hart, S. J. (Eds.). The Marketing Book (pp. 414-427). Oxford: Elsevier Ltd.
Applegate, E. (2011). Journalism in the United States: Concepts and issues. Maryland: Scarecrow Press, Inc.
Berger, A. A. (2007). Media and society: A critical perspective. Maryland: Rowman & Littlefield Publishers, Inc.
Carroll, A. B. & Buchholtz, A. K. (2008). Business and society: Ethics and stakeholder management. Mason: South-Western Cengage Learning.
Chan-Olmsted, S. M. (2008). Competitive strategy for media firms: Strategic and brand management in changing media markets. New Jersey: Lawrence Erlbaum Associates, Inc.
Chen, C., & Myagmarsuren, O. (2011). Brand equity, relationship quality, relationship value, and customer loyalty: Evidence from the telecommunications services. Total Quality Management & Business Excellence. Retrieved
February 14, 2014, from
http://cht.tcm.ncku.edu.tw/attachments/
Cooper, D. R. & Schindler, P. S. (2011). Business research methods (11th ed.). Singapore: McGraw-hill Education.
Chumpitaz, R. & Paparoidamis, N. G. (2009). Services marketing: An overview and relational approach of the B2B setting (19). In Newlands, D. & Hooper, M. J. (Eds.), The global business handbook: The eight dimensions of international management (pp. 307-324). Surrey, England: Gower Publishing Limited.
Davies, G. (2011). The meaning and measurement of corporate reputation (2). In Burke, R. J., Martin, G., & Cooper, C. L. (Eds.), Corporate reputation: managing opportunities and threats (pp. 45-60). Surrey, England: Gower Publishing Limited.
Devaraj, S., Matta, K. F. & Conlon, E. (2001). Product and service quality: The antecedents of customer loyalty in the automotive industry. Production and Operations Management,10(4), 424-439. Retrieved February 26, 2014, from ABI/INFORM Global (proquest) database.
Di Fabio, R. P. (2013). Essentials of rehabilitation research: A statistical guide to clinical practice.
United States of America: F. A. Davis Company. Duchessi, P. (2002). Crafting customer value. United States
of America: Purdue University.
Durkin, D. M. (2005). The loyalty advantage. New York: The Loyalty Factor, LLC.
Elliott, R. & Percy, L. (2007). Strategic brand management.
New York: Oxford University Press Inc.
Fombrun, C. J. & Foss, C. B. (2001). Developing a Reputation Quotient, The Gauge, 14(3), 1-4. Retrieved March 13, 2014 from http://www.reputationinstitute.com/frames/press/01 _15_14_GUAGE.pdf
Fombrun, C. J. & Riel, C. B. M. V. (2004). Fame & fortune: How successful companies build winning reputations. Upper Saddle River, NJ: Pearson Education, Inc.
Friedlander, E. J. (1982). A concise guide to newspaper feature writing. United States of America: University Press of America, Inc.
Garrison, B. (2010). Professional feature writing. New York: Routledge.
Garvin, D. A. (1984). What does “product quality” really mean? Sloan Management Review, Fall, 25-43. Granato, L. (2002). Newspaper feature writing. New South
Wales: UNSW Press Ltd.
Green, S. B. (1991). How many subjects does it take to do a regression analysis? Multivariate Behavioral Research, 26(3), 499-510.
Griffin, J. (2005). Customer loyalty = Menumbuhkan dan mempertahankan kesetiaan pelanggan. (Dwi Kartini Yahya, Trans.). Jakarta: Erlangga.
Hannington, T. (2004). How to measure and manage your corporate reputation. Hants, England: Gower Publishing Limited.
Heding, T., Knudtzen, C. F. & Bjerre, M. (2009). Brand management: Research, theory and practice. New York: Routledge.
Hitipeuw, J. (Eds.). (January 28, 2012). Bisnis media cetak masih berpeluang. Kompas.com. Retrieved
February 24, 2014, from
http://bisniskeuangan.kompas.com/
49 Retrieved February 13, 2014 from ABI/INFORM Global (Proquest) database.
Jorgensen, P. F. (1998) Affect, persuasion, and communication processes (15). Handbook of Communication and Emotion: Research, Theory Application, and Contexts (pp. 404-423). California: Academic Press. New York: M. E. Sharpe, Inc. Keeble, R. (1998). The newspapers handbook. New York:
Routledge.
Kelemen, M. L. (2003). Managing quality. London: SAGE Publications Ltd.
Keller, K. L. (2008). Strategic brand management (3rd ed.). New Jersey: Prentice Hall.
Kotler, P. & Pfoertsch, W. (2010). Ingredient branding: Making the invisible visible. New York: Springer-Verlag Berlin Heidelberg.
Kuncoro, M. (2009). Metode riset untuk bisnis & ekonomi
(3rd ed.). Jakarta: Penerbit Erlangga.
Lori, G. (2007). Networking and referrals attract new customers. Rochester Busines Journal, 77, p.23-28. Retrieved February 25, 2014, from ABI/INFORM Global (Proquest) database.
Lu, H., Shao, J., & Chen, K. (2011). An analysis on influencing factors of express company’s customer loyalty (9). In Zhou, M. (Eds.). Advances in Education and Management (64-70). New York: Springer Heidelberg.
Malaval, P. (2001). Strategy and management of industrial brands: Business to business products & services. United States of America: Kluwer Academic Publishers.
Malekian, R. (n.d.). Customer loyalty: Cost vs. benefits - A quantitative approach. Retrieved February 25,
2014, from
http://books.google.co.id/books?id=jdp7nO6gsPoC &printsec=frontcover&source=gbs_ge_summary_r &cad=0#v=onepage&q&f=false
MARS Indonesia. (2009). Perilaku belanja konsumen Indonesia 2009. In Zumar, D. (n.d.). Konsumen koran terus menyusut. Retrieved January 22, 2014, from
http://qalammag.wordpress.com/riset/konsumen-koran-terus-menyusut/
Mazzalovo, G. (2012). Brand aesthetics. London: Palgrave Macmillan.
Mujis, D. (2011). Doing quantitative research in education with SPSS (2nd ed.). London: Sage Publications Ltd.
Murthy, D. N. P. & Blischke, W. R. (2006). Warranty management and product manufacture. United States of America: Springer-Verlag London Limited.
Nguyen, N., Leclerc, A., & LeBlanc, G. (2013). The mediating role of customer trust on customer
loyalty. Journal of Service Science and Management, 6, 96-109. Retrieved February 26, 2014, from ABI/INFORM Global (proquest) database.
Omachonu, V., K. & Ross, J. E. (2004). Principles of total quality (3rd ed.). Florida: CRC Press LLC.
Ots, M. & Wolff, P. (2008). Media consumer brand equity: Implications for advertising media planning. JIBS Research Report,2008-1, 95-112. Retrieved May 20, 2014, from http://www.diva-portal.org/smash/get/diva2:36522/FULLTEXT01.p df
Pew Research Center for the People & Press. (2012). In changing news landscape, even television is vulnerable. Retrieved February 26, 2014, from http://www.people-press.org/2012/09/27/in- changing-news-landscape-even-television-is-vulnerable/
Pride, W. M. & Ferrell, O. C. (2014). Foundations of Marketing. Mason, OH: South-Western Cengage Learning.
Wikan, A. (2011). Masa depan media cetak Indonesia. Jurnal Dewan Pers (5), 1-14. Retrieved February 25, 2014, from http://www.dewanpers.or.id/
Zaman, K., Bibi, S., Arshad, A. & Shahzad, A. (2012). Customer loyalty in FMCG Sector of Pakistan.
Information Management and Business Review, 4(1), 41-48. Retrieved February 14, 2014, from ABI/INFORM Global (proquest) database.
Shimp, T. A. (2010). Advertising, promotion, and other aspects of integrated marketing communications. Mason, OH: South-Western Cengage Learning. Shum, Y. Y. (2010). The effects of perceived product
quality and perceived service quality on customer satisfaction and loyalty in fast fashion retailers. Unpublished undergraduate thesis, The Hong Kong Polytechnic University. Retrieved March 12, 2014, from ABI/INFORM Global (Proquest) database. Strydom, J. (Eds.). (2004). Introduction to marketing. Cape
Town: Juta and Co Ltd.
Sugandhi, R. K. (2003). Customer relationship management. New Delhi: New Age International (P) Ltd., Publishers.
Wrick, J. (2012). Steps to writing well (12th ed.). Mason, OH: South-Western Cengage Learning