403
The Impact of Marketing Mix (7P’s) Towards Fish Feed Customer Satisfaction of PT. Central Proteinaprima in Sidoarjo Area
Yohannes Santoso
International Business Management Program, Petra Christian University Jl. Siwalankerto 121-131, Surabaya
E-mail: santoso.yohannes@gmail.com
ABSTRACT
Customer satisfaction is one of the crucial factors that determines the performance of a company. In Sidoarjo, PT. Central Proteinaprima competes with another companies to control the animal feed market. This research was conducted to determine the effect of the marketing mix (7P's) towards customer satisfaction. Data obtained using simple random sampling method by distributing questionnaires to 132 respondents in Sidoarjo. Data then analyzed using Multiple Linear Regression Analysis. Results from this study indicate that the marketing mix (7P's) overall has significant influence towards fish feed customer satisfaction of PT. Central Proteinaprima in Sidoarjo. Individually, the price has a significant influence on fish feed customer satisfaction of PT. Central Proteinaprima in Sidoarjo.
Keywords: Marketing mix, Customer satisfaction
ABSTRAK
Kepuasan pelanggan merupakan salah satu faktor krusial yang menentukan performa suatu perusahaan. Di Sidoarjo, PT. Central Proteinaprima bersaing dengan perusahaan-perusahaan pakan ternak lainnya untuk menguasai pasar pakan ternak. Penelitian ini dilakukan untuk mengetahui pengaruh dari marketing mix (7P’s) terhadap kepuasan pelanggan. Data diperoleh menggunakan metode simple random sampling dengan mendistribukan kuesioner kepada 132 responden di Sidoarjo. Data kemudian dianalisa menggunakan Multiple Linear Regression Analysis. Hasil dari penelitian ini menunjukkan bahwa marketing mix (7P’s) secara keseluruhan mempunyai pengaruh signifikan terhadap kepuasan pelanggan dari pakan ikan PT. Central Proteinaprima di Sidoarjo. Secara individual, harga mempunyai pengaruh signifikan terhadap kepuasan pelanggan dari pakan ikan PT. Central Proteinaprima di Sidoarjo.
Kata kunci: Bauran pemasaran, Kepuasan pelanggan
INTRODUCTION
In Indonesia, fish feed is considered as main commodity since Indonesia is really good at its fishery. Director General of Processing and Marketing of Fisheries KKP Saut P. Hutagalung said that in general, fishery in Indonesia is still above the majority in ASEAN and is ready to face AEC 2015 (Suharto, 2008). In 2013, Indonesia fish consumption reached 35,62 kg per capita while the other fishery country like Thailand just reached 34,13 kg per capita (Teresia, 2014). Actually, fish feed products in Indonesia is dominated by foreign companies. Minister of fishery, Mrs. Susi stated that 99% of the needs of fish feed comes from foreign countries (Nurhayat, 2014). That is the reason there are so many fish feed companies in Indonesia, for example Cargill
from USA, Cheil Jedang from Korea, Centra Proteinaprima (Charoen Pokphand Group) from Thailand, Japfa Comfeed from Singapore, Grobest from Taiwan, and Laguna from USA. Fish feed market competition is also as stiff as the other market competition.
404
their products to the customers. They also said that in the market, the fish feed products are almost same between one and another companies, so the concern is now changing to which company the customers are feel comfortable with. They said that they often change the way they market their products, whether change the products, change the target market, change the way they approach the customers, but they said that they hold on the marketing mix that they haveagreed on (7P‟s). From those information above,
writer believe that it is very interesting to analyze the
impact of marketing mix (7P‟s) to the customer
satisfaction in fish feed products of PT. Centra Proteinaprima (CPP) in Sidoarjo Area.
LITERATURE REVIEW
This research will discuss further on how PT.
Central Proteinaprima marketing mix attributes (7P‟s)
actually impact the customers‟ satisfaction.
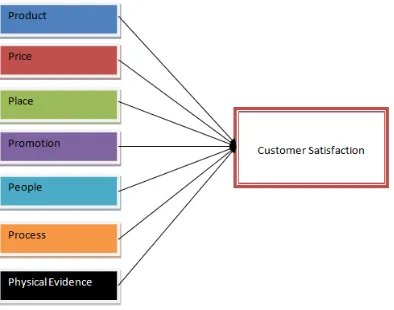
Figure 1. Conceptual Framework
According to The Chartered Institute of
Marketing in “Marketing and 7Ps” as marketing
became a more sophisticated, a fifth „P‟ was added – People. And recently, two further „P‟s were added,
mainly for service that come along within the process of giving the products to the customers – Process and Physical evidence. These considerations are now
known as marketing mix.” (Chartered Institute of Marketing, 2009, p. 4). Using the information before, Bernard H. Booms and Mary J. Bitner were the one who developed the traditional marketing mix that developed by the American Professor of Marketing Jerome McCarthy into the extended marketing mix or services marketing mix. This services marketing mix is also called the 7P model or the 7 Ps of Booms and Bitner. (Vliet, 2011)
The first marketing mix attribute is product. There are many different approaches to concept of product. Jerome McCarthy and William Perreault (2002) define product as an object or service an organization produces on a large scale in a specific volume of units to satisfy the customers. According
to Meagan Van Beest (n.d), product is : The goods a business offers to consumers. The product marketing mix defines all the elements necessary to sell these goods in the marketplace. As part of the overall marketing mix (which also includes price, place and promotion), product plays the most important role in marketing strategy development. Businesses determine their target market, branding and positioning by examining their product benefits and features. (Beest, n.d)
Price is second attribute of marketing mix. Jerome McCarthy and William Perreault (2002) define price as the most important factor for marketing. This is the price the customer pays for a service or product. (McCarthy & Perreault, 2002)
According to The Chartered Institute of Marketing in Marketing and 7Ps (2009): The price of a product or service is determined by all factors that an organization invests during the preparation of the product. For instance material costs, market share, product identity etc. The price of a product may go up or go down depending on time and the price of a certain product may vary because of market developments. (Chartered Institute of Marketing, 2009, p. 4)
There is another definition of price which is a thing that is given in return for a product in a commercial exchange. If the product in the
commercial exchange is a good, then the product‟s price will most likely be called “price.” However, if
the product is a service, then the product‟s price may be mentioned in different word, like fee. (Sage Publication, n.d, p. 3)
Place is an element that represents the available product location, there is possibility that the products are not available in every location or only in certain location (McCarthy & Perreault, 2002). This concept is also similar with The Chartered Institute of Marketing in the journal Marketing and 7Ps (2009) : The place where customers buy a product, and the means of distributing your product to that place, must be appropriate and convenient for the customer. The product must be available in the right place, at the right time, and in the right quantity, while keeping inventory cost at acceptable level. (Chartered Institute of Marketing, 2009, p. 5)
Promotion is the next attribute of marketing mix. Jerome McCarthy and William Perreault (2002) defined promotion as “all the efforts the company or organization makes to stimulate the popularity of their product in the market, for instance by advertising, and
promotional programmes.”
405
consistent message, and above all else give the customer reason to choose your product rather thnsomeone else‟s. (Chartered Institute of Marketing, 2009, p. 5)
Other concept about promotion is any activity to raise awareness of a product or to encourage customers to purchase a product. Advertising is a form of promotion, but not all promotion are advertising. (Caroline, 2013, p. 2)
Booms and Bitner (1981) explained about people as: People who are directly or indirectly involved in the trade of the product or service. These are mainly customer contact employees (contact centre employees, representatives, account managers, etc.), customers, personnel and management. It is mainly the customer contact employees who are the face of the organization and they translate the quality into a service. (Vliet, 2011)
More specifically, Caroline defined people as an essential factor in business because customers make judges based on the service delivered by people representing an organization. For instance, London
2012 Olympics‟s Volunteers demonstrated powerful
effect people can create during service delivery or in other words, the image of London 2012 Olympic somehow depends on the volunteers whom the visitors have contact with. (Caroline, 2013). Mark Acutt (2013) also defined people as the one who
represents product‟s or service‟s image towards the
customer.
Booms and Bitner (1981) defined process as
“the activities, procedures, protocols and more by which the service in question is eventually delivered
to the customer.” (Vliet, 2011). It is explained more by The Chartered Institute of Marketing in the journal Marketing and 7Ps (2009) : The process of giving a service, and the behavior of those who deliver are crucial to customer satisfaction. Issues such as waiting times, the information given, and the helpfulness of the staff are all vital in order to keep customer happy. (Chartered Institute of Marketing, 2009, p. 6)
Process is the first experience of a company that
many customers have. There‟s no value in making
the rest of the company run perfectly if this part is
faulty. As a consequence, this „P‟ could be a great
source of competitive advantage if used wisely. (Chartered Institute of Marketing, 2009, p. 7)
Last but not least, Tim Friesner (2014) added that process is divided into direct activities and indirect activities. Direct activities add value at the customer interface or when the customer experiences the service, while indirect activities often known as back office activities, which support the service before, during, and after product has been consumed.
Physical Evidence is defined by Booms and Bitner (1981) as an environment when service is being delivered from an interaction between an employee and a customer which is combined with a
tangible commodity, for instance brochures, business card, and website of the company. (Vliet, 2011)
The concepts are developed by Caroline (2013) by stating that physical evidence is an element that customers experienced before until after receiving the service. For instance, when a customer walking in to a restaurant and he/she expects a clean and friendly environment, but the fact it is smelly and dirty, he/she likely will walk out of the restaurant even before he/she tastes the food. (Caroline, 2013, p. 3)
There is an increasing interest toward management people in using customer satisfaction as quality measurement. Philip Kotler (2002) defined satisfaction as post-purchase evaluation of product quality given pre-purchase expectation. (2002). John H. Reed and Nicholas later defined customer satisfaction as follows : The degree to which a customer perceives that an individual, firm or organization has effectively provided a product or
service that meets the customer‟s needs in the context
in which the customer is aware of and / or using the product or service. (Reed & Nicholas, 1997)
Other authors also gave definition about customer satisfaction, such as Oliver (1991) in their book, stated that customer satisfaction is evaluative opinion of choice relative to specific purchase (Oliver, 1991). While Fornell (1992) stated that customer satisfaction is as simple as overall evaluation after purchase.
After explaining the concepts of all variables, both independent and dependent, the following hypotheses of this study occur:
H1: There is simultaneous impact of marketing mix
H5: There is individual impact of promotion towards customer satisfaction
406
have both simultaneously and individually impact towards the customers‟ satisfaction.The independent variables of this study will be
marketing mix (7P‟s) attributes, where the dependent
variable is the customers‟ satisfaction.
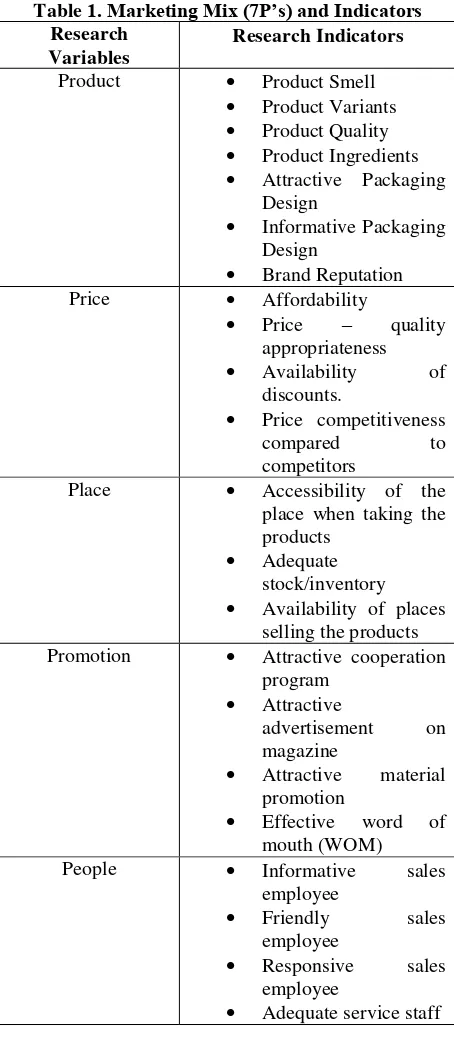
Table 1. Marketing Mix (7P’s) and Indicators Research
Variables
Research Indicators
Product Product Smell
Product Variants Promotion Attractive cooperation
program
People Informative sales
employee
The dependent variable is customer satisfaction and the indicators are the customer satisfaction towards the product, the customer satisfaction towards the price, the customer satisfaction towards the place, the customer satisfaction towards the promotion, the customer satisfaction towards the people, the customer satisfaction towards the process, and the customer satisfaction towards the physical evidence.
Cooper & Schindler (2014), state that there are two main classification of sampling techniques which are probability or representative sampling and non-probability or judgmental sampling.
There are two kinds of sampling: probability sampling and non-probability sampling. Probability sampling is sampling that is done randomly and every population element has the same chance to be selected. This sampling method is used when the population has known the chance of being selected. Furthermore, probability and non-probability sampling is divided into two kinds, which are restricted and unrestricted.
Unrestricted probability sampling is also called simple random sampling. As the name implied, simple random sampling is the sample is chosen randomly as every population has equal possibility to be selected as the subject of a research. This sampling method will provide the least bias among other method (Cooper & Schindler, 2014).
The next type of probability sampling is restricted probability sampling. Restricted probability sampling is called as complex random sampling. Complex random sampling provides more efficient and less expensive compared to simple random sampling.
This research will use Simple Random Sampling method as the sampling method. The population would be the customer of PT. Central Proteinaprima Tbk that is located in Sidoarjo. Sidoarjo is chosen because Sidoarjo is the largest consumer of PT. Central Proteinaprima fish feed products (K.R. Sari, personal communication, February 20, 2015). In this research, researcher will spread the questionnaires to the customers that have used fish feed products from PT. Central Proteinaprima Tbk. According to Pallant (2010), the sample size used is influenced by number of independent variables. The sample size (n) must be bigger than 50 + 8m, in which m is the number of independent variables. Since there are 7 independent variables in this research, the number of respondents needed must be more than 106 (50+8(7)). Thus, the questionnaires will be distributed to 150 respondents, specifically the fish feed user of PT. Central Proteina Prima Tbk.
In this research, researcher will use various analytical methods to achieve the research objectives
which is to know which „P‟ that has the most
significant influence on customer satisfaction. Researcher is using multiple linear regression analysis. Since multiple linear regression is used, researcher has to conduct Validity and Reliability Test and Blue Classic Assumption test to examine the Multicollinearity, Autocorrelation, Heteroscedasticity, and Existence of Normality.
407
analisis multivariate dengan program SPSS 19 edisi 5., 2011).If the r-data for all indicators higher than the r-table, the H0 is accepted means, the measurement tools is valid. The r-data can be seen in the column of corrected item-total correlation that available in the output of the SPSS, gotten when researcher examines
the Cronbach‟s Alpha. r-table is the r value from the 2-tailed r table with the degree of freedom of n – 2, ( n = number of samples) (Ghozali, Aplikasi analisis multivariate dengan program SPSS 19 edisi 5., 2011). In this research, researcher uses inter-item consistency method, which can be measured through
Cronbach‟s Alpha. In the reliability test, the
Cronbach‟s Alpha must not have 0 value, 1 value, and
negative number. The reliability coefficient (alpha) can range from 0 to 1. 0 is representing an instrument with full of error and 1 is representing total absence of error. Acceptable reliability is when the coefficient (alpha) is 0.60 or higher. By having this test, the writers can find out which indicators are not reliable to be used in the analysis (Cooper and Schindler, 2008).
Before processing the data further through multiple regression analysis, the data should go through assumption test to finally get the best linear unbiased estimator (BLUE) result. The data will be go through multicollinearity test, autocorrelation test, heteroscedasticity test, and normality test.
Multicollinearity test is done to check whether there is a relation between independent variables or not (Ghozali, 2013). It can be seen through the value of VIF. If VIF is less than 10, it means that there is no multicollinearity exists (Ghozali, 2013).
Autocorrelation is tested with the purpose to know whether there is correlation between residual in t-period with residual in the previous time (period t-1) (Ghozali, 2013). It is tested by comparing the value of Durbin-Watson gotten in the SPSS output table and value gotten from the Durbin-Watson table. When the value of Durbin-Watson in the SPSS output table is still between the value of upper limit (du) in the Durbin Watson table and the value of 4 – du, it can be concluded that there is no autocorrelation beteween residuals.
As for heterocedasticity test, researcher will use Park test to examine the existence of heteroscedasticity. The level of significance used in this research is 5%. If the significance F (P-value) shown in the SPSS is below the significance 5%, the null hypothesis is rejected or there is heteroscedasticity in the regression model. On the other hand, if the significance F (P-value) of the SPSS output is above the significance level of 5%, the null hypothesis can not be rejected or there is no heteroscedasticity in the regression model (Ghozali, 2011).
Normality test is done for the sake of knowing whether residuals in a regression model have a normal
distribution or not (Ghozali, 2013). To see whether the data is normally distributed or not is by doing Kolmogorov-Smirnov (K-S) Test. If the value of Asymp. Sig. is above significance level (0.05), it means that the residuals are normally distributed.
After going through the assumption test, the data can be processed further using multiple linear regression analysis, in purpose to see wether the independent variables have simultaneously and individually impact to the dependent variable. There
are three results, F-Test, T-Test, and Adjusted R2.
F-Test is used to see whether marketing mix
(7P’s) of PT. Central Proteinaprima have a simultaneously significant impact toward fish feed
customers’ satisfaction. The T-Test is done to know
whether marketing mix (7P’s) of PT. Central
Proteinaprima have a individually significant impact
toward fish feed customers’ satisfaction. Both in F-Test and T-F-Test, independent can be said to have significant impact to dependent if the significance below 0.05. As for Adjusted R2 or Coefficient of Determination, it measures how far the multiple regression model can explain the variance of the dependent variable.
RESULTS AND DISCUSSION
After distributing the questionnaires, finally 132 valid respondents gathered and processed further through validity & reliability test, classic assumption test, as well as multiple linearnregression analysis.
To test the validity, Correlated Item-Total Correlation is used. Referring to research method about validity test, If the r value that is received from calculation is greater than the r table, it means that the instrument is valid. While in this research, researcher got 0.1438 as r from the r table, two-tail, significance 0.05 with df = n – 2, with n is total sample.
408
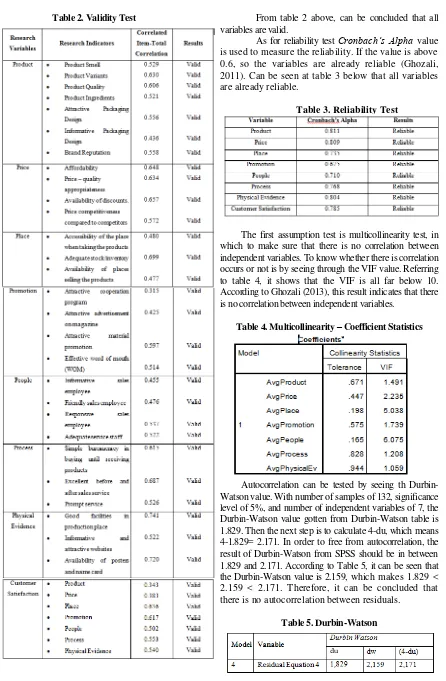
Table 2. Validity Test From table 2 above, can be concluded that all variables are valid.
As for reliability test Cronbach’s Alpha value is used to measure the reliability. If the value is above 0.6, so the variables are already reliable (Ghozali, 2011). Can be seen at table 3 below that all variables are already reliable.
Table 3. Reliability Test
The first assumption test is multicollinearity test, in which to make sure that there is no correlation between independent variables. To know whether there is correlation occurs or not is by seeing through the VIF value. Referring to table 4, it shows that the VIF is all far below 10. According to Ghozali (2013), this result indicates that there is no correlation between independent variables.
Table 4. Multicollinearity – Coefficient Statistics
Autocorrelation can be tested by seeing th Durbin-Watson value. With number of samples of 132, significance level of 5%, and number of independent variables of 7, the Durbin-Watson value gotten from Durbin-Watson table is 1.829. Then the next step is to calculate 4-du, which means 4-1.829= 2.171. In order to free from autocorrelation, the result of Durbin-Watson from SPSS should be in between 1.829 and 2.171. According to Table 5, it can be seen that the Durbin-Watson value is 2.159, which makes 1.829 < 2.159 < 2.171. Therefore, it can be concluded that there is no autocorrelation between residuals.
409
As for heteroscedasticity, it is tested using Park Test. The level of significance used in this research is 5%. If the significance F (P-value) shown in the SPSS is below the significance 5%, the null hypothesis is rejected or there is heteroscedasticity in the regression model. On the other hand, if the significance F (P-value) of the SPSS output is above the significance level of 5%, the null hypothesis can not be rejected or there is no heteroscedasticity in the regression model (Ghozali, 2011). From the table 6 below can be seen that all the significance F value are all above 0.05 means that this research is free from heteroscedasticity.Table 6. Heteroscedasticity – Park Test
Last assumption test is the normality test, to make sure that residuals are normally distributed. Normality will be checked using Kolmogorov – Smirnov Test as the method. Again, the significance value should be bigger than 0.05 in order to pass the normality test. Table 7 below shows that the significance value is 0.958, which is bigger than 0.05. Therefore, it can be concluded that the residuals in the model are normally distributed.
Table 7. Kolmogorov – Smirnov Test
After passing the validity, reliability and assumption test, the data now should be processd further using SPSS Multiple linear regression analysis to see the impact of independent variables to the dependent variable.
Table 8. F-Test ANOVA Table
The purpose of F-Test is to see whether PT. Central
Proteinaprima marketing mix (7P‟s) attributes have a simultaneously significant impact towards fish feed
customers‟ satisfaction through its significance value. From
table 8 above, it is shown that the significance value is 0.000, which is lower than 0.05. It can be concluded that PT. Central Proteinaprima marketing mix (7P‟s) attributes have a simultaneously significant impact towards fish feed
customers‟ satisfaction.
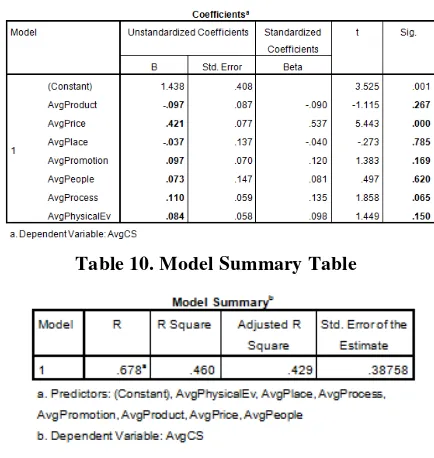
Moving on to the T-Test, in which the purpose is to know whether PT. Central Proteinaprima marketing mix
(7P‟s) attributes have a individually significant impact towards fish feed customers‟ satisfaction.
This table 9 shows results that only price that has significance value of 0.000 (lower than 0.05), which means that price have a significant impact towards customers‟ satisfaction. As for the other variables, all of them do not have individually significant impact toward customers‟ satisfaction.
Table 9. T-Test Coefficient Table
Table 10. Model Summary Table
410
attributes (7P‟s). While the rest, 57.1% can be explained by other attributes or variables outside this regression model.Compared with the results of the research from Yu (2012), which is the Factors and Customers Satisfaction of Budget Hotel Customers in China, the
results were aligned simultaneously. In Yu‟s research
result, marketing mix simultaneously also gives impact towards customer satisfaction of budget hotel customers in China. But individually, the factors that give significant impact are product and promotion. The difference in result can be caused by the difference in industry and products. For instance, the fish feed industry and hotel industry is totally different. Fish feed industry is a business to business industry while hotel is business to consumer industry. In hotel industry, customer preferences are vary from one to another, the one with better economical condition will demand for better facilities, while the lower economical condition will demand for reasonable price or interesting promotion like discounts, while in fish feed industry, the consumers need to get the cheapest price since they can not adjust the selling price as they want, their price are set by the market, so what they can do is just minimizing the cost. Another supporting example, in fish feed industry, products from one company to another are really similar, that is why product is not significant, while in hotel, researcher believes that service offered from one hotel to another hotel is different, that is why product is significant.
Compared with the other previous research from Charoensettasilp & Wu (2013, pp. 107-120), the results were aligned simultaneously, since in their research, marketing mix also gives significant impact
towards the passenger‟s satisfaction. But individually,
the results were quite different, in Charoensettasilp‟s research, place, product, process, and people mostly
affect the Thai passengers‟ satisfaction. These
differences can be also caused by difference in industry, culture, and also in Charoensettasilp‟s research, demographic factors such as gender and
education do affect Thai passengers‟ satisfaction after
receiving services from Thailand domestic low cost airline. The industry differences are quite the same with the first comparison, but for Charoensettasilp‟s research, there are demographic factors that affecting the customer satisfaction, while in fish feed industry, those demographic factors are not affecting the customer satisfaction since there is no difference between male and female also there is no difference in high educated customer and low educated customer (K.R. Sari, Personal Communication, 2015). For instance, in airline industry, highly educated passengers will concern more about safety and understand more about how to use the modern technology inside the airplane to satisfy themselves, while in fish feed industry, whether the consumer is Kermanshah Province. The results were aligned simultaneously; marketing mix gives significant impact towards attracting customers and getting the customers satisfied. While individually, both of the researches show that price also gives significant impact towards the dependent variable.
CONCLUSION
After giving the results of the research, researcher will summarize all the discussions that have been made throughout the research. At the beginning of the research, researcher has developed the statements of research problem, asking whether
the marketing mix (7P‟s) has significant impact
towards customer satisfaction of PT. Central
Proteinaprima Tbk as well as which variable of 7P‟s
has biggest impact towards customer satisfaction. To answer them, researcher then developed hypotheses. As the result, the first hypotheses is answered, the marketing mix (7P‟s) simultaneously giving impact to customer satisfaction of PT. Central Proteinaprima Tbk. However, for latter hypotheses, price is the only variable impacting the customer satisfaction of PT. Central Proteinaprima Tbk.
As the researcher has answered the statements of research problem and the research objectives have been achieved, the research benefit is then able to be provided as the researcher able to develop recommendations for PT. Central Proteinaprima Tbk, on how it can maintain its customer satisfaction towards fish feed products. As shown in the results of the research, PT. Central Proteinaprima has to focus in improving its price since this variable is proven to be the one that has significant impact in increasing customer satisfaction of PT. Central Proteinaprima Tbk. In improving price, PT. Central Proteinaprima Tbk has to emphasize more on the price affordability and price competitiveness. Therefore, as conclusion, PT. Central Proteinaprima Tbk has to improve its performance on the price so that as a whole, improvement in customer satisfaction can be achieved.
Next is benefit for academicians that also have been achieved, as now they can get information for
significance of marketing mix (7P‟s) towards
411
Based on the results of the research, there are some improvements that can be made by PT. Central Proteinaprima Tbk to increase its customer satisfaction using the marketing mix.Price affordability means that PT. Central Proteinaprima Tbk has to provide more affordable price in the customers point of view. PT. Central Proteinaprima Tbk can ask for feedback or comments from the customers whether they think the price has already affordable. While price competitiveness means that PT. Central Proteinaprima Tbk has to provide more competitive price compared with the competitors since in current condition (Table 1.2), the price of fish feed from PT. Central Proteinaprima Tbk is always higher compared with competitors. Therefore, PT. Central Proteinaprima has to find a way to reduce its price into more competitive price while if possible still maintaining its product quality. For instance, PT. Central Proteinaprima can look for a cheaper raw material for production, since price is the factor that matters most to the customer satisfaction. Another possible example might be change the packaging into cheaper packaging since PT. Central Proteinaprima always uses high quality packaging for its fish feed. Other aspects that can be executed is giving discounts for some period.
Having stated the summary and also recommendation of the research to be proposed to PT. Central Proteinaprima Tbk, researcher realizes that there is one limitation within the research, which is limited Scope of the research. Because of the time limitation, the respondents for this research is only located in Sidoarjo. While actually, the market of PT. Central Proteinaprima is also located in other cities. Therefore, this research might be only fully represents the results of Sidoarjo while in other cities the others result might be found. Since there are some limitations in this research, means there are also many rooms to improve for this research. Therefore, researcher provides suggestion for the further research which is increasing scope of the research. As For instance, increasing the scope into East Java.
REFERENCES
Nelson, R. (2012 л February). WPA Research.
Retrieved 2015 л Wednesday-February
from WPA Research:
http://www.wparesearch.com/uncategorized/th e-importance-of-customer-satisfaction/ SSRS. (2014). The Importance of Customer
Satisfaction and Loyalty Research. The Importance of Customer Satisfaction and Loyalty Research , 1.
Oracle. (2011 л September). Customer Experience
Report. 2.
Lorette, K. (n.d). The Importance of Marketing for the Success of a Business. Retrieved 2015 л 18 -February from Small Business: http://smallbusiness.chron.com/importance-marketing-success-business-589.html
Kokemuller, N. (n.d). What Is the Importance of the Marketing Mix in the Development of a Marketing Strategy & Tactics? Retrieved 2015
л 18-February from azcentral: http://yourbusiness.azcentral.com/importance- marketing-mix-development-marketing-strategy-tactics-10502.html
Marketing Theory. (n.d). Retrieved 2015 л 18 -February from Business Case Studies: http://businesscasestudies.co.uk/business- theory/marketing/the-extended-marketing-mix-7ps.html#axzz3S4aCQmKl
Teresia, A. (2014, February). Perikanan Indonesia Masih Unggul di ASEAN. Retrieved 2015, from Warta Perikanan Indonesia: http://www.wpi.kkp.go.id/index.php/compone INDUSTRIES IN INDONESIA. Retrieved from
FAO CORPORATE DOCUMENTARY
REPOSITORY:
http://www.fao.org/docrep/004/ab986e/ab986e 08.htm
Fish Feed. (2014). Retrieved February 19, 2015, from
Matahari Sakti:
http://www.mataharisakti.com/product_fishfee d_prima_feed
Isidro, I. (n.d). Customer : The Key to Survival of Any Business. Retrieved 2015 л 4-March from PowerHomeBiz.com:
412
Chartered Institute of Marketing. (2009). Marketingand 7Ps. The 7Ps of Marketing , 4-7.
Vliet, V. v. (2011, November 16). Service Marketing Mix - 7Ps. Retrieved March 10, 2015, from Toolshero: http://www.toolshero.com/service-marketing-mix-7ps/
Mei Lin, S. (2011). African Journal of Business Management. Marketing Mix (7P) and Performance Assessment of Western Fast Food Industry in Taiwan : An Applicationby Associating DEMATEL and ANP .
McCarthy, J. E., & Perreault, D. W. (1960). Basic Marketing A Global Managerial Approach. Beest, M. V. (n.d). The definition of product Retrieved March 10, 2015, from eNotes MBA: http://www.enotesmba.com/2013/03/marketing -notes-marketing-mix.html
Caroline. (2013). The 7Ps of Marketing. The 7Ps of Marketing-Taking a Wider View , 2.
Acutt, M. (2013, February 18). The 7P's. Retrieved March 10, 2015, from Marketing Mix: http://marketingmix.co.uk/definition/
Friesner, T. (2014, May 8). Process as part of marketing mix. Retrieved March 10, 2015,
from Marketing Teacher:
http://www.marketingteacher.com/process-marketing-mix/
Kotler, P. (2002). Marketing Management : Analysis, Planning, Implementation, and Control. Pearson Custom Publishing. Satisfaction Is Not Customer Loyalty. Retrieved March 10, 2015, from Direct
Yu, Y. (2012). Factors and Customers Satisfaction of Budget Hotel Customers in China.
Charoensettasilp, S., & Wu, C. (2013). International Journal of u- and e- Service, Science and
Technology. Thai Passengers’ Satisfaction after Receiving Services from Thailand's Domestic Low Cost Airline , 107-120.
Saeidi Pour, B., Nazari, K., & Emami, M. (2013). African Journal of Business Management Vol. 7(34). The effect of marketing mix in attracting customers: Case study of Saderat Bank in Kermanshah Province , 3272-3280.
R. Cooper, D., & S. Schindler, P. (2008). Business Research Methods. McGraw-Hill.
Cooper, D. R., & Schindler, P. S. (2014). Business Research Methods. New York: McGraw-Hill/Irwin.
Pallant, J. (2010). SPSS Survival Manual: A step by step guide to data analysis using SPSS, 4th Edition. United Kingdom: Open University Press.
Sekaran, U., & Bougie, R. (2010). Research Methods for Business: A Skill Building Approach: Fourth Edition. UK: John Wiley& Sons. Ghozali, I. (2011). Aplikasi analisis multivariate
dengan program SPSS 19 edisi 5. Semarang: BP Universitas Diponegoro.
Ghozali, I. (2011). Analisis Multivariate Program IBM SPSS 19. Semarang: Badan Penerbit Universitas Diponegoro.
Ghozali, I. (2011). Analisis Multivariate Program IBM SPSS 19. Semarang: Badan Penerbit Universitas Diponegoro.
Syafputri, E. (2014 л 23-December). Separuh biaya budidaya lele untuk beli pakan. Retrieved 2015
л 15-5 from Antara News: Profesional. Jakarta: Alex Media Komputindo. Suharto, E. (2008, March 24). ASEAN 2009 : Time to deal with illegal fishing. Retrieved June 2015,
from The Jakarta Post:
www.thejakartapost.com/news/2008/03/23/ase an-2009-time-deal-with-illegal-fishing.html Badan Pusat Statistik. (2015). Badan Pusat Statistik.
Retrieved from Badan Pusat Statistik: http://www.bps.go.id/Subjek/view/id/56#subje kViewTab3|accordion-daftar-subjek3