49
The Impact of Plaza Indonesia Shopping Mall’s Attributes toward Customers’
Satisfaction
Andrea Marsha
International Business Management Program, Petra Christian University Jl. Siwalankerto 121-131, Surabaya
E-mail: [email protected]
ABSTRACT
This research study is accomplished to understand the impact of mall’s attributes of Plaza Indonesia towards customers’ satisfaction. Plaza Indonesia is known as a leading high-end mall in Jakarta and has other competitors to compete with. Plaza Indonesia needs to be innovative by improving the mall’s attributes such as its environment, convenience, retailers, service, and rewards in order to outstand others and increase their customers’ satisfaction.
The sampling method of this research is using simple random sampling (150 samples), in which the sample is the visitors of Plaza Indonesia that have visited Plaza Indonesia at least twice. Then, it will be analyzed using SPSS multiple regression to see whether the mall’s attributes simultaneously impact the customers’ satisfaction. Also, to see which of the attributes is the most impactful to the customers’ satisfaction. The result of this research shows that all of the mall’s attributes have simultaneously significant impact toward customers’ satisfaction. Individually, service quality is the most significant attribute to impact customers satisfaction, whereas reward is the only attribute that is not significantly impactful to customers’ satisfaction.
Keywords: Mall’s Attributes, Shopping Malls, Customers’ Satisfaction, Shopping.
ABSTRAK
Penelitian in dilakukan untuk mengetahui pengaruh atribut mall dari Plaza Indonesia terhadap kepuasan pelanggan. Plaza Indonesia dikenal sebagai high-end mal yang terkemuka di Jakarta dan memiliki pesaing-pesaing lain untuk saling berkompetisi. Plaza Indonesia perlu menjadi inovatif dengan cara meningkatkan atribut mal seperti lingkungan, kenyamanan, retailers, servis, serta imbalannya untuk mengungguli pesaing lainnya dan meningkatkan kepuasan pelanggannya.
Metode pengambilan sampel menggunakan simple random sampling (150 sampel) dan sampel merupakan pengunjung Plaza Indonesia yang pernah mengunjungi Plaza Indonesia sebanyak dua kali. Kemudian, data akan dianalisa menggunakan SPSS multiple regression untuk melihat apakah atribut secara bersamaan berdampak terhadap kepuasan pelanggan. Dan juga, untuk melihat atribut apakah yang paling berpengaruh terhadap kepuasan pelanggan. Hasil dari penilitian menunjukkan bahwa semua atribut mal memiliki dampak yang signifikan secara simultan terhadap kepuasan pelanggan. Secara individual, kualitas servis merupakan atribut mal yang paling signifikan mempengaruhi kepuasa pelanggan, dimana imbalan menjadi atribut mal yang paling tidak signifikan dalam mempengaruhi kepuasan pelanggan.
Kata Kunci: Atribut Mall, Shopping Mall, Kepuasan Pelanggan, Belanja.
INTRODUCTION
Indonesia is known as the fourth most-populated country in the world with 252,812,245 people (World Population Review, 2014). In the mean time, Jakarta, as the capital city of Indonesia, has total population of 9.77 million people (Central Intelligence Agency, 2014) and contributes more than 13% to Indonesia’s
50 among them is getting tougher and tougher. Moreover, people now spend longer time at malls make it important for the shopping malls to leave decent image to satisfy the customers.
Plaza Indonesia as the leading high-end malls in Jakarta is no exception. They need to compete with others to take the crowds. However, the average numbers of Plaza Indonesia’s visitors per month has decreased significantly in 2012 become 1,116,089 visitors. This problem caused by the presence of many other competitors started to develop and undoubtedly took the crowds (I. Damayantie, personal communication, February 23, 2015). There are also some problems with customers complaining and it surely affects the service quality, which is one of the attributes according to (Wong, Ng, Wong, & Wong, 2012). This research will discuss further on how Plaza Indonesia shopping mall’s attributes (mall’s environment, convenience, the retailers, service quality, and rewards) impact the satisfaction level of its customers. By knowing that, Plaza Indonesia can later improve the attributes to increase their customers’ satisfaction.
Hypothesis testing is performed using SPSS multiple linear regressions with the purpose of answering research objectives as follow:
1. Do Plaza Indonesia shopping mall’s attributes have a simultaneously significant impact towards customers’ satisfaction?
2. Do Plaza Indonesia shopping mall’s attributes individually impact the customers’ satisfaction?
LITERATURE REVIEW
This research will discuss further on how Plaza Indonesia shopping mall’s attributes actually impact the customers’ satisfaction.
Figure 1. Conceptual Framework
According to International Council of Shopping Centers (2015), shopping mall is defined as “a group of retail and other commercial establishments that is planned, developed, owned and managed as a single property, typically with on-site parking provided”.
However, now the concept of shopping mall has shifted from only a place for shopping until become a place for having social activities (Oxford Business Group, 2015). Thus, it is even more important to fulfill customers’ expectation since it is proved that successful in fulfilling customers’ expectation will increase the customers’ satisfaction as well (Kotler, 2000). Shopping malls need to pay attention to the attributes as mall’s environment, convenience, the retailers, rewards, and service quality and see whether that attributes have significant impact to the customers’ satisfaction (Wong, Ng, Wong, & Wong, 2012).
The first mall attribute is mall’s environment. Today, all shopping malls have similarities in almost everything, from tenants, products, and price (Ahmed, Ghingold, & Dahari, 2007). To attract the customers, first, shopping malls should focus on creating distinctive ambient features (Yiu & Yau, 2006). Based on the research from (Wakefield & Baker, 1998), to attract the customers into coming, shopping malls should focus on their exterior design, such as architectural designs (Wakefield & Baker, 1998) and appropriate signage (Alexander & Muhlebach, 1992). Whereas, to make them stay, shopping malls should work on their interior design, like lighting (Joyce & Lambert, 1996) and temperature (Kirkup & Rafiq, 1999).
Convenience is another attribute that keeps demanded by people in visiting shopping malls today (Richbell & Kite, 2007). Now, people spend more time at shopping mall more than they ever do. Therefore, it is very important for shopping malls to leave decent images to the customers in order to increae the customers’ satisfaction level. In seeking of convenience, people demand for shopping malls that have long opening hours and shopping malls that are easy to be reached (Ahmad, 2012). Also, it is proved that successful in fulfilling what customers need will affect customers’ experience through certain shopping malls and their satisfaction as well (Kaufman, 1996).
Retailers are very crucial in influencing customers’ preference to choose a certain shopping mall (Gudonaviciene & Alijosiene, 2013). Without the presence of the retailers, shopping malls are incomplete. Under this shopping mall attribute, there are some things proved to be affecting customers’ experiences, which are the variety of atteding retailers in shopping malls (Ahmad, 2012), the reputation hold by each retailers, as well as the quality of products sold by the retailers (Wong, Ng, Wong, & Wong, 2012).
The following attribute is service quality. Up until now, the term of quality is still difficult to be defined. Yet, it is proved on the previous research that quality of service served to the customers one of important factors in influencing customers’ satisfaction and verified to have a positive relation Shopping Mall’s
Attributes
Mall’s Environment
Convenience
The Retailers
Services Quality
Rewards
51 between one another (Caruana, Money, & Berthon, 2000). In giving the best service to the customers, the role of all staffs inside the shopping malls are equally important. From customer service, tenants’ sales people, the doormen, the security guards, and even the parking attendants are all important to create awesome shopping experience for the customers. It is important for the customer service to be friendly and informative, also for the tenants’ sales people to be friendly and knowledgable about their products (Wong, Ng, Wong, & Wong, 2012). Not only that, the role of each, doormen, the security guards, and the parking attendants are as important to create pleasant shopping experiences during their visits in certain shopping malls. (Singh & Prashar, 2013)
The very last shopping mall’s attribute is rewards. Not only to attract the customers into going to certain shopping malls, shopping malls also need to make sure that their customers will come back again and again. To do such thing, shopping malls can use rewards and loyalty programs to attract the customers into going back again to certain shopping malls (Zakaria, et al., 2014). Not only that, rewards and loyalty programs proved to be affecting customers’ satisfaction and thus will create positive word of mouth and so it will attract more and more customers into coming to certain shopping malls (Zeithaml, Berry, & Parasuraman, 1996; Bridson, Evans, & Hickman, 2008; Chew & Wirtz, 2001). And therefore, there are several sub-attributes, like discounts (Bridson, Evans, & Hickman, 2008), gift vouchers and members’ benefits (Zakaria, et al., 2014) used to support this research further.
The term of customers’ satisfaction has been defined by Kotler (2000) as “person’s feelings of pleasure or disappointment due to a comparison of a product perceived performance with his/ her expectations”. It also means when what customers expect meet or even exceed their wants and needs, that later will lead in higher loyalties and repeats in buying (Anton, 1997). In his research, Westbrook (1981) used non-products related factors that might influence customers’ satisfaction. Therefore, in this research dependent variable will be related to each listed mall’s attributes. And to measure the overall satisfaction, it can be seen whether customers want to repeat their visits to certain shopping mall or not.
After explaining the concepts of all variables, both independent and dependent, the following hypotheses of this study occur:
1. Plaza Indonesia shopping mall’s attributes have a simultaneously significant impact towards customers’ satisfaction.
2. Plaza Indonesia shopping mall’s attributes individually impact the customers’ satisfaction.
RESEARCH METHOD
As said by Cooper & Schindler (2014), there are three types of research studies, which are exploratory studies, descriptive studies, and causal studies. The research method adapted to this research study is the causal study. Using this method, the researchis done to see whether there shopping mall’s attributes have both simultaneously and individually impact the customers’ satisfaction.
The independent variables of this study will be the shopping mall’s attributes, which comprise of mall’s environment, convenience, the retailers, rewards, and service quality. Where the dependent variable is the customers’ satisfaction
Table 1. Mall’s Attributes and Indicators
Attributes Sub - Attributes
Mall’s Environment
The mall has a magnificent architectural design
The mall put appropriate signage outside the shopping mall The mall has a good lighting inside
The mall set a good temperature inside
Convenience
The operating hours of the mall is long enough
The mall can be reached easily The mall provides completely what customers’ needs
The Retailers
The mall has various retailers attending
The retailers in the shopping malls have high credibility The retailers sell high quality products
Service Quality
The customer services are informative
The customer services are friendly
The stores’ sales people are knowledgeable about their products
The stores’ sales people are friendly
52 Source: Ahmad (2012) ; Alexander & Muhlebach (1992) ; Bridson, Evans, & Hickman (2008) ; Joyce &
Lambert (1996) ; Kaufman (1996) ; Kirkup & Rafiq (1999) Singh & Prashar (2013) ; Wakefield & Baker (1998) ; Wong, Ng, Wong, & Wong (2012) ; Zakaria,
et al., (2014) Table 2. The Dependent Variable
Source: Westbrook (1981)
The data collection will be done through distributing the questionnaires to the visitors of Plaza Indonesia. The questionnaire itself will consist of two types of data. Nominal data, which will be used in the classification questions, and Interval data that will be using 5-Point Likert Scale in the target questions.
This research will use both primary and secondary data. The primary data is collected through distributing the questionnaires and interviews while the secondary data gotten through the online journals, website, books, etc.
Among all the sampling methods listed above, the author chooses simple random sampling as the best alternative sampling method to do this research, since author focuses on customers of Plaza Indonesia shopping mall who have at least visited Plaza Indonesia twice as the population and distributes the questionnaires directly to the customers who are on site. The author will approach the customers one by one, ask whether they have visited Plaza Indonesia at least twice and give them the questionnaires. And to count the minimum number of samples need to be collected, the author calculates using the formula from Tabachnick & Fidell (2012).
N > 50 + 8M
N = number of samples
M = number of independent variables
Before processing further the data gotten from the questionnaires, the author has to check and make sure that all of them are valid and reliable. To see whether the data is valid or not, it can be checked through its Chronbach’s Alpha. According to Hair Jr., Black, Babin, & Anderson (2010), a data can be said as reliable if the Chronbach’s Alpha is bigger than 0.6. As for the validity, it can be seen by comparing the r gotten from the questionnaire data and value gotten from r-table for degree of freedom. If the calculated value of r seen bigger compared to the value of r-table and the number is positive, it means that the measured variables are valid and can be proceed further (Ghozali, 2013).
Before processing the data further through multiple regression analysis, the data should go through assumption test to finally get the best linear unbiased estimator (BLUE) result. The data will be go through multicollinearity test, autocorrelation test, heteroscedasticity test, and normality test.
Multicollinearity test is done to check whether there is a relation between independent variables or not (Ghozali, 2013). It can be seen through the value of VIF. If VIF is less than 10, it means that there is no multicollinearity exists (Ghozali, 2013).
Autocorrelation is tested with the purpose to know whether there is correlation between residual in
t-period with residual in the previous time (period t-1) (Ghozali, 2013). It is tested by comparing the value of Durbin-Watson gotten in the SPSS output table and value gotten from the Durbin-Watson table. When the value of Durbin-Watson in the SPSS output table is still between the value of upper limit (du) in the Durbin Watson table and the value of 4 – du, it can be concluded that there is no autocorrelation beteween residuals.
As for heterocedasticity test, it is done for the purpose of checking whether there is a difference between the variance of residual in one observation and another (Ghozali, 2013). According to Ghozali (2013), to detect whether there is heteroscedasticity or not in the model, the author can check by doing Glejser Test in which regressing the residual absolute value towards the independent variables. To make sure that the residual is free from heteroscedasticity, the Sig. T value need to be greater than 0.05.
Normality test is done for the sake of knowing whether residuals in a regression model have a normal distribution or not (Ghozali, 2013). To see whether the data is normally distributed or not is by doing Kolmogorov-Smirnov (K-S) Test. If the value of Asymp. Sig. is above significance level (0.05), it means that the residuals are normally distributed.
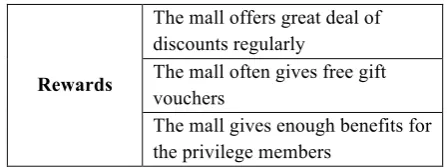
After going through the assumption test, the data can be processed further using multiple linear regression analysis, in purpose to see wether the Rewards
The mall offers great deal of discounts regularly
The mall often gives free gift vouchers
The mall gives enough benefits for the privilege members
Variable Sub – Variables
Customers’ Satisfaction
I am satisfied with the mall’s environment
I am satisfied with the mall’s convenience
I am satisfied with the retailers in the mall
I am satisfied with the quality of the services
I am satisfied with the rewards given by the mall
53 independent variables have simultaneously and individually impact to the dependent variable. There are three results, F-Test, T-Test, and Adjusted R2.
F-Test is used to see wether Plaza Indonesia shopping mall’s attributes have a simultaneously significant impact toward customers’ satisfaction. The T-Test is done to know whether Plaza Indonesia shopping mall’s attributes individually have significant impact towards customers’ satisfaction. Both in F-Test and T-Test, independent can be said to have significant impact to dependent if the significance below 0.05. As for Adjusted R2 or Coefficient of Determination, it measures how far the multiple regression model can explain the variance of the dependent variable.
RESULTS AND DISCUSSION
After distributing the questionnaires, finally 150 valid respondents gathered and processed further through validity & reliability test, classic assumption test, as well as multiple linearnregression analysis.
To pass the reliability test, the Cronbach’s Alpha of both independent and dependent variables have to be at least or bigger than 0.6 (Hair Jr., Black, Babin, & Anderson, 2010). The table below shows that all variables pass the reliability test since the Cronbach’s Alpha is higher than 0.6. Table 3. Reliability Test
Variables Cronbach’s
Alpha
Mall’s Environment .645
Convenience .624
The Retailers .795
Rewards .802
Service Quality .623
Custoemers’ Satisfaction .857 As for validity test, the degree of freedom is 148 (150-2) and significance level of 5%. Then, it can be seen at the r-table, the value gotten is 0.1603. It means, a data is valid if the value under Corrected Item-Total Correlation is higher than 0.1603. The result of the test turned out to show that mall’s environment, convenience, the retailers, service quality, rewards, and customers’ satisfaction are all valid since all of them get the value higher than 0.1603.
The first assumption test is multicollinearity test, in which to make sure that there is no correlation between independent variables. To know whether there is correlation occurs or not is by seeing through the VIF value. Referring to table 4, it shows that the VIF is all far below 10. According to Ghozali (2013), this result indicates that there is no correlation between independent variables.
Table 4. Multicollinearity – Coefficient Statistics
Autocorrelation can be tested by seeing th Durbin-Watson value. With number of samples of 150, significance level of 5%, and number of independent variables of 5, the Durbin-Watson value gotten from Durbin-Watson table is 1.802. Then the next step is to calculate 4-du, which means 4-1.802= 2.198. In order to free from autocorrelation, the result of Durbin-Watson from SPSS should be in between 1.802 and 2.198. According to Table 5, it can be seen that the Durbin-Watson value is 2.194, which makes 1.802 < 2.194 < 2.198. Therefore, it can be concluded that there is no autocorrelation between residuals.
Table 4. Durbin-Watson
As for heteroscedasticity, it is tested using Glejser Test in which the absolute residual value will be regressed towards independent variables. Later, it has to be sure that the significance value is bigger than 0.05 in order to be free from heteroscedasticity. From the table 5 below, it can be seen that all independent variables have the significance value bigger than 0.05, which means that there is no heteroscedasticity between residuals.
Table 5. Heteroscedasticity – Glejser Test
Last assumption test is the normality test, to make sure that residuals are normally distributed. Normality will be checked using Kolmogorov – Smirnov Test as the method. Again, the significance value should be bigger than Coefficientsa
Model
Collinearity Statistics
Tolerance VIF
1 (Constant)
MEavg .497 2.013
Cavg .434 2.306
TRavg .571 1.753
SQavg .447 2.237
Ravg .899 1.112
a. Dependent Variable: CSavg
Model Summaryb
Model R R Square
Adjusted R Square
Std. Error of
the Estimate Durbin-Watson
1 .774a .598 .584 .33524 2.194
a. Predictors: (Constant), Ravg, MEavg, TRavg, SQavg, Cavg b. Dependent Variable: CSavg
!
Coefficientsa
Model
Unstandardized Coefficients
Standardized Coefficients
t Sig.
Collinearity Statistics
B Std. Error Beta Tolerance VIF
1 (Constant) .417 .202 2.062 .041
MEavg -.061 .053 -.133 -1.149 .252 .497 2.013 Cavg -.030 .054 -.069 -.560 .576 .434 2.306
TRavg .063 .042 .163 1.513 .133 .571 1.753
SQavg .042 .054 .093 .763 .447 .447 2.237
Ravg -.063 .035 -.152 -1.769 .079 .899 1.112 a. Dependent Variable: AbsUt
54 0.05 in order to pass the normality test. Table 6 below shows that the significance value is 0.084, which is still bigger than 0.05. Therefore, it can be concluded that the residuals in the model are normally distributed.
Table 6. Kolmogorov – Smirnov Test
After passing the validity, reliability and assumption test, the data now should be processd further using SPSS Multiple linear regression analysis to see the impact of independent variables to the dependent variable.
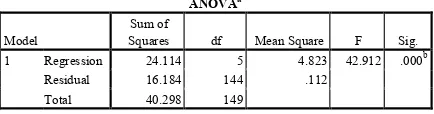
Table 7. F-Test ANOVA Table
The purpose of F-Test is to see whether Plaza Indonesia shopping mall’s attributes have a simultaneously significant impact toward customers’ satisfaction through its significance value. From table 7 above, it is shown that the significance value is 0.000, which is lower than 0.05. It can be concluded that Plaza Indonesia shopping mall’s attributes do actually have a simultaneously significant impact toward the csutomers’ satisfaction.
Moving on to the T-Test, in which the purpose is to know whether Plaza Indonesia shopping mall’s attributes individually have significant impact to the customers’ satisfaction. This table results that only rewards that has significance value of 0.354 (much higher than 0.05), which means that rewards do not have a significant impact towards customers’ satisfaction. As for the other variables, such as mall’s environment, convenience, the retailers, and rewards, all of them actually have individually significant impact toward customers’ satisfaction. From table 8, following equation for this research can be formed: CS = 0.376 + 0.247MEavg + 0.232Cavg + 0.169TRavg + 0.319SQavg - 0.051Ravg + e
Table 8. T-Test Coefficient Table
The equation shows that service quality is the most impactful mall’s attributes compared to others since the beta of the variable is positive and the highest among others with 0.319. The beta of rewards is negative shows that rewards have no significant impact to customers’ satisfaction as also shown at coefficients table above.
Table 9. Model Summary Table
Adjusted R2 is used to see how far the variance of independent variables can actually explain the variance of dependent variable. The bigger the value of the adjusted r2, the better the variance of independent variables in explaining the variance of dependent variable. The value of adjusted r2 of this research model is 0.584 or 58.4 in percentage. This number means that actually 58.4% of the variance of customers’ satisfaction at Plaza Indonesia can be explained by the listed mall’s attributes above, which are mall’s environment, convenience, the retailers, service quality, and rewards. While the rest, 41.6% can be explained by other attributes or variables outside this regression model.
The result of the first hypothesis is actually aligned with all three previous research being used as the main reference journals, in which Plaza Indonesia shopping mall’s attributes have a simultaneously significant impact toward customers’ satisfaction (Ahmad, 2012; Dubihlela, 2014; Wong, Ng, Wong, & Wong, 2012). As individually, there might be similarities and differences found both in this study and in previous study.
The very first mall’s attributes, mall’s environment turned out to have a significant impact towards customers’ satisfaction. This result is actually aligned with the research of Wong, Ng, Wong, & Wong (2012), which proved to also have a significant impact to customers’ satisfaction at shopping mall in Hong-Kong. This result also supports the theory from chapter 2 that due to similiraties of all shopping malls (tenants, price, etc.) (Ahmed, Ghingold, & Dahari, 2007), one needs to differ from the others by creating
Model Summaryb
a. Predictors: (Constant), Ravg, MEavg, TRavg, SQavg, Cavg b. Dependent Variable: CSavg
Asymp. Sig. (2-tailed) .084c
a. Test distribution is Normal. b. Calculated from data.
b. Predictors: (Constant), Ravg, MEavg, TRavg, SQavg, Cavg
55 distinctive ambient features to attract the customers to come into certain mall (Yiu & Yau, 2006). Mall’s environment involves exterior designs and interior atmosphere (Wakefield & Baker, 1998).
Convinience is also proved to be impactful to the customers’ satisfaction, which is also the same with the other two researches from Ahmad (2012) and Wong, Ng, Wong, & Wong (2012). Previously, it has also been explained that shopping mall is no longer a place only to go shopping but also to have any other social activities (Oxford Business Group, 2015). That is why people stay longer at shopping mall than they used to be and surely demand more for convenience in order to have better experience during their visits to the shopping mall (Richbell & Kite, 2007).
Next variable is the retailers available in Plaza Indonesia shopping mall. It is confirmed as well that retailers have a significant impact towards customers’ satisfaction with significance of 0.010. It actually supports the previous study that retailers are very crucial to the existance of a shopping mall and may impact the customers’ satisfaction significantly (Wong, Ng, Wong, & Wong, 2012). This is also proven by Gudonaviciene & Alijosiene (2013) that the attending retailers have also become one important mall’s attributes to be considered before visiting a certain shopping mall.
From the t-test coefficient table (table 8), it can be determined that service quality has become the most significant attribute to influence customers’ satisfaction, proven by having the highest beta of unstandardized coefficient of 0.319. This positive result is in line with the other reference journals that also have proved that the service quality provided both by the shopping mall and by the tenants can influence customers’ experience as well as customers’ satisfaction (Wong, Ng, Wong, & Wong, 2012; Ahmad, 2012). Not only products but services quality also plays a significant role to increase customers’ satisfaction and to affect customers’ decision to revisit certain shopping malls (Sharma, 2014).
While those four attributes above have significantly impact the customers’ satisfaction, rewards turn out to be the only one that does not impact the customers’ satisfaction level at Plaza Indonesia. The result is kind of different compared to other reference journals from Wong, Ng, Wong, & Wong (2012). According to Wong, Ng, Wong, & Wong, (2012), rewards also have a significant impact to customers’ satisfaction at shopping malls in Hongkong. The difference can be caused by the difference in respondents gathered for this research, since this research was conducted in Jakarta, Indonesia while the other was in Hong Kong.
CONCLUSION
This research has achieved the research objectives, which are to know whether Plaza Indonesia shopping
mall’s attribtues have simultaneously impact the customers’ satisfaction. Also to see whether each attribute individually influences the customers’ satisfaction as well and moreover to know which among the independent variables is the most significant in influencing customers’ satisfaction at Plaza Indonesia.
The data gotten has been processed and results have come up. Plaza Indonesia shopping mall’s attributes turn out to simultaneously impact the customers’ satisfaction. Individually, four of the attributes (mall’s environment, convenience, the retailers, and service quality) have a significant impact to customers’ satisfaction. However, there is one attribute, which is rewards, that does not have impact toward customers’ satisfaction. By knowing the results, the research objectives have been reached. Since the research objectives have been achieved, the research benefits have been delivered as well.
Referring to the conclusions above, there are some things can be done by Plaza Indonesia to increae their performance. Since service quality turn out to be the most significant attribute in influencing customers’ satisfaction, it can be beneficial for Plaza Indonesia and customers to create a personal shopper program, in which can increase satisfaction and loyalties of Plaza Indonesia’s customers. Not only that, Plaza Indonesia can give better shopping experiences to their privilege customers so that they will be eager to stay longer because they are treated specially. Again, it is because service quality is so impactful in affecting customers’ preferences and satisfaction. example, the visitors that became the respondents were most likely residents of Jakarta, while actually there are still many other customers that often visit Plaza Indonesia who live in other cities, such as Surabaya, Medan, etc. and even probably from the neighborhood countries like Singapore, Thailand, etc. In addition, to do the research along with the internship was kind of challenging as well. The author had to split the time between doing the internship works and at the same time trying to finish this research. Therefore, due to a limited time in doing this research study, there might be some areas that were not covered.
56 the independent variables in this study represent 58.4% of variances of customers’ satisfaction at Plaza Indonesia. It is believed that the rest, 41.6% can be explained by other attributes or variables outside those five independent variables that are already listed in this research.
Due to the limitations above, there is a suggestion can be made for the further research, which is to add more independent variables. Since there is 41.6% of Plaza Indonesia customers’ satisfaction that can be explained by other attributes such as marketing focus (Singh & Sahay, 2012), facility (Wong, Y., & Yuan, 2001)
REFERENCES
Ahmad, A. M. (2012). Attractiveness Factors Influencing Shoppers’ Satisfaction, Loyalty, and Word of Mouth: An Empirical Investigation of Saudi Arabia Shopping Malls .
International Journal of Business
Administration, III (6), 101-112.
Ahmed, Z. U., Ghingold, M., & Dahari, Z. (2007). Malaysian shopping mall behavior: an exploratory study. Asia Pacific Journal of Marketing and Logistics, 19 (4), 331-348. Alexander, A. A., & Muhlebach, R. F. (1992).
Shopping Center Management (2nd Edition ed.). Chicago, IL: The Institute of Real Estate Management of the National Association of Realtors.
Anton, J. (1997). Listening to the Voice of the Customer: 16 Steps to a Successful Customer Satisfaction Measurement Program. New York, NY: Purdue University Press.
Bridson, K., Evans, J., & Hickman, M. (2008). Assessing the relationship between loyalty program attributes, store satisfaction and store loyalty. Journal of Retailing and Consumer Service, 15 (5), 364-374.
Caruana, A., Money, A. H., & Berthon, P. R. (2000). Service Quality and Satisfaction : The Moderating Role of Value. European Journal of Marketing, 34 (11/12), 1338-1353.
Central Intelligence Agency. (2014, June 22). Central Intelligence Agency. Retrieved February 17, 2015, from Central Intelligence Agency: https://www.cia.gov/library/publications/the-world-factbook/geos/id.html
Cooper, D. R., & Schindler, P. S. (2014). Business Research Method (12th Edition ed.). New York: McGraw-Hill Education.
Dubihlela, D. (2014). Attributes of Shopping Mall Image, Customer Satisfaction and Mall Patronage for Selected Shopping Malls in Southern Gauteng, South Africa. Journal of Economics and Behavioral Studies , 6, 682-689.
Ghozali, I. (2013). Aplikasi Analisis Multivariate Dengan Program IBM SPSS 21 (7th Edition ed.). Semarang: Badan Penerbit Universitas Diponegoro.
Global Indonesian Voices. (2014, March 8). Global Indonesian Voices. Retrieved February 24,
2015, from
http://www.globalindonesianvoices.com/11693 /jokowi-no-more-mall-for-jakarta/
Gudonaviciene, R., & Alijosiene, S. (2013). Influence of Shopping Centre Image Attributes on Customer Choices. Economics and Management, 18 (3), 545-552.
Hair Jr., J. F., Black, W. C., Babin, B. J., & Anderson, R. E. (2010). Multivariate Data Analysis (7th Edition ed.). Pearson Prentice Hall.
International Council of Shopping Centers. (2015).
ICSC.org. Retrieved February 24, 2015, from http://www.icsc.org/research/references/c-shopping-center-definitions
Jakarta Investment and Promotion Board. (2012). Retrieved February 17, 2015, from http://www.confindustria.it/Aree/NewsPub.nsf/ 9E898D4189EDE116C1257C0E002FD5E1/$F ile/JAKARTA.pdf
Joyce, M. L., & Lambert, D. R. (1996). Memories of the way stores were and retail store image.
International Journal of Retail and Distribution Management, 24 (1), 24-33. Kaufman, C. F. (1996). A new look at one-stop
shopping: a TIMES model approach to matching store hours and shopper schedules.
Journal of Consumer Marketing, 13 (1), 4-52. Kirkup, M. H., & Rafiq, M. (1999). Marketing
shopping centres: challenges in the UK context. Journal of Marketing Practice: Applied Marketing Science, 5 (5), 119-133. Kotler, P. (2000). Marketing Management (10th
Edition ed.). Upper Saddle River, NJ: Prentice-Hall.
Oxford Business Group. (2015). Oxford Business Group. Retrieved February 24, 2015, from http://www.oxfordbusinessgroup.com/overvie w/taking-it-next-level-purchasing-power-and-consumer-spending-are-rise
Richbell, S., & Kite, V. (2007). Night shoppers in the ‘open 24 hours’ supermarket: a profile .
International Journal of Retail & Distribution Management .
Sharma, D. (2014, April). Examining the Influence of Service Quality on Customer Satisfaction and Patronage Intentions in Convenience Store Industry.
Singh, H., & Prashar, S. (2013). Factors Defining Shopping Experience: An Analytical Study of Dubai. Asian Journal of Business Research , III (1), 36-53.
57 Shoppers of Capital Region (NCR) of India.
nternational Journal of Retail & Distribution Management, 3 (40), 235-248.
Tabachnick, B. G., & Fidell, L. S. (2012). Using Multivariate Statistics (6th Edition ed.). Prentice Hall PTR.
The Economist. (2011, July 21). The Economist Newspaper Limited. Retrieved February 23,
2015, from The Economist:
http://www.economist.com/node/18989153 Wakefield, K. L., & Baker, J. (1998). Excitement at
the mall: Determinants and effects on shopping response. Journal of Retailing , 74 (4), 515-539.
Wong, C. B., Ng, H. C., Wong, K. K., & Wong, M. H. (2012). The Relationship between Shopping Mall Attributes, Customer Satisfaction and Positive Word-Of-Mouth: China Visitors in Hong Kong . Global Journal of Management and Business Research, II (3), 49-62.
Wong, G., Y., L., & Yuan, L. L. (2001). SCATTR: an Instrument for Measuring Shopping Centre Attractiveness. International Journal of Retail & Distribution Management, 2 (29), 76-86. World Population Review. (2014). World Population
Review. Retrieved February 13, 2015, from WPR:
http://worldpopulationreview.com/countries/in donesia-population/
Yiu, C., & Yau, Y. (2006). An ecological framework for the strategic positioning of a shopping mall. Journal of Retail and Leisure Property , 5 (4), 270-280.