‘‘In-Work’’ Benefit Reform for British
Lone Mothers
Marco Francesconi
Wilbert van der Klaauw
a b s t r a c t
In October 1999, the British government enacted the Working FamiliesÕTax Credit, which aimed at encouraging work among low-income families with children. This paper uses panel data collected between 1991 and 2001 to evaluate the effect of this reform on single mothers. We find that the reform led to a substantial increase in their employment rate of about five percentage points, which was driven by both a higher rate at which lone mothers remained in the labor force and a higher rate at which they entered it. Women’s responses were highly heterogeneous, with effects double this size for mothers with one preschool-aged child, and virtually no effect for mothers with multiple older children. The employment increase was accompanied by significant increases in paid childcare utilization and our analysis in fact suggests that the generous childcare credit component of the reform played a key role in explaining the estimated employment and childcare usage responses. We also find that the increase in labor market participation was accompanied by reductions in single mothersÕsubsequent fertility and in the rate at which they married, behavioral responses, which in turn are likely to influence the reform’s overall impact on child poverty and welfare.
Marco Francesconi is a reader of economics, University of Essex. Wilbert van der Klaauw is a professor of economics at UNC-Chapel Hill and a visiting scholar at the Federal Reserve Bank of New York. The authors are grateful to the Economic and Social Research Council, the British Academy and the University of Essex for financial support. Comments and suggestions from two anonymous referees, Richard Berthoud, Mike Bielby, Richard Blundell, Mike Brewer, Peter Dolton, John Ermisch, Paul Gregg, Jeff Grogger, Hilary Hoynes, Stephen Jenkins, Costas Meghir, Phil Merrigan, Bruce Meyer, Robert Moffitt, Howard Reed, and seminar participants at the 2003 European Society of Population Economics (Bergen), 2005 World Congress of the Econometric Society (London), Carolina Population Center, Institute for Social and Economic Research (Essex), Institute for the Study of Labor (Bonn), Institute of Education, London School of Economics, and at the Universities of Essex, British Columbia, and Zurich greatly improved the paper. The data used in this article can be obtained from Marco Francesconi beginning August 2007 through July 2010. The views and opinions offered in this paper do not necessarily reflect those of the Federal Reserve Bank of New York or the Federal Reserve System as a whole.
[Submitted December 2004; accepted June 2006]
ISSN 022-166X E-ISSN 1548-8004Ó2007 by the Board of Regents of the University of Wisconsin System
I. Introduction
In October 1999, the United Kingdom enacted the Working FamiliesÕ
Tax Credit (WFTC), a generous tax credit program designed to improve the work incentives for low-income families with children. In addition to considerably higher tax credits for working parents, a striking feature of the program—which dis-tinguishes it from its predecessor as well as its counterpart in the United States, the Earned Income Tax Credit (EITC)—is its provision of a generous childcare tax credit. Although recent research has documented positive effects of this reform on employment and earnings among low-income families, and especially single mothers (Blundell and Hoynes 2004; Brewer et al. 2005), little effort has been devoted to determining which particular aspects of the reform contributed to these outcomes. In addition, our knowledge of the impact of the WFTC on other important socioeconomic behavior—such as childcare usage, marriage, and fertility—is scant or nonexistent.
Our paper offers two substantive contributions. First, we provide a more compre-hensive study of the impact of the WFTC reform on employment outcomes of single mothers by (a) documenting the nature of (and substantial heterogeneity in) the em-ployment increases across individuals, and (b) linking these to specific components of the policy reform. More specifically, using longitudinal data drawn from the British Household Panel Survey 1991–2001, we assess whether the overall employment in-crease was due to an inin-crease in the rate at which lone mothers entered eligible em-ployment, a drop in the rate at which they left it, or both. Our study provides new insight into the role of the childcare tax credit component of the WFTC reform by analyzing whether and how employment responses varied across female-headed households with the number and ages of children, as well as the extent to which they covaried with changes in paid childcare usage.
Second, we analyze whether the employment increase was accompanied by a change in the rate at which single women married, and whether the WFTC reform affected sin-gle mothersÕsubsequent fertility decisions—outcomes that have not previously been analyzed in the British context. Examination of such responses is important both be-cause it gives us a more complete picture of the consequences of the 1999 in-work ben-efit reform and because it allows us to check for the occurrence of unintended effects that may be crucial for the longer-term success of the reform itself.
and Hoynes (2004) suggest that the employment impact among lone mothers was indeed positive and modest. However, more recent work by Brewer et al. (2005) based on estimates of a static structural model of joint labor supply and program par-ticipation reveals a substantially larger effect, with an estimated increase in lone mothersÕemployment of five percentage points. An employment response of similar size is estimated by Gregg and Harkness (2003), who use a difference-in-difference estimation technique combined with propensity score matching.
Based on a different data set and different estimation methodology, our estimate of an average employment increase of five percentage points matches these latter results. However, we find that this average conceals considerable heterogeneity in responses, which varied between a 10 percentage point increase for lone mothers with one preschool-aged child to essentially no effect for mothers of multiple older children. This employment growth was due to both an increase in the rate at which single mothers remained in the labor force and an increase in the rate at which they entered it. The reform also led to significant increases in formal childcare service uti-lization and childcare expenditures, especially among those who newly entered em-ployment and those who decided to remain employed as a consequence of the reform. Our findings point to the importance of the generous childcare tax credit in WFTC’s relative success in attracting single mothers to the labor market.
Equally important and new are our findings indicating that the reform had substan-tial impacts on other socioeconomic outcomes, including substansubstan-tial reductions in single mothersÕ subsequent fertility and in the rate at which they married. Given the importance of household income and family structure for later-life child out-comes (Duncan and Brooks-Gunn, 1997), a comprehensive assessment of one of the key objectives of the reform—that of reducing child poverty in single-parent households—should therefore incorporate an assessment of its indirect effects on child welfare through childcare usage, fertility, and marriage.
II. The WFTC Program
Up to April 2003, the main in-work support program in the United Kingdom has been the Working FamiliesÕTax Credit, which replaced Family Credit (FC) on October 5, 1999.1 Along with other active labor market programs (such as the various welfare-to-work ‘‘New Deal’’ schemes) and the introduction of the Na-tional Minimum Wage, WFTC had a crucial part in the central government’s anti-poverty strategy. By the end of 2002, it reached almost 2.7 million children in 1.4 million families (a 70 percent increase from November 1998 when FC was still in place), and at a cost of around £6 billion a year (approximately 10 billion in current US dollars). To put these figures into perspective, in February 2003, a total of 2.5 million children were living in families claiming at least one of the other key means-tested welfare benefits, including Income Support and Housing Benefits,
while the government spending on, say, Income Support alone—the primary cash transfer to low-income nonworking individuals (in many respects similar to AFDC or TANF in the United States)—was around £13 billion a year.
A family needs to meet three basic requirements in order to be eligible for WFTC. First, at least one adult in the family (or the lone parent in a single-parent family) must work 16 hours or more per week.2Second, the family must have at least one dependent child. A dependent child is a child, grandchild, stepchild, or foster child of the family who is younger than the age of 16 or younger than 19 if in full-time nonuniversity education. Third, family savings and capital must be below a given amount (which, in current prices, was set at £8,000 over our entire sample period) and net family income must be sufficiently low. In fact, families with incomes below a specified ‘‘threshold’’ or ‘‘applicable amount’’ (which increased from £62.25 per week in 1991 to £92.90 per week in 2001) receive maximum credit; when incomes are greater than the threshold, the maximum credit is reduced by a proportion (known as ‘‘taper rate’’) of the difference between net family in-come and threshold. Besides family inin-come and hours worked, the amount of the weekly credit to which a family is entitled also depends on the number and ages of children and childcare costs, in the form of a basic child credit and a childcare credit.
There are four parameters through which the WFTC reform potentially increased the generosity of in-work support relative to FC. First, the WFTC system substan-tially increased the credit for younger children in the age group 0–10. The nominal increment of £5 per week represents a 34 percent increase between 1998 and 1999 (while the annual increase of the credit for children in the same age group between 1991 and 1998 was, on average, 6.6 percent only). Second, the income threshold grew by 14 percent from £79 to £90 per week, whereas its average annual growth in each of the previous eight years had been 3.4 percent. Third, the taper rate at which earnings above the threshold are taxed was lowered from 70 percent to 55 percent. Fourth, WFTC is more generous with eligible childcare costs.3 From October 1994, FC allowed eligible childcare costs (up to a maximum amount, which was £60 per week just before WFTC was introduced) to be disregarded from the calculation of net family income.4 Under WFTC instead, the disregard was replaced by a separate childcare credit worth 70 percent of childcare costs, subject to an overall limit of £100 per week for one child and £150 per week for two or more children. This meant that the maximum childcare support was £70 per week for a family with one child, and £105 per week for a family with two or more children.
2. At its introduction in 1988, Family Credit set the minimum hour cutoff at 24 hours per week, which was reduced to 16 in 1992. In addition, from July 1995, FC was modified to provide an extra £10 credit for those working 30 hours per week or more. This feature was retained by the WFTC reform (with the additional credit set at £11.15 in October 1999).
3. To be ‘‘eligible’’ (or ‘‘relevant’’) childcare services must be provided by registered childminders, day nurseries, and after-school clubs, or certain other special schools or establishments that are exempt from registration. Relevant childcare can be for any child in the family up to age 11 until May 1998, or up to age 12 from June 1998 to May 2000, or up to age 15 from June 2000 onward.
4. The £60 amount was the disregard for families with one child. In 1998 a disregard of £100 was intro-duced for families with two or more children.
To get an idea of the impact of the reform, consider a lone mother with one child aged six, who works more than 16 hours per week (but less than 30), has net earnings of £150 per week and pays £60 per week for childcare. In 1999 under the WFTC regime, she would receive a credit of £81.15 per week. In 1998 under the FC regime, the same woman with the same characteristics would receive a credit of £56.80 per week (in 1999 prices), that is 43 percent less than in 1999. If the woman had net earnings of £200 per week, her credit in both years would be lower, but in 1999 she would receive 2.5 times the amount in 1998 (£53.65 versus £21.25 per week). For the empirical earnings and childcare expenditures distributions of mothers work-ing 16 or more hours per week in 1998, and assumwork-ing no behavioral responses, the reform implied an average credit increase of about 20 percent (from an average of £42 to almost £50 per week), with a quarter of these mothers seeing an increase of at least 50 percent.
Unlike FC, WFTC was not administered by the Benefits Agency but by Inland Revenue. In line with the government’s effort to reduce the potential stigma as-sociated with claiming in-work benefits, this administrative feature and the receipt of the credit through the wage packet directly from the employer were intended to emphasize that WFTC was indeed a tax credit rather than a welfare benefit (H.M. Treasury 1998).5 Therefore, while in many respects WFTC is similar to EITC in the United States, it differs from it in that WFTC has no phase-in rate but instead a minimum hours requirement of 16 per week, it has a higher phase-out rate (taper rate), includes a generous childcare tax credit, and it is administered and paid out differently.
The WFTC reform also was accompanied, preceded, and followed by the intro-duction of new programs and by changes in key parameters of other existing schemes, such as the National Minimum Wage and the various New Deal schemes. There are therefore a number of possible interactions between WFTC and other policy initiatives.6While disentangling the effect of each individual policy is beyond the scope of this paper, in our empirical analysis we will attempt to isolate, to the extent possible, the impact of WFTC. A detailed discussion of our methods is de-ferred until Section IV.
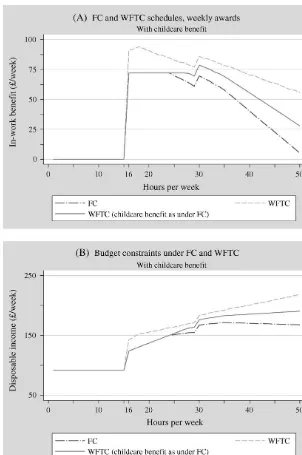
A simplified illustration of the main features of the reform is provided in Figure 1.7 One of the parameters of the reform was an increase in the credit for those with a child under age 10, an increase which also was applied to those working less than 16 hours (or not working) and receiving Income Support. Therefore, to focus on the main work incentive effects of the program, in Figure 1 we control for this increase in basic benefits by also applying it to the old FC program. In absence of childcare subsidies, there was a gradual increase in benefits with higher hours of work levels.
5. Most families were paid through the pay packet. The most notable exception (which is not relevant in our study) was for couples in which the claimant was a nonworking partner: In these cases, it was paid to them directly.
6. For a thorough description of such initiatives, see Dickens and Manning (2002), Blundell et al. (2002), and Card et al. (2004).
Figure 1
If the mother received Housing Benefit (a rent subsidy), the rate of increase was somewhat slower than shown in the figures, due to the fact that the tax credit was treated as income in other means-tested programs. However, the main features remained the same, with the greatest increases in benefits falling to those in full-time employment, many of whom would not have been eligible for a tax credit be-fore the reform. Depending on the amount of childcare expenditures, the childcare component of the tax credit could have represented a considerable increase in gen-erosity of the in-work benefit program, beyond that associated with the reduced earnings tax rate and increased earnings disregard. This is illustrated in Panel A, which also shows the benefit schedule under WFTC in the case the childcare component had been computed as it was under FC (that is, as an earnings disregard).
To assess the overall work incentives associated with the reform, Panel B shows the mother’s budget constraint in the case where she used paid childcare where again FC benefits and income at hours below 16 were calculated based on the higher basic child credit rate under WFTC. The reform unambiguously improved the financial in-centive to take on eligible employment, and especially full-time employment. The effect on hours of work for those already in eligible employment was ambiguous, depending on the relative magnitude of income and substitution effects for this group. Similarly, the childcare tax credit, receipt of which was conditional on eligible employment, had an unambiguous positive effect on labor force participation and an ambiguous effect on hours for those in eligible work. As the credit represented a re-duction in the net cost of childcare use, we expect an increase in paid childcare use and in the childcare credit takeup rate, among both those new and those already in eligible employment.
As credit receipt was conditional on having a dependent child, the reform was expected to create greater incentives for single childless women to enter single moth-erhood. However, it had an ambiguous effect on subsequent fertility choices of lone mothers. First, conditional on current working hours and childcare use, the incre-ments in the child credit (under both IS and WFTC) and in the childcare credit (under WFTC) for existing children led to an income effect, which might have been positive or negative depending on whether children were seen as normal or inferior goods. Second, the same increments implied an increase in the added credit associated with an extra birth, which would have led to a rise in subsequent fertility. But, by increas-ing the gains from workincreas-ing and reducincreas-ing the cost of childcare, these changes also could have influenced fertility choices through indirect income and substitution effects associated with changes in labor supply and childcare usage, which could have affected subsequent fertility decisions either positively or negatively. Third, the increase in the income threshold and the decrease in the taper rate similarly might have influenced fertility behavior through income and substitution effects associated with the increased incentives to work 16 or more hours.
III. Data
The data we use are from the first 11 waves of the British Household Panel Survey (BHPS) collected over the period 1991–2001.8 Our sample includes unmarried noncohabiting females who are at least 16 years old and were born after 1940 (thus, at oldest, 60 years old in 2001). We exclude any female who was long-term ill or disabled, or in school full time in a given year. The sample includes 3,333 women, of whom 1,507 are lone mothers and 1,826 remain childless during the observation period. In line with the Inland Revenue’s definition, a child must be aged 16 or younger (or be younger than 19 and in full-time education) to count as a dependent child for whom the single mother is responsible. Although only 9 per-cent of the women are observed in the same marital state for all 11 years of the panel, approximately 30 percent of them are observed for at least seven years in the same state. The resulting sample size, after pooling all 11 years for both groups of women, is 14,357 observations (5,283 on lone mothers and 9,074 on childless women). Of the 1,394 single women in the 1999 wave of interviews, 40 lone mothers and 61 childless women (about 7 percent of the sample in that year) were interviewed before the re-form implementation date of October 5. To limit problems of interpretation, they were dropped from the sample analyzed for that year. Their inclusion, however, does not alter any of our main results.
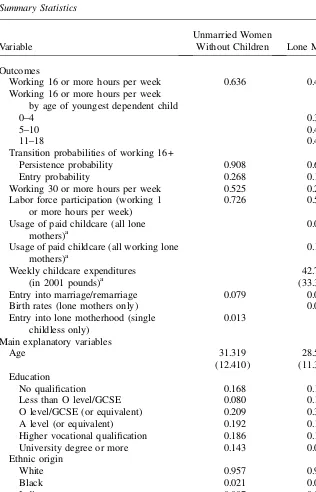
Table 1 presents summary statistics of the outcomes as well as background char-acteristics of the two groups of women that we will use as covariates in the analysis below. There are some noticeable differences in characteristics between the two groups. Those who have children tend on average to be younger, less educated, more likely to be nonwhite, and more likely to be in social housing. In addition, there ap-pear to be systematic differences in employment behavior of both groups of women. Compared to unmarried childless women, lone mothers are less likely to work 16 or more hours per week, and have a lower probability of staying in such labor market state and entering it in any given two successive years.9They also are less likely to work 30 or more hours per week, or work any positive number of hours, but they are equally likely to form marital or cohabiting unions. The other outcomes listed in Table 1 are analyzed only for singlemothers(usage of and expenditures on childcare services, and having an additional child), with the exception of entry into lone motherhood which is analyzed for single childless women only.10
8. The households from the European Community Household Panel subsample (followed since Wave 7), those from the Scotland and Wales booster subsamples (added to the BHPS in Wave 9) and those from the Northern Ireland booster subsample (which started in Wave 11) are excluded from our analysis. Detailed information on the BHPS can be obtained atÆhttp://www.iser.essex.ac.uk/bhps/docæ.
9. Hours worked are the sum of usual weekly hours of work and usual weekly hours of overtime work. 10. Most of the figures in Table 1 conform to official statistics and to those reported in related studies (for example, Blundell et al. 2000; Gregg and Harkness 2003). Perhaps the most notable exceptions are child-care usage and expenditures. Using data from the Family Resources Survey (FRS) for the period 1994–96, Blundellet al. (2000) report that nearly 18 percent of lone parents use formal childcare (rather than 11 per-cent as in Table 1), and the weekly childcare expenditure is about £57 (rather than £42). Besides differences in time period and data source, the FRS statistics in Blundellet al. (2000) refer to families where the youn-gest child is under 5, while the averages in Table 1 are computed over families where the younyoun-gest child is aged 12 or younger. However, if we only look at families where the youngest child is under 5, the BHPS figures on average childcare expenditures are £54 per week, very close to the FRS figures.
Table 1
Summary Statistics
Variable
Unmarried Women
Without Children Lone Mothers
Outcomes
Working 16 or more hours per week 0.636 0.408
Working 16 or more hours per week by age of youngest dependent child
0–4 0.334
5–10 0.432
11–18 0.420
Transition probabilities of working 16+
Persistence probability 0.908 0.651
Entry probability 0.268 0.195
Working 30 or more hours per week 0.525 0.264
Labor force participation (working 1 or more hours per week)
0.726 0.595
Usage of paid childcare (all lone mothers)a
0.062
Usage of paid childcare (all working lone mothers)a
0.109
Weekly childcare expenditures (in 2001 pounds)a
42.70 (33.34)
Entry into marriage/remarriage 0.079 0.085
Birth rates (lone mothers only) 0.037
Entry into lone motherhood (single childless only)
0.013
Main explanatory variables
Age 31.319
(12.410)
28.541 (11.302) Education
No qualification 0.168 0.177
Less than O level/GCSE 0.080 0.121
O level/GCSE (or equivalent) 0.209 0.343
A level (or equivalent) 0.192 0.133
Higher vocational qualification 0.186 0.161
University degree or more 0.143 0.045
Ethnic origin
White 0.957 0.916
Black 0.021 0.038
Indian 0.007 0.022
Pakistani/Bangladeshi 0.003 0.011
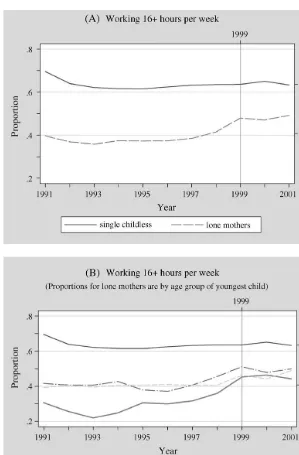
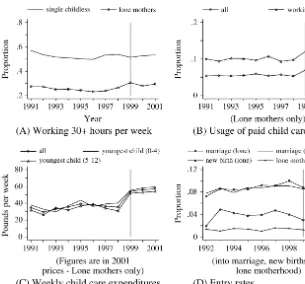
Figures 2 and 3 plot the time trends for all outcomes between 1991 and 2001. Figure 2 focuses on eligible employment and plots the labor market participation rates at 16 or more hours per week. Panel A shows the trends for the two groups of women, while Panel B disaggregates the lone mothersÕpatterns into three groups stratified by the age of the youngest dependent child (aged 0–4, 5–10, and 11–18). The data reveal that single childless women had very stable participation patterns over the whole sample period. The participation rates of lone mothers too were stable with a small positive trend up to 1998, when they rose from about 40 to nearly 48 percent.11Figure 2b sug-gests that the strongest growth was experienced by women with children in the youn-gest age group (0–4 years), who increased their participation rate from approximately 30 percent during the 1991–98 period, to 45 percent in the 1999–2001 period.12
The trends in average participation rates at 30 or more hours per week (full-time employment) in Figure 3a are similar to those shown in Figure 2a. Usage of and
Table 1(continued)
Variable
Unmarried Women
Without Children Lone Mothers
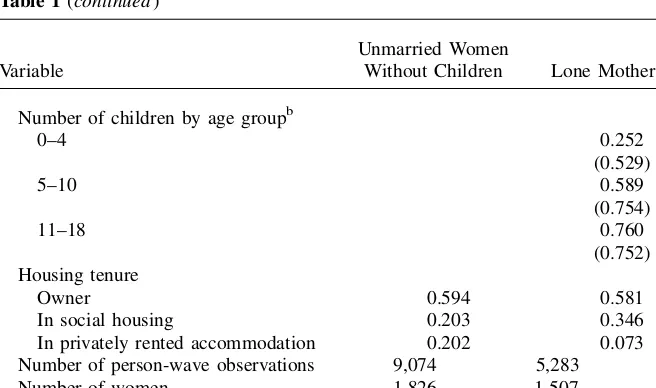
Number of children by age groupb
0–4 0.252
(0.529)
5–10 0.589
(0.754)
11–18 0.760
(0.752) Housing tenure
Owner 0.594 0.581
In social housing 0.203 0.346
In privately rented accommodation 0.202 0.073
Number of person-wave observations 9,074 5,283
Number of women 1,826 1,507
Notes: For convenience, the table does not report summary statistics on region (16 dummies). Standard deviations are in parentheses.
a. Computed over single-mother households where the youngest child is aged 12 or younger.
b. Averages are computed over the entire subsample of lone mothers. If computed over the three specific subsamples of lone mothers in each child group, the averages (standard deviations) are: 1.178 (0.461), 1.314 (0.562), and 1.293 (0.523) respectively.
11. If the timing of WFTC’s introduction were driven by a sudden fall in the employment rate of lone mothers in the years immediately preceding its introduction, then the evaluation can be affected by a ‘‘regression-to-the-mean’’ bias (Cook and Campbell, 1979). The figures presented here, however, do not reveal any such preprogram declines.
12. Francesconi and van der Klaauw (2004) explore the possibility that the slight employment rate increase in 1998, as shown in Figures 2 and 3(a), may represent a program announcement effect. Here we adopt a conservative approach by assuming that it is unrelated to the reform, which may cause a slight downward bias in our employment response estimates.
Figure 2
Figure 3
Other Outcomes for Lone Mothers and Single Childless Women
12
The
Journal
of
Human
expenditures on formal childcare services were stable up to 1998, and increased only in concomitance with the WFTC reform (Figures 3b and 3c). The 1999 reform appears also to be associated with a reduction in the entry rates into marital or cohab-iting unions (as compared to women without children), a decline in the probability of an additional birth for lone mothers, as well as with a small decline in the entry rate into lone motherhood (Figure 3d).
These trends for those directly affected by the reform (single mothers) and those not directly affected (single women without children) strongly suggest that the changes in socioeconomic outcomes observed after 1998 were closely related to the in-work re-form introduced around that time. The relative stability of trends in the different so-cioeconomic outcomes for single women without children suggests that the observed changes for single mothers, which coincide with the 1999 reform, were not a result of improved wage opportunities for all women. However, it is also possible that the dif-ferential trends were due to changes over time in the composition of both groups. For example, single mothersÕage, education, fertility, or unobserved skill distributions might have changed compared with those of single childless women. To investigate the causal link between the introduction of WFTC and these outcomes further, we will estimate a series of multivariate regression models that compare the outcomes of lone mothers to the outcomes of single women without children, controlling for demo-graphic differences between the two groups as well as changes in these characteristics over time. A similar comparison group approach was used by Eissa and Liebman (1996) and Meyer and Rosenbaum (2000) to assess the impact of the EITC on the la-bor supply of single mothers, while Blundell and Hoynes (2004) compared employ-ment outcomes of single women with and without children to evaluate the impact of the WFTC reform. The next section discusses our methodology for identifying the responses of British lone mothers to the WFTC reform more formally.
IV. Methods
Nonexperimental program evaluations based on multiple pre- and post-treatment periods have been carried out in several different ways (see the comprehen-sive survey by Heckman et al. 1999 and the discussion of the interrupted time-series design by Cook and Campbell 1979). To relate our approach to those previously adop-ted for evaluating the impacts of in-work benefit reforms in Britain and the Uniadop-ted States, letdidenote a dummy variable that is equal to 1 if individualiis a lone mother
and 0 otherwise, and letsbe the time period in which the reform occurs (that is,s=1999). We model the outcome variableyitas being determined by the following specification
yit=a1+a2dit+ða31+a32ditÞt+½a41+a42ðt–sÞIðt$sÞ+bditIðt$sÞ
+X0itg+ui+eit;
ð1Þ
where the term I(w) is a function indicating that the eventwoccurs,Xitis a vector of individual characteristics, ui represents individual fixed effects, and eit is an i.i.d.
the process generating y at the time of the reform. In our case, they capture the effects of all the other (non-WFTC) policy changes that occurred ats(for example, the introduction of the minimum wage). While our control group of single women without children was ineligible for FC and WFTC benefits and therefore not directly affected by the in-work benefit reform, both groups were potentially affected by the other policy initiatives that took place in that year. By assuming that lone parents would have responded in the same way to these other reforms, we are able to net out the separate impact of WFTC, which is captured in the equation byb:
Our approach improves over the widely used ‘‘difference-in-difference’’ (DD) method (Eissa and Liebman 1996; Blundell and Hoynes 2004), applied to data from few repeated cross-sections, which assumes a common trend (imposinga32= 0).13 As indicated by Figures 2–3, single childless women exhibit a number of prereform trends that differ from those of lone mothers, suggesting that it is important to allow for these in the analysis.14In addition, by using multiple observations before and after the occurrence of the policy change, unlike the DD approach (which imposesa42= 0), we allow for both a common jump and a change in the slope in 1999. In this respect our approach can be considered as a simple extension of a ‘‘difference-in-difference-in-difference’’ (DDD) estimation approach applied to panel data.15
To control for potential differences in group-specific compositional changes over time, we have a set of standard individual characteristics inXit(for example, age,
ed-ucation, region of residence, number, and ages of children). Because single childless women tend to be more concentrated at the bottom and top ends of the age distribution, it is important to account for age effects, which we do by including a quar-tic polynomial in age. In addition, as single mothers on average have less education we performed sensitivity checks that will be discussed later in the paper by replicating our entire analysis using a more restricted control group, consisting of single childless women with low educational attainment. Because we use panel data, we also account for compositional changes in unobserved characteristics with the inclusion of individ-ual-specific fixed effects. Unlike studies based on cross-sectional data, this permits us to address the possibility that time changes in lone-mother status (that is, inclusion in our sample) as well as changes in time-varying individual characteristics are endogenous to the policy reform as long as the fixed effect represents the source of this endogeneity. By following the same individuals over time, we can examine whether the in-troduction of WFTC led to changes in the rate at which single women entered and left the labor force. That is, we can directly assess the impact of WFTC on year-to-year
13. One concern with DD regressions is that standard errors may be misstated in the presence of serial cor-relation of outcomes for the same individual over time (Bertrand et al. 2004). Our fixed-effects specifica-tions, however, directly account for time-invariant unobserved heterogeneity.
14. We will also report results from alternative specifications with group-specific quadratic trends, in which case Equation 1 includes the additional termða51+a52ditÞt2.
15. Under Specification 1 without individual characteristics and fixed effects, a DDD estimator defined as
Eðyi;s–1+kjdi= 1Þ– Eðyi;s–1jdi= 1Þ
– Eðyi;s–1jdi= 1Þ– Eðyi;s–1–kjdi= 1Þ
– Eðyi;s–1+kjdi= 0Þ– Eðyi;s–1jdi= 0Þ
– Eðyi;s–1jdi= 0Þ– Eðyi;s–1–kjdi= 0Þ
will identify the treatment effectb(the time subscriptkindicates the length of the time periods over which the differences are computed). See Francesconi and van der Klaauw (2004) for a more extensive discussion of DD and DDD methods.
employment transitions. This can help us understand whether any given WFTC effect is associated with a change in the rate at which individuals entered the labor force and/ or with a change in the rate at which people left it. We implement this analysis by es-timating a separate outcome Equation 1 for each value ofyi;t–1:
It is important to point out the main identification condition underlying our ap-proach. We explicitly assume that, other than the introduction of WFTC, there are no contemporaneous shocks that affect therelativeoutcomes of the treatment and control groups. The increase in basic child benefits under Income Support between 1998 and 1999 may be problematic in this respect. In terms of employment out-comes, however, this increase is modest and implies a negative income effect that could lead to a (small) downward bias in our effect estimates. Our estimates may then represent a lower bound on the true effect.
V. Impact on Employment
A. Benchmark Estimates
Table 2 shows the estimated impacts of the WFTC reform on three employ-ment measures (eligible employemploy-ment, full-time employemploy-ment, and labor force
Table 2
Effects of Welfare Reform on Employment
(1) (2) (3) (4) Labor force participationc 0.058
(0.022)
Number of women 3,333 2,322 3,333 2,322
Observations 14,357 9,427 14,357 9,427
participation).16For simplicity of interpretation, we only report least squares esti-mates based on linear probability models. Marginal effects estiesti-mates from Chamber-lain fixed-effects logit models were very similar. In the table we present constant treatment effect estimates from Model 1 with individual fixed effectsui and
group-specific preprogram trends. Column 1 reports our baseline results obtained from the whole sample of single women with linear trends. The other three columns pro-vide robustness checks. The estimates in Column 2 are obtained from the subsample in which the control group of single childless women is limited to those with educa-tional qualifications below A level (‘‘low education sample’’). Column 3 shows results for the whole sample with quadratic trends, while Column 4 reports the esti-mates from the low education sample with quadratic trends.
Focussing on the first estimate in Column 1, we find that the rate at which lone mothers worked 16 or more hours per week increased by a statistically significant 5.1 percentage points.17 This estimate is remarkably close to those reported in Brewer et al. (2005) and Gregg and Harkness (2003), who applied different methods to different data from ours.18Our estimate implies an eligible-employment elasticity with respect to net income of about 1.10. This falls within (albeit at the high end of) the 0.69–1.16 range of comparable elasticities reported by Hotz and Scholz (2003) for the United States. Looking across columns, we notice that restricting the control group to childless women with qualifications lower than A level reduces only slightly the effect to 4.8 percentage points (Column 2). Likewise, the introduction of qua-dratic preprogram trends leads to treatment effects of 5 percentage points for the whole sample (Column 3) and 4.6 percentage points for the restricted sample (Col-umn 4). In general, therefore, the baseline estimate in Col(Col-umn 1 appears to be robust to alternative comparison group and trend specifications.
As discussed earlier, in absence of the childcare subsidy, the increase in net in-come induced by the introduction of WFTC can be expected to be small or modest below 25 hours of work per week. At higher hours levels, however, the reduction in the WFTC taper rate leads to greater returns to working. The childcare subsidy pro-vides an additional incentive at any level of eligible employment to work and use paid childcare. The estimates in the second row of Table 2, in fact, suggest that the positive labor supply response of single mothers was predominantly driven by an increase in full-time employment (working 30 hours per week or more). The rate
16. Francesconi and van der Klaauw (2004) present evidence on several additional outcomes, including monthly earnings, FC/WFTC receipt and award, and IS receipt. This analysis indicated that the WFTC re-form led to significant increases in single mothersÕaverage monthly earnings and receipt/award of the tax credit, and to a substantial reduction in IS participation.
17. It is worthwhile noting that the estimates ofa32anda42are around 0.0025 (s.e.=0.0011) and 0.017 (s.e.=0.007) respectively, implying that a DD estimator would lead to biased estimates. The same pattern of results emerges also from the other three specifications.
18. Because there might have been delayed responses to the program, we also estimated variants to Equa-tion 1 that allow for a different treatment effect in each of the three years following the reform and available in our data set. The estimates, not shown here for brevity, indicate that the largest employment impact emerged in 1999, that is, immediately after the introduction of the reform, when it led to an increase in the employment rate of seven percentage points. The employment effect fell in subsequent years to two points in 2000 and four points in 2001. The finding of a program-introduction effect is consistent with results reported in Blundell and Hoynes (2004).
at which lone mothers worked full time increased by 4.7 percentage points over the postreform period (Column 1). Different sample restrictions and trends modelling lead to similar results (Columns 2–4).
To analyze the extent to which the increase in full-time employment and in eligi-ble employment was due to an overall increase in employment of single mothers, rather than an increase in hours among those working, we consider the WFTC impact on the labor force participation rate (third row of Table 2). Regardless of the speci-fication, the estimates indicate that a large proportion of the increase in employment was due to the increase in the proportion of single mothers participating in the labor market. Indeed, using hours worked as dependent variable on the subsample of work-ers only (not shown), we find virtually no effect. Combined, these results suggest that the WFTC had a strong substitution effect on previously nonworking lone mothers and relatively similar income and substitution effects on already working women.
B. Employment Transitions
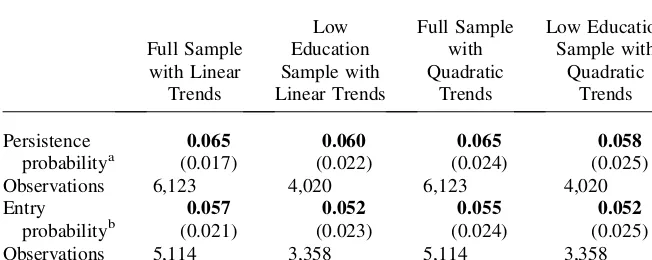
Depending on the tightness of the labor market, an increase in work incentives can differentially affect entry and exit rates. If new jobs are sparse and if most exits from the labor market by single mothers are voluntary, we might expect most of the em-ployment response to come in the form of a lower exit rate out of eligible employ-ment. More generally, we also might expect to see an increased entry rate into eligible employment. To investigate this, we next analyze WFTC’s impact on em-ployment transitions by estimating its effect both on the probability of staying in el-igible employment (that is, conditioning on yi;t–1= 1Þ; and on the probability of starting a job with 16 or more hours of work per week (that is, conditioning on yi;t–1= 0Þ:We define the former as the persistence probability and the latter as the entry probability. The corresponding effect estimates are reported in Table 3. They indicate that the introduction of the in-work benefit reform significantly increased lone mothersÕpersistence rates by 6.5 percentage points after 1998. Entry rates into WFTC-eligible jobs show similar patterns. They rose on average by almost six per-centage points over the postimplementation period. These results are broadly con-firmed by the estimates obtained with the restricted sample and the inclusion of quadratic trends.19
C. Estimates by Number of Children and Age of the Youngest Child
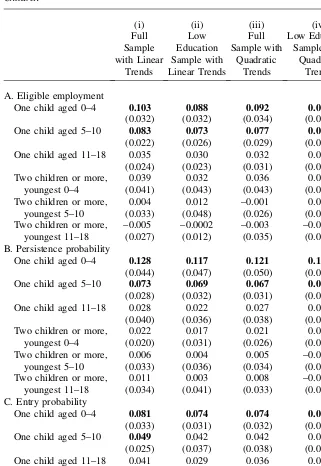
The WFTC reform could have generated different labor market responses depending on the number and ages of children, because it virtually eliminated existing differ-ences in the child credit amount provided to children of different ages under Family Credit, and because of the new childcare credit. To analyze this we estimate separate
treatment effects by the number of dependent children, and distinguishing by age of the youngest child in intervals 0–4, 5–10, and 11–18.20The results shown in the top panel of Table 4 indicate that the strongest increase in eligible employment emerges in the case of lone mothers with one preschool-aged child. Eissa and Liebman (1996) and Meyer and Rosenbaum (2001) in the case of the EITC, and Gregg and Harkness (2003) for the case of the WFTC, also reported larger employment effects for moth-ers with younger children (Column 1), but the differences they report are less dra-matic than those found here. A lone mother with one child aged 0–4 increased her probability of being in eligible employment by 10 percentage points, and a lone mother with one child aged 5–10 experienced an increase of about 8 percentage points. However, for a single mother with one child in the oldest group, that increase was of the order of only 3.5 percentage points.
Lone mothers with a greater number of children generally had a smaller labor sup-ply response and, without exceptions, this was never statistically significantly
Table 3
Effects of Welfare Reform on Eligible Employment Transitions
Full Sample
Observations 6,123 4,020 6,123 4,020
Entry
Observations 5,114 3,358 5,114 3,358
a. Obtained from linear probability models of transitions in labor market states on the sample of single childless women and lone mothers. Conditional onyi,t–1= 1.
b. Obtained from linear probability models of transitions in labor market states on the sample of single childless women and lone mothers. Conditional onyi,t–1= 0.
Notes: The term ‘‘Observations’’ denotes the number of wave-on-wave state-specific transitions. Standard errors are shown in parentheses. Estimates in bold are significant at the 5 percent level. A list of all variables used in estimation is in the note to Table 2.
20. Specifically, our estimated equations take the form:
yit=a1+a2dit+ða31++ja 4, 5–10, 11–18, and zero otherwise; andNðitmÞis another indicator that equals one if lone motheriat timet has children in groupm, wheremis either of the following six mutually exclusive categories: one child aged 0–4, one child aged 5–10, one child aged 11–18, two or more children with the youngest aged 0–4, two or more children with the youngest aged 5–10, or two or more children with the youngest aged 11–18. The latter indicators are also included inXit.
Table 4
Effect of Welfare Reform on Employment by Age of Youngest Child and Number of Children
One child aged 0–4 0.103
(0.032) One child aged 5–10 0.083
(0.022) One child aged 11–18 0.035
(0.024)
One child aged 0–4 0.128
(0.044) One child aged 5–10 0.073
(0.028) One child aged 11–18 0.028
(0.040)
One child aged 0–4 0.081
(0.033) One child aged 5–10 0.049
(0.025) One child aged 11–18 0.041
different from zero. These results are robust to the other specifications (Columns 2– 4), and the estimates for full-time employment and labor force participation (not pre-sented here) show the exact same pattern.
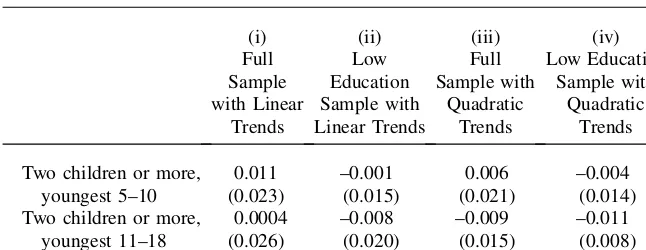
The other two panels of Table 4 report the treatment effect estimates on persistence and entry rates for mothers with varying number of children and by age of the youngest child. In line with our previous results, the largest impact of the WFTC reform on em-ployment persistence and entry rates emerged for women whose children were in the youngest group. From Column 1 we see that the average persistence rate for a single mother with one child aged 0–4 increased by almost 13 percentage points relative to the rate of a corresponding single childless woman. This effect declined to seven per-centage points for a mother with one child aged 5–10, and dropped to 2.8 perper-centage points for a mother with one child aged 11–18. The entry rate estimates show a similar pattern by child’s age, but their decline across age groups is less steep and their overall magnitudes are smaller compared with those of the corresponding estimates of the per-sistence rates, except for the oldest age group. For mothers with two or more children, the effect of the reform on the probabilities of remaining or entering eligible employ-ment was always small and statistically insignificant regardless of the age of the youn-gest child. Again, all these results are robust across specifications (Columns 2–4).
D. Child Credit Component
The finding that the employment effects were stronger for lone mothers with young children provides important clues as to what WFTC parameters may have contrib-uted to the observed responses. As mentioned earlier there are two components of the reform which could lead to differential treatment by child age. A first explana-tion, which relates to the increase in the child age-specific component of the tax credit, is analyzed here. The other is considered in the next section.
The credit for children aged 0–10 increased by about 25 percent relative to the credit for children aged 11 or more. However, the generosity of IS payments to work-less lone mothers with children aged under 11 also grew by the same amount. The net result of these changes is a pure income effect on labor supply, which goes in
Table 4(continued)
(i) (ii) (iii) (iv)
Notes: Standard errors are shown in parentheses. Estimates in bold are significant at the 5 percent level. Def-initions, number of observations, and list of variables used in estimation are in the notes to Tables 2 and 3.
the opposite direction: we would expect a smaller labor supply increase for mothers of younger children.21
To investigate further whether the child credit component of WFTC played any role, we compare differences in labor supply in 1998 and 1999 between lone mothers who had a child aged 10 in those two years and lone mothers who had a child aged 11 in the same two years. As the former group experienced a much larger increase in the child credit component relative to the latter, a comparison of the corresponding responses in employment behavior in 1998 and 1999 for these two groups provides an indication of the importance of the child credit schedule changes. We computed difference-in-difference estimates for both eligible employment and full-time em-ployment (the results are not shown for brevity, but can be found in Francesconi and van der Klaauw 2004).22The Wald estimates, which are very small and statisti-cally insignificant, indicate that the child credit increase for young children does not play any role in explaining the employment effects of the reform. Controlling for dif-ferences in individual characteristics and increasing the two comparison samples to mothers with children aged 6–10 and 11–14 respectively did not alter this result.
VI. Impact on Childcare Use and Role of the
Childcare Credit
The second explanation is based on the increase in the tax credit pro-vided to cover childcare costs. Although all lone-parent households may benefit from this provision, it is arguably lone mothers with children younger than school age who could benefit most from this incentive. WFTC provided much greater support for childcare than Family Credit did, in a number of ways. It added the childcare element toward the overall award, increased the maximum level of support for childcare costs, and offered support for a wider age range, for children aged up to 15 (or 16 if disabled) rather than up to 11. In conjunction with the large labor supply effects documented above, we therefore expect to observe a sizable impact of WFTC on both the use of eligible childcare services and childcare expenditures.
Although the BHPS distinguishes between formal (or paid) and informal childcare arrangements, it collects information on childcare only for working mothers who are responsible for children aged 12 or under. Our analysis, therefore, cannot consider childcare arrangements for nonworking single mothers (who in any case were not WFTC-eligible), and it cannot take into account childcare arrangements for children aged 13 or older (although this omission might have only minor consequences on our results because relevant childcare subsidies under WFTC started to cover 13–15 year-olds only from June 2000 onward). The estimates in Table 5 confirm our expec-tation, showing that the introduction of WFTC led to an increase in the use of paid
Table 5
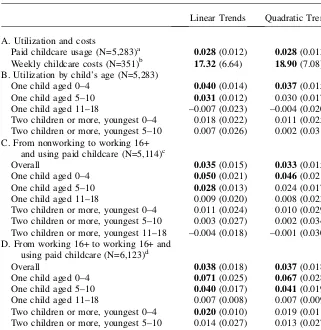
Effects of Welfare Reform on Childcare Use and Costs and Employment Transitions with Childcare Use, Overall and by Age of Youngest Child and Number of Children – Full Sample
Linear Trends Quadratic Trends
A. Utilization and costs
Paid childcare usage (N=5,283)a 0.028(0.012) 0.028(0.013) Weekly childcare costs (N=351)b 17.32(6.64) 18.90(7.08) B. Utilization by child’s age (N=5,283)
One child aged 0–4 0.040(0.014) 0.037(0.015)
One child aged 5–10 0.031(0.012) 0.030 (0.017)
One child aged 11–18 –0.007 (0.023) –0.004 (0.020)
Two children or more, youngest 0–4 0.018 (0.022) 0.011 (0.025) Two children or more, youngest 5–10 0.007 (0.026) 0.002 (0.031) C. From nonworking to working 16+
and using paid childcare (N=5,114)c
Overall 0.035(0.015) 0.033(0.015)
One child aged 0–4 0.050(0.021) 0.046(0.021)
One child aged 5–10 0.028(0.013) 0.024 (0.017)
One child aged 11–18 0.009 (0.020) 0.008 (0.023)
Two children or more, youngest 0–4 0.011 (0.024) 0.010 (0.029) Two children or more, youngest 5–10 0.003 (0.027) 0.002 (0.034) Two children or more, youngest 11–18 –0.004 (0.018) –0.001 (0.030) D. From working 16+ to working 16+ and
using paid childcare (N=6,123)d
Overall 0.038(0.018) 0.037(0.018)
One child aged 0–4 0.071(0.025) 0.067(0.028)
One child aged 5–10 0.040(0.017) 0.041(0.019)
One child aged 11–18 0.007 (0.008) 0.007 (0.009)
Two children or more, youngest 0–4 0.020(0.010) 0.019 (0.011) Two children or more, youngest 5–10 0.014 (0.027) 0.013 (0.027) Two children or more, youngest 11–18 0.004 (0.011) 0.004 (0.012)
a. Obtained from linear probability models with individual fixed effects on the subsample of lone mothers. The dependent variable takes value one if the mother works, has at least one child aged 12 or younger, and pays for childcare arrangements, and zero otherwise. N is number of observations.
b. Obtained from linear regression models with individual fixed effects on the subsample of lone mothers who work, have at least one child aged 12 or younger, and report positive expenditures on childcare arrangements. The weekly childcare expenditures are expressed in constant (2001) prices.Nis number of observations. c. Obtained from linear probability models on the subsample of single childless women and lone mothers. The nonworking (origin) state includes women who work less than 16 hours per week. N is the number of wave-on-wave state-specific transitions.
d. Obtained from linear probability models of transitions in labor market states on the sample of single child-less women and lone mothers.Nis the number of wave-on-wave state-specific transitions.
Notes: Standard errors are shown in parentheses. Estimates in bold are significant at the 5 percent level. All relevant information (explanatory variables, base categories, and definitions) is listed in the notes to Tables 2–4, except that the trend variables specific to single women without children are set to zero in Panels A–C.
childcare services of about three percentage points regardless of the trend specifica-tion (first row in Panel A).23This average effect represents a 35 percent increase rel-ative to the pre-1999 levels, and lines up well with the statistics drawn from the Families and Children Study data reported in McKay (2003). The finding of a rela-tively large response in childcare use is also consistent with own price effect esti-mates reported for the United States (Anderson and Levine 2000). As will be discussed later, it represents a large proportional increase in the use of formal child-care services among those newly entering eligible employment. At the same time, the corresponding average childcare expenditures went up by about £17–19 per week (second row).
Differentiating by the number and ages of children, we find a similar pattern to the reform’s impact on eligible employment (Panel B). Lone mothers with only one child aged 0-4 experienced the greatest increase in the probability of using paid childcare services of four percentage points, compared to an increase of three percentage points for those with one child aged 5–10. The effect further diminishes with the number of children in the household. These results are robust to the inclusion of qua-dratic trends.
To examine the interaction between employment and childcare responses, we next analyze the WFTC impact on the rate at which nonworking lone mothers enter eli-gible employment while using paid childcare, as well as its impact on the rate at which single mothers who were previously in eligible employment increased their use of paid childcare while working. Estimates from both analyses are reported in Panels C and D of Table 5. A significant fraction of lone mothers who entered eli-gible employment as a result of the reform did so by also choosing to use paid child-care. In fact, when compared to the estimates shown in Tables 3 and 4, the results in Panel C of Table 5 suggest that, for mothers with one child aged 0–10, the work-child-care combination increased by about three to five percentage points, and accounted for approximately 60 percent of the increase in the labor market entry rate.
Similarly, the reform led to a sharp increase in the use of paid childcare among those who were already working 16 or more hours (Panel D). The overall effect of 3.8 percentage points represents 55 percent of the estimated rise in the employment persistence rate reported in Table 3. Again, the largest effects are found among single mothers with one child aged either 0–4 or 5–10: The rate of their childcare utilization increased respectively by about seven and four percentage points, regardless of how trends have been modelled.
Another way to illustrate the importance of the childcare subsidy is to relate it di-rectly to the demand for paid childcare services by working mothers with preschool children and school-aged children. As the demand by the former should be higher, we expect a greater response for this group. Of course, there may be a differential response to WFTC’s work incentives by child age irrespective of the demand for childcare. However, in absence of any childcare needs we would expect mothers of four-year-olds in 1999 to respond similarly to the WFTC reform as mothers of
five-year-olds. Any difference in response behavior between the two groups could then be legitimately attributed to differential childcare needs, given that children in the United Kingdom are legally required to start attending school after their fifth birthday. We performed a number of regressions on eligible employment and full-time employment distinguishing between specific child-age levels between ages two and age eight. The results, not shown for brevity, document that the largest em-ployment responses are found among mothers of three- and four-year-olds, with no discernable effect for mothers of five-year-olds and positive but smaller effects for mothers of children between the ages of six and eight. Especially noteworthy is the much smaller estimated increase in eligible employment around the age of school entry, which represents statistically significant drops from 15 and 18 percentage points for three- and four-year-olds, to two and four percentage points for five-and six-year-olds.
These estimates provide strong evidence suggesting that the childcare subsidy com-ponent of WFTC played a key role in producing the estimated large employment effects for single women with young children. The findings are new. Earlier studies on the WFTC reform did not explicitly examine it and generally assigned little impor-tance to this component. As summarized by Blundell and Walker (2001), previous re-search either ignored childcare costs or assumed a fixed relationship between childcare expenses and hours of work. For example, using simulations based on prereform data, Blundell et al. (2000) play down the importance of the childcare credit, arguing that while the reform was associated with a rapid increase in the takeup rate of the childcare credit (of more than 150 percent), the overall takeup rate among WFTC recipients in 2000 was only 10 percent. Our new findings however suggest that the increase in the childcare credit takeup rate was highly concentrated among newly eligible lone moth-ers, and played a key role in explaining the employment effects, and in particular those for mothers with young children. Relying on a fixed prereform hours-childcare expen-diture relationship in predicting employment responses is therefore likely to lead to invalid inferences, especially among mothers with children of preschool age.
corroborated by evidence of increases in both the takeup of childcare subsidies and in the supply of registered childcare places during the post-1998 period reported in Gray and Bruegel (2003).
VII. Impacts on Marriage and Fertility Choices
As discussed in Section II, the structure of WFTC may have affected lone mothersÕ partnership decisions because the program’s eligibility and benefit rules depend on a woman’s living arrangement. In addition, through the increase in the basic child benefit amounts (both under IS and WFTC) as well as more gen-erous childcare support, it may have affected subsequent fertility decisions of single mothers. There was also a cap on childcare support, and WFTC’s positive impact on employment may in fact have increased the cost of having additional children. As compared to the huge body of research on the effect of welfare reforms on marriage and fertility in the United States (for example, Eissa and Hoynes 2000, Schoeni and Blank 2000, Hotz and Scholz 2003, Bitler et al. 2004, and references therein), this literature is virtually nonexistent for Britain.
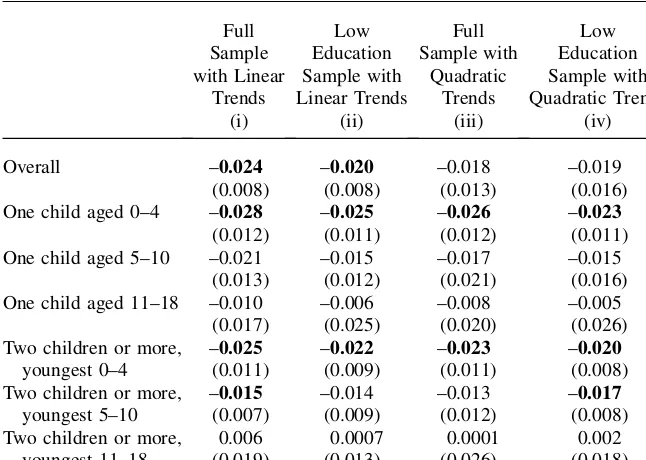
Table 6 presents effect estimates from linear probability models of transitions into partnership (marriage or cohabitation) for the sample of single childless women and lone mothers. We show overall effects and effects by age of the youngest child and number of children for the four usual sample/trend specifications. For each woman, the dependent variable takes value zero if the woman remains single, and value one if she married or cohabited, and after that point her observations are censored.
The overall estimates from Specification 1 indicate that the implementation of WFTC led to a sharp significant reduction in partnership rates.24Using single childless women as comparison group, the estimates imply that on average, with the WFTC re-form in place, lone mothers were 2.4 percentage points less likely to re-form a union. This effect is large, representing a 28 percent change with respect to the average annual (re)-partnership rate of 8.5 percent during the sample period (see Table 1). Most of that ef-fect was driven by mothers of preschool children, who experienced a reduction in the chances of forming a partnership by about 2.8 percentage points if they had one child. If their child was older, their probability of marriage was instead not significantly re-duced by the reform, although for mothers with two or more children with the youngest being aged ten or younger we found again strong negative and significant effects rang-ing between 1.5 and 2.5 percentage points. These results are robust to the more strin-gent selection on the educational attainment of single childless women (Column 2), as well as to the inclusion of quadratic trends, although the overall effects in Specifica-tions 3 and 4, while of similar magnitude, lose their statistical significance.
To see if the effects in Column 1 are stronger for younger individuals, we split the full sample in two groups of women (those aged 30 or younger and those older than 30), and reestimated transitions into partnership for the two groups separately using linear trends. A similar exercise was repeated for eligible employment. The results, not shown for convenience, reveal that the reduction in partnership rates affected all lone mothers regardless of their age. Likewise, the probability of being in eligible
employment seems to have increased uniformly in the two groups of women, with the slightly greater effect for young mothers, a difference of about 0.4 percentage points, being not statistically significant at conventional levels. These results suggest that the employment effects were not driven by younger women who could have been more likely to form a partnership or (as illustrated below) have an extra child. Panel A of Table 7 reports estimates from models of transitions into birth for the subsample of lone mothers from the second year they were observed in the panel on-ward. These estimates reveal that the partnership rate changes documented earlier were accompanied by a comparably large reduction in fertility rates among lone mothers. Overall, the postreform risk of having an additional child decreased by 0.7 percentage points (which represents almost a 20 percent change over the average annual birth rate for lone mothers during the sample period), but this effect is not statistically significant regardless of how trends are modeled. Similar results emerge when we consider fertility responses of mothers with children in different age
Table 6
Effects of Welfare Reform on Partnership Formation
Full One child aged 0–4 –0.028
(0.012) One child aged 5–10 –0.021
(0.013) One child aged 11–18 –0.010
(0.017)
Notes: Standard errors are shown in parentheses. Estimates in bold are significant at the 5 percent level. Estimates are obtained from linear probability models of transitions into partnership (marriage or cohabi-tation) on the subsample of single childless women and lone mothers. For each woman, the dependent vari-able takes value zero if the woman is single, and value 1 in the period when she forms a union (after which her observations are censored). Multiple entries for the same woman are allowed. Explanatory variables are listed in the notes to Tables 2 and 4 above. The trends (either linear or quadratic) are allowed to differ by children’s age group.Nis equal to 15,634 in the regressions of Columns (i) and (iii) and 10,265 in the regressions of Columns (ii) and (iv).
groups. We also found no significant difference in the estimated effects when distin-guishing women by age, as was the case for the partnership rate.
To the extent that WFTC allocated more benefits to single women with children than the previous Family Credit system did, it could have provided greater incentives for entering lone motherhood. Thus, the social benefits documented so far in terms of better labor market outcomes for lone mothers could have been offset or reversed if the new program encouraged a greater proportion of women to become lone mothers. We explore this possibility by estimating linear probability models of transitions into lone motherhood for the subsample of single childless women only.25The results in Panel B of Table 7 show little evidence of this unintended effect. In fact, the intro-duction of WFTC had the opposite impact, reducing the propensity of single
Table 7
Effects of Welfare Reform on Fertility
Linear Trends Quadratic Trends
A. Birth rate (lone mothers only)a
Overall –0.007
(0.005)
–0.007 (0.008)
One child aged 0–4 –0.006
(0.008)
–0.004 (0.011)
One child aged 5–10 –0.010
(0.011)
–0.009 (0.013)
One child aged 11–18 –0.009
(0.012)
–0.010 (0.016) Two children or more, youngest 0–4 –0.003
(0.017)
–0.001 (0.017) Two children or more, youngest 5–10 –0.002
(0.014)
–0.003 (0.015) B. Entry into lone motherhood
(single childless only)b
–0.0016 (0.0021)
–0.0010 (0.0027)
a. Obtained from linear probability models of transitions into birth on the subsample of lone mothers from the second time they were observed in the panel onward. Explanatory variables are listed in Tables 2 and 4. In the regressions that distinguish number of children and age of the youngest child, the base category is two or more children with the youngest aged 11–18. All regressions are performed on 4,782 observations. b. Obtained from linear probability models of transitions into lone motherhood for the subsample of single childless women. For each woman, the dependent variable takes value zero if the woman is single childless, and value one in the period when she has a child (after which her observations are censored). Explanatory variables are listed in Tables 2 and 4. Both regressions are performed on 6,410 observations.
Notes: Standard errors are shown in parentheses.
childless women to form lone-mother households by almost 0.2 percentage points, which represents a further 15 percent decline over the average rate of entry into sin-gle motherhood for sinsin-gle childless women during the panel years (linear trend). This effect is however not statistically significant. Similar results are found with a qua-dratic trend specification, and with the low education sample (not shown). Interest-ingly, these results are in line with those presented for the United States by Moffitt (1994) and Hoynes (1997), although they analyzed welfare effects on female head-ship for married mothers, thus through separation or divorce.
VIII. Conclusions
In October 1999, the Working FamiliesÕTax Credit replaced Family Credit as the main package of in-work support for low-income families with children in Britain. This paper examines the impact of WFTC on lone mothers using for the first time data drawn from the British Household Panel Survey and collected between 1991 and 2001. Our study identifies the effect of the reform through comparisons of changes in behavior for lone mothers and single women without children. It contrib-utes to the existing literature in two important ways. First it considers effects on a wide set of socioeconomic outcomes, some of which have never been examined be-fore in the British context. Second, it uses specific aspects of the reform design and the panel nature of the data to understand how the estimated responses came about and identifies which parameters of the reform were more likely to explain such effects.
effect was concentrated among mothers with preschool-aged children. Similarly, among single mothers who continued to be in employment, more than 50 percent of their greater postreform labor market attachment is observed in conjunction with paid childcare services.
This latter finding, indicating that a childcare credit can be an effective tool in attract-ing sattract-ingle mothers to the labor force, also informs the current childcare policy debate in other countries, including the United States. Although several states have their own childcare subsidies and tax credits, the main federal childcare program is the Child and Dependent Care Tax Credit. Theoretically, the credit can be worth up to 35 percent of childcare costs, but in practice—given a maximum limit on eligible expenses and the fact that the rate phases down with income—most families receive a much lower 20 percent credit. The credit has been criticized for being regressive and poorly targeted, which is due in large part to the fact that the credit, unlike WFTC, is nonrefundable (Burman et al. 2005). As a result, low-income families who have no income tax liability to offset do not benefit from the credit, while higher-income households claim a dis-proportionate share of the subsidy. As current work requirements for welfare recipients in the United States appear to reflect society’s preferences for low-income single parents to work outside the home, even if they have young children requiring care, it may be worthwhile to consider childcare subsidies that help make this feasible. Given its effectiveness, the British policy of a more generous, refundable credit that is paid on a monthly basis (instead of an end-of-the-year payment) seems worthy of consideration to help induce lone mothers, especially those too cash-constrained to pay for childcare, to enter the labor market.
The results that WFTC played a key role in the employment increases for lone moth-ers suggest therefore that in-work benefit policies can be successful in encouraging work among lone mothers. However, a comprehensive evaluation also must take into account other results—such as the reduced marriage rates and increased childcare use among single women with children—that measure the effects of the reform not only on mothersÕwellbeing but also on their children’s. Whether and how WFTC and its successors, however, will alleviate child poverty or deprivation through better child outcomes (such as greater cognitive development and mental health, fewer tru-ancy and early behavior problems, and higher educational attainment) remains to be seen.
References
Anderson, Patricia, and Phillip Levine. 2000. ‘‘Child Care and MothersÕEmployment
Decisions.’’ InFinding Jobs: Work and Welfare Reform, ed. David Card and Rebecca
Blank New York: Russell Sage.
Bertrand, Marianne, Esther Duflo, and Sendhil Mullainathan. 2004. ‘‘How Much Should We
Trust Differences-in-Differences Estimates?’’Quarterly Journal of Economics119(1):
249–75.
Bitler, Marianne P., Jonah B. Gelbach, Hilary W. Hoynes, and Madeline Zavodny. 2004. ‘‘The
Impact of Welfare Reform on Marriage and Divorce.’’Demography41(2):213–36.
Blau, David M. 2001.The Child Care Problem: An Economic Analysis.New York: The Russell