Correspondence:
Aly Diana, Department of Medical Nutriion, Faculty of Medicine, Universitas Padjadjaran
Jl. Eijkman No. 38, Bandung 40161, Indonesia e-mail: [email protected]
Preliminary Study: Glycemic Index of Brown and White Rice Variant IR64 in
Healthy Adult Men
Nur Irika bini Idril,1 Aly Diana,2 Abdullah Firmansyah Wargahadibrata2
1Faculty of Medicine, Universitas Padjadjaran
2Department of Medical Nutriion, Faculty of Medicine, Universitas Padjadjaran
Abstract Objecive: To measure the glycemic index of brown and white rice in healthy
adult men.
Methods: The study was conducted in April 2010 at Universitas Padjadjaran,
Jainangor. Subjects of 21 healthy male students were randomly divided into 3 groups, which were given white bread (WB), white rice (WR) and brown rice (BR).
Results: The results show that the highest and lowest average values of the blood
glucose response was in the WR group at 30 minutes (126.9 mg/dL) and at 120 minutes (87.4 mg/dL), respecively. The glycemic index of brown rice (97.28) was lower compared to the white rice (99.26).
Conclusions: Both WR and BR are classiied as high glycemic index food. The higher
glycemic index of brown rice, compared to the index found in other literatures, may be caused by diferences in variant and/or producion process. This study suggested the importance of evaluaion of local products before promoing it to the community.
Keywords:Blood glucose level, brown rice, glycemic index
IJIHS. 2013;1(1):37–41
Introducion
In most countries, especially in many developing countries, have undergone the dual burdens of disease. The prevalence of non-communicable and degeneraive diseases has increased while the prevalence of communicable diseases is sill high.1,2 A lot of studies indicated that most of
the degeneraive diseases are related to current lifestyle, especially the nutriion intake related to high glycemic index.3,4 This fact has urged other
studies to ind alternaive food which provide less risk and can add beneits to health.
Since rice is the major source of carbohydrate in most Asian populaions, including Indonesia, inding beter alternaive types of rice is essenial. Many studies have explained the health beneits of brown rice (BR), including its advantages for diabeic paients.5,6 Brown rice sill has its bran
layers, which make the BR an excellent source of magnesium, iron, selenium, manganese, vitamins B1, B2, B3 and B6, dietary iber, and protein.5
The dietary iber in bran layer traps nutrients, delaying their transit through gastrointesinal tract which leads to slower glucose absorpion. As a result, the glycemic index of BR is lower than white rice (WR).5-7 Consequently, BR is
considered as a healthier and safer subsitute for WR. Nevertheless, the posiive efect of BR (IR64 variant) which is locally produced and commonly consumed in Indonesia, on blood glucose level of the adult populaion is unknown. Therefore, this study aims to measure glycemic index of BR and WR ater consumpion in healthy adult men.
Methods
This study was an experimental study. Men, 19– 24 years old with normal body mass index (18.5– 22.9), waist circumference of ≤90 cm, no history of chronic disease, and were not on medicaion, were included as the subjects for the study. They also had normal fasing blood glucose level.
The study was conducted in April 2010. The number of subjects in this study was 21 men, picked randomly from the populaion of medical students in Universitas Padjadjaran. They were
further divided into 3 groups. White bread (WB) group was the standard group, which was given 108 gram WB and water. The WR group was the control group, which was given 113 gram WR of IR64 variant and water. The BR group was the intervenion group, which was given 123 gram BR of IR64 variant and water. The amount of the food given was diferent, but they all contained 50 gram of carbohydrate. Both WR and BR were recently cooked and the subjects had to inish the food within 10 minutes.
The independent variables included WR and BR, while the dependent variable was glycemic index. The BR glycemic index was lower (97.28) compared to that of WR (99.26) (Table 2). WR
in this study was the IR64 variant which was polished unil its color became white. Brown rice was the IR64 variant that was undergone several processes, including removal of the husk part. However, the bran layer is sill intact because there was no polishing process performed. The glycemic index is the area under the blood glucose curve ater consuming 50 gram of carbohydrate. The curve was calculated for each type of food by taking blood samples from paricipants at 0 minute (fasing blood glucose) and every 30 minutes ater consumpion for two hours. The analysis was conducted to compare the glycemic index of WR and BR by using the glycemic index of bread as the standard measurement. The
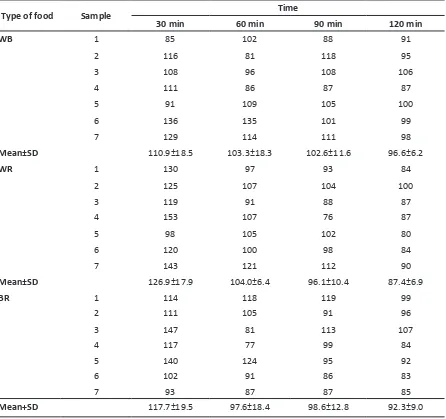
Table 1 Mean of Blood Glucose Response in WB, WR, and BR Groups
Type of food Sample Time
30 min 60 min 90 min 120 min
WB 1 85 102 88 91
2 116 81 118 95
3 108 96 108 106
4 111 86 87 87
5 91 109 105 100
6 136 135 101 99
7 129 114 111 98
Mean±SD 110.9±18.5 103.3±18.3 102.6±11.6 96.6±6.2
WR 1 130 97 93 84
2 125 107 104 100
3 119 91 88 87
4 153 107 76 87
5 98 105 102 80
6 120 100 98 84
7 143 121 112 90
Mean±SD 126.9±17.9 104.0±6.4 96.1±10.4 87.4±6.9
BR 1 114 118 119 99
2 111 105 91 96
3 147 81 113 107
4 117 77 99 84
5 140 124 95 92
6 102 91 86 83
7 93 87 87 85
Mean+SD 117.7±19.5 97.6±18.4 98.6±12.8 92.3±9.0
confounding factors, i.e. age, gender, BMI, and waist circumference were controlled through the inclusion criteria. Therefore, these factors were not taken into account in the analysis.
Table 2 Glycemic Index of Both BR and WR
Type of food
Increment area
under the curve (IAUC)
Glycemic index (GI)
WB 9287.14 100.00
WR 9218.57 99.26
BR 9034.29 97.28
Results
The lowest and highest average values of the blood glucose response were found in the WR group at 120 minutes (87.4 mg/dL) and at 30 minutes (126.9 mg/dL), respecively. There was no signiicant diference in mean and median of each group (Table 1). The glycemic index was
then calculated using the trapezoidal method to measure the increment area under the curve (IAUC) and the formula below:8
IAUC for blood glucose response for a type of food
Glycemic Index = x 100
Corresponding area ater equicarbohydrate porion
of reference food
Discussion
The blood glucose increment in BR group was lower than WR group in the irst 30 minutes in this study. However, the blood glucose level in WR group seemed to decrease to a lower level compared to the blood glucose level in BR group. Blood glucose level in BR group was seen at a higher level, which was sustained unil 120 minutes.
Various literatures consist of grey literatures and clinical studies7, 9–11 suggest that BR has lower
glycemic index and can be classiied as food with
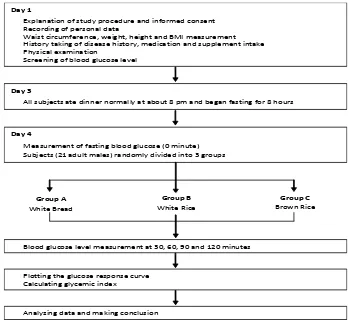
Day 1
Explanation of study procedure and informed consent
Recording of personal data
Waist circumference, weight, height and BMI measurement History taking of disease history, medication and supplement intake Physical examination
Screening of blood glucose level
Day 3
All subjects ate dinner normally at about 8 pm and began fasting for 8 hours
Day 4
Measurement of fasting blood glucose (0 minute) Subjects (21 adult males) randomly divided into 3 groups
Group A White Bread
Group B White Rice
Group C Brown Rice
Blood glucose level measurement at 30, 60, 90 and 120 minutes
Plotting the glucose response curve Calculating glycemic index
Analyzing data and making conclusion
moderate glycemic index (55–70). However, our experiment shows that although the glycemic index of BR is lower than WR, both BR and WR glycemic index is classiied as high (70–100).
The study in Japan stated that the glycemic index of BR is 61.5, lower than the inding in this experiment.7 These diferent results may be
related to the variant or species of rice used in the study. In the previous study in Japan, the type of BR tested was the short grain rice (Japonica) produced in Hokkaido, Japan. Meanwhile, the BR variant used in this study is IR64. The IR64 variant was used because it is considered the type of rice most commonly consumed in Indonesia.
The diferent variant may inluence the starch content in the rice. Although it was not tested in this experiment, the IR64 BR might have a higher starch content compared to Japonica variant. The diferent variants may have diferent iber content in the bran layer. The Japonica variant might have higher iber content than the IR64 which making it more resistant to the α-amylase acivity and slowing down the absorpion process in the intesine. The WR from Japonica variant has moderate glycemic index.11
The paricipant individual diferences may also afect the glycemic index of the BR and WR. These diferences may be due to the race or the rice consumpion habit of the paricipants.12
Frequent rice consumpion might have inluenced the digesion or digesive enzymes by increasing
the eicacy of the digesive enzymes. This leads to faster and more eicient carbohydrate absorpion that triggers a higher blood glucose response.13
There are several limitaions in this study. First, the study was only performed in 1 day whereas in a previous similar study, the measurement was performed ater the paricipants consumed both BR and WR for several days. The second limitaion is that the measurement of carbohydrate in the food given to all paricipants is done based on the food composiion table (Datar Komposisi
Bahan Makanan, DKBM).14 DKBM is the standard
food reference table in Indonesia. However, the DKBM values may not be accurate as food may vary depending on the method of producion, the species or variant of rice, and other factors.
Despite the limitaions, this study showed that rice variant and producion method may impact the glycemic index. Therefore, this result also suggested the importance of local product evaluaion. This is especially important for food products that are not only afected by geographic condiions (soil contains, environment factors) but also the variant and the processes from the producion to consumpion.13 An experimental
study that addressed all of these contribuing factors should be conducted before a decision to encourage or discourage promoion of BR as a beter subsitute for WR to public in Indonesia is made.
References
1. Popkin BM. Global nutriion dynamics: the world is shiting rapidly toward a diet linked with noncommunicable diseases. Am J Clin Nutr. 2006;84(2):289–98.
2. Doak CM, Adair LS, Bentley M, Monteiro C, Popkin BM. The dual burden household and the nutriion transiion paradox. Int J Obes. 2005;29(1):129–36.
3. Augusin LS, Franceschi S, Jenkins DJ, Kendall CW, La Vecchia C. Glycemic index in chronic disease: a review. Eur J Clin Nutr. 2002;56(11):1049–71. 4. Jenkins DJ, Kendall CW, Augusin LS, Franceschi
S, Hamidi M, Marchie A, et al. Glycemic index: overview of implicaions in health and disease. Am J Clin Nutr. 2002;76(1):266–73.
5. Babu PD, Subhasree RS, Bhakyaraj R, Vidhyalakshmi R. Brown rice - beyond the color reviving a lost health food - a review. American-Eurasian J Agronomy. 2009;2(2):67–72.
6. Panlasigui LN, Thompson LU. Blood glucose
lowering efects of brown rice in normal and diabeic subjects. Int J Food Sci Nutr. 2006;57(3– 4):151–8.
7. Ito Y, Mizukuchi A, Kise M, Aoto H, Yamamoto S, Yoshihara R, et al. Postprandial blood glucose and insulin responses to pre-germinated brown rice in healthy subjects. J Med Invest. 2005;52(3– 4):159–64.
8. Sugiyama M, Tang AC, Wakaki Y, Koyama W. Glycemic index of single and mixed meal foods among common Japanese foods with white rice as a reference food. Eur J Clin Nutr. 2003;57(6):743– 52.
9. The GI diet guide [database on the Internet]. 2011 [cited 2012 Jan 25]. Available from: htp:// www.the-gi-diet.org/lowgifoods/.
10. Indrasaria SD, Purwanib EY, Wibowoa P, Jumalia. Glycemic Indices of some rice varieies. Indonesian J Agriculture. 2010;3(1):9–16.
Internaional table of glycemic index and glycemic load values: 2002. Am J Clin Nutr. 2002;76(1):5– 56.
12. Egede LE, Mueller M, Echols CL, Gebregziabher M. Longitudinal diferences in glycemic control by race/ethnicity among veterans with type 2 diabetes. Med Care. 2010;48(6):527–33.
13. Vosloo MC. Some factors afecing the digesion of glycaemic carbohydrates and the blood glucose response. J Family Ecol Consumer Sci. 2005;33:1–9.
14. Direktorat Gizi Departemen Kesehatan. Datar
komposisi bahan makanan. Jakarta: Bhratara