www.elsevier.com/locate/econedurev
Accounting for the effects of increased high school
graduation expectations on pupil performance and resource
allocation: results from New York State
David H. Monk
a,*, Samid Hussain
b, William Miles
caCollege of Education, The Pennsylvania State University, 275 Chambers Building, University Park, PA 16802, USA bDepartment of Education, Cornell University, Ithaca, NY 14853, USA
cOtsego Northern Catskills Board of Cooperative Educational Services (BOCES), Stamford, NY 12167, USA Received 15 December 1997; accepted 15 June 1999
Abstract
Increases in high school graduation requirements are prompting interest in the consequences for students, taxpayers, and educators. This study examines the experiences of New York State school districts that increased student partici-pation between 1992 and 1996 in a statewide testing program that historically has been designed for college-bound students. The study includes statistical comparisons based on the universe of school districts in the State as well as the results of an intensive set of selective case studies. The results show that many different types of districts moved to increase participation levels during the study period and that increases in participation levels were associated with (a) modest declines in the percentage of students passing the exams; (b) unchanged drop-out rates; (c) increases in spending that were similar in magnitude to increases found in districts with little or no increase in participation; and (d) increases in professional staffing levels in core instructional areas. Implications for policy are explored. 2000 Elsevier Science Ltd. All rights reserved.
JEL classification: I21; I22
Keywords: Performance based reform; Education productivity; Student performance
1. Introduction
States throughout the US are moving aggressively to raise requirements for high school graduation (Education Week, 1997b). New York State, in particular, has sig-nificantly increased its graduation requirements so that all students entering 9th grade in the year 2001 will be required to pass state-developed Regents achievement examinations in English, mathematics, science, US his-tory, and global studies. New York is no stranger to the
* Corresponding author. Tel.+1-814-865-2526; fax: +1-814-865-0555.
E-mail address: [email protected] (D.H. Monk).
0272-7757/00/$ - see front matter2000 Elsevier Science Ltd. All rights reserved. PII: S 0 2 7 2 - 7 7 5 7 ( 0 0 ) 0 0 0 0 8 - X
use of state developed achievement exams, but histori-cally these exams have been taken only by college-bound students. In 1996, about 40% of the graduates in New York State received Regents diplomas by passing exams of this kind, while the majority earned local diplomas by passing less demanding competency exams (Education Week, 1997a).
have been moving toward an ‘all-Regents’1 secondary
program on their own initiative, perhaps in anticipation of the requirements now being promulgated by the Regents. The study is organized around three primary questions:
1. What explains the willingness or ability of school dis-tricts to increase Regents achievement examination participation rates?
2. What have been the effects on student perform-ance? and
3. What have been the changes in resource allocation behavior?
We turn next to a description of the data and methods we employed and then to an overview of our findings. We conclude with a discussion about implications for policy.
2. Data and methods
2.1. Data
Our findings are based on two complementary sources of data. We began by taking advantage of data that are routinely collected by the State Education Department. These data include information about the Regents testing program in addition to resource allocation information that can be gleaned from the State’s Basic Education Data System. We are indebted to members of the staff at the State Education Department for the assistance we received in gaining access to these data.2
We have been fortunate to be able to complement these statewide data with the results of a series of case studies that were conducted during the summer of 1997 at ten sites around the State where significant efforts have been made to move the schools toward an ‘all-Regents’ program. The site visits were conducted by staff from several BOCES under the leadership of the District Superintendent of the Otsego Northern Catskills (ONC) BOCES.3
1 Hereafter, we shall use the terms ‘all-Regents’ to describe instances where substantive increases have occured in the per-centage of students taking Regents achievement examinations. We shall also use the term ‘Regents exam’ to refer to the con-tent based achievement exams that historically have been taken by college-bound students in New York State.
2 We are particularly grateful for the assistance provided by Nick Argyros, Mark Barth, Sam Corsi, George Cronk, Diane Hutchinson, and Edward Lalor.
3 The following individuals participated in the development and conduct of the case study research: Nick Argyros, Mark Barth, John Bishop, Jim Carter, Jim Collins, Judy Fink, Marla Gardner, John Grant, Samid Hussain, William Miles, David Monk, Edward Moore, Joan Moriarty, and Marie Warchol.
2.2. Statewide data and analysis
We were particularly interested in measures of partici-pation by students in the Regents’ achievement examin-ation program. The State Educexamin-ation Department main-tains a data base that includes measures of the percentage of students writing each of the achievement examin-ations. These examinations are taken at different points during the year (the exams are most typically adminis-tered in June of each year, but some are also offered in January and in some cases August), and students take them at different points in their respective high school programs (e.g., some students will take the Course I mathematics exam at the end of 8th grade while others will do so at the end of 9th grade).
We measured the level of participation in the Regents exam program for each district by averaging the exam specific participation rates for the English, Course I (mathematics), Global Studies, and US History examin-ations. The base pupil count we used for the calculation of these percentages was the average enrolment statistic for grades 9–12 that is maintained by the State Education Department. It is possible that these averages mask important differences across the exams, but we believe that the average figure provides the best available overall index of the degree to which a district has moved for-ward with an ‘all-Regents’ approach to its secondary program.
With participation as our starting point, we moved in two directions to identify additional variables of interest for our analyses. On the one hand, we sought insight into the antecedents of changes in participation rates. We were particularly interested in knowing more about what gives rise to a given district’s inclination to increase its percentage of students participating in the Regents test-ing program. Toward this end, we identified a series of district background characteristics that we believe could have bearing on student participation rates. These included: district type (i.e. urban, suburban, or rural), full value property wealth per pupil, the incidence of poverty as measured by the presence of students in the free and reduced price lunch program, and district size (as meas-ured by enrolment). Given the longitudinal nature of the inquiry, we also became interested in the effects of changes that have occurred in these structural character-istics over the period we studied (1992–96).
On the other hand, we were interested in learning more about the effects of changes in participation rates on various phenomena including measures of pupil per-formance and district resource allocation behaviors. The desire to move in this direction prompted us to collect data about pupil performance on Regents exams, drop-out rates, district spending levels per pupil, and district professional staffing levels on a subject specific basis.
are measures of percentages passing the exam. It would have been much preferable to have averages of students’ scores, but these data are not maintained by the State. Our student test score performance measure is change in the percentage of test takers who passed the Regents exam. The statistic we relied upon is an average of pass-ing rates for the four Regents examinations that we have been considering: Course I (mathematics), English, Glo-bal Studies, and US History. For our drop-out statistic, we relied upon calculations from the State Education Department.
District spending levels were obtained from the School Financial Master File (SFMAST) data files, and subject specific professional staffing levels were obtained from the Institutional Master File (IMF) and the Person-nel Master File (PMF) of the Basic Education Data Sys-tem (BEDS) that is collected and maintained by the State Education Department. Again, because of the longitudi-nal nature of the inquiry, we collected these data for the 1992–93 as well as for the 1996–97 school years. Several of our variables are simple difference scores that are based on data drawn from these two years.
We needed to make decisions about how to treat the Big 5 city districts (New York City, Buffalo, Syracuse, Rochester, and Yonkers) in these analyses. Because of the unique features of the Big 5 districts, we treated them separately from the other districts in our sample and did not include them in our regression analyses.
Our analysis of the statewide data relies heavily on a series of multiple regression models using ordinary least squares (OLS) and weighted least squares (WLS) esti-mating techniques.4 The weighted least square (WLS)
models are weighted by 8–12 enrolments as grades 8– 12 enrolment are most likely to be affected by partici-pation in the Regents’ examinations.5In general, we find
the effects of most of the predictor variables to be fairly consistent across the two estimation methods.
We report our results step by step in the order sug-gested by the questions we used to guide the analysis. We begin with an analysis of relationships between dis-trict background structural characteristics and the degree of student participation in the Regents achievement examination program. We next turn to a series of analy-ses that give information about the effects of increaanaly-ses in participation on student performance, both in terms of test score results and decisions about persistence in
4 To control for the simultaneity bias that arises due to the endogeneity of the change in participation variable, we initially planned to instrument change in participation between 1992 and 1996 by measures of districts’ preferences, lagged changes in participation, and administrative turn over. However, these measures were not available to us.
5 The results are similar when we weight by total district enrolment.
school. We then look to see if we can identify effects of increases in participation on resource allocation practices by school districts. We are particularly interested in both changes in overall spending and staffing levels and shifts in how existing resources have been allocated.
2.2.1. Case study data and analysis
One of the purposes of the case studies was to allow us to look more closely at the experiences of districts that had moved forward with ‘an all-Regents’ approach and to find out more about what the change meant in the lives of pupils, teachers, administrators, board members and taxpayers. In our selection of sites we sought places where there was a significant increase in the percentage of students taking the Regents exams. We defined ‘sig-nificant’ to mean a 25 point increase in the percentage of students taking Regents exams between 1992 and 1996. We were also interested in places where the results in terms of performance looked encouraging. Specifi-cally, we looked at what happened to the percentage of students passing these exams and focused our attention on sites where performance either held steady or increased. In other words, we were looking explicitly for districts that appeared to be having success with the all-Regents initiative. We were also interested in achieving a spread of districts across the different regions of the State. We made sure that we had representatives of dif-ferent types of districts (urban, suburban, and rural).6
Finally, we compared the districts that we identified using these methods with a list of districts that were nominated by the District Superintendents of the State as good examples of ‘all-Regents’ programs. Where possible we focused attention on the nominated districts.7
Table 1 provides a characterization of the ten sites. The site visits took place during one- or two-day visits in the summer and early fall of 1997. Interviews were conducted with administrators, teachers, and to a lesser degree school board members and community leaders. Questions were asked about the antecedents of the increase in participation and the consequences for stu-dents, teachers and school officials, and taxpayers. The interviews were taped and the results were later com-piled. In this paper, we will deal with findings that per-tain to the decision to move forward with an ‘all-Regents’ program as well as with findings about changes in the use of resources.
6 Our desire to have all three types of districts represented within the sample forced us to accept one site that did not meet the 25 percentage point increase criterion. This was an urban district whose gain in participation was high relative to the experiences of other similar urban districts.
Table 1
Characteristics of the ‘all-Regents’ case study sites Urban Suburban Rural
Eastern 2
Northern 1 1
Western 1 1
Central 1
Southern Hudson 2
Long Island 1
Total 2 6 2
3. Results
Table 2 reports basic descriptive statistics that are use-ful to keep in mind. During the 1992–93 school year, on average, 65% of the students enrolled in grades 9–12 in New York State high schools (excluding the Big 5 city districts) were taking Regents examinations. The inci-dence of Regents test taking increased significantly over the period we studied and by the 1996–97 school year it had reached close to 76%, better than a 10 percentage point gain. A particularly large percentage increase can be observed for New York City in Table 2. Regents par-ticipation increased in New York City by more than 30 percentage points during the four year period we studied. Part of this increase can be explained by a dramatic increase in the participation rate in mathematics (i.e. it increased by 55 percentage points).8On the other hand,
the Big 4 districts (Buffalo, Rochester, Syracuse, and Yonkers) did not register similar increases. In fact, we found an average decline for this group. A closer exam-ination of the Big 5 districts revealed that the
partici-Table 2
Mean participation rates for regents achievement examinationsa with standard deviations in ()
Whole state NYC (n=1) Big 4 (n=4) (n=580)
1992 Average 65.27 30.50 55.19
participation (12.88) – (15.58)
1996 Average 75.97 63.75 49.00
participation (15.22) – (16.92)
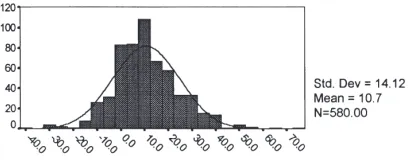
Ave change in 10.70 33.25 26.19 particip 92–96 (14.12) – (3.70)
a Figures are averages of the percentage of students in grades 9–12 taking Regents achievement examinations in Course I (mathematics), English, Global Studies, and US History.
8 As well, the participation rates in other Regents examin-ations (i.e. English, Global Studies, and US History) increased an average of 25 percentage points.
pation rate for New York City in 1992 was much lower compared to the Big 4 and hence the dramatic increase over the next four years brought the participation rate closer to its counterpart city districts. We also note that the average decline in participation for the Big 4 is mostly explained by declines in participation for Buffalo and Rochester (both decreased in the neighborhood of 9 percentage points). We were unable to correlate any of the structural features of these city districts to the changes in participation. With regards to the implications of these changes for the Big 5 districts, we found that the percentage of test takers passing Regents examinations increased for the Big 4 (by approximately 5 percentage points) while this statistic declined by 12.75 percentage points for New York City. Also, it is interesting to note that the academic staff per 1000 district pupils for the Big 4 remained intact during this time period while New York City experienced a decrease in the academic staff. The standard deviations in Table 2 warrant comment. There is a significant degree of variation around the means that we report. Indeed, for the State as a whole in 1992–93 the districts ranged from a low participation rate of 20.3% to a high of over 100%.9In 1996–97, the
districts ranged between a low of 20.5% and a high of 152.8%. We also found that while the average rate of participation grew over the period, participation rates in no fewer than 107 districts declined. Fig. 1 provides an illustration of how the districts are distributed across dif-ferent magnitudes of change in participation during the period. The figure makes it quite clear that some districts have been moving in a direction that runs counter to the State’s current efforts to increase Regents examination participation rates.
Question 1: What explains the willingness or ability of school districts to increase Regents examination participation rates?
Fig. 1. Changes in percentage of 9–12 enrolments taking Regents’ exams (1992–96).
3.1. Results from the statewide data
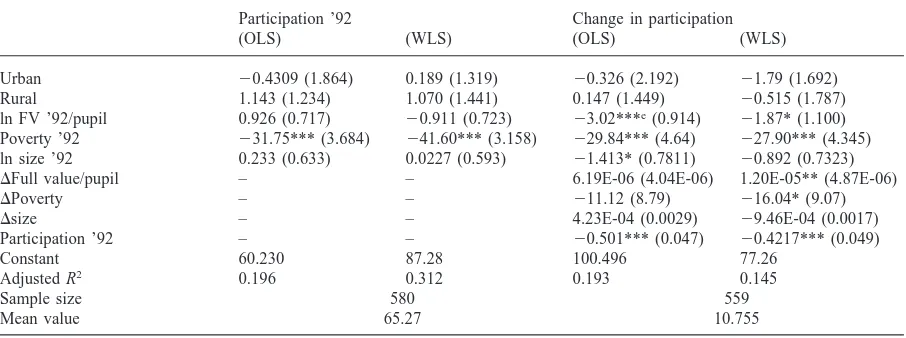
As we realized how varied New York districts are with respect to both the level of participation in the Regents exam program and their inclination to increase these par-ticipation rates, we became interested in seeing if we could identify structural characteristics that are associa-ted with these phenomena. In particular, we wanassocia-ted to know if there are some clear distinguishing character-istics of the districts that increased the percentage of stu-dents who participated in the Regents testing program, and we thought it would be useful to look at relationships between the structural features we identified (district type, property wealth, incidence of poverty, and size) and both the incidence of test taking in 1992 and changes in test taking between 1992 and 1996.
Our regression results suggest that many different types of districts are represented among those who increased their Regents participation rates during the per-iod we studied. In other words, we found no evidence suggesting that increasing districts were more likely to be urban rather than suburban or rural, large rather than small, or wealthy in terms of property wealth rather than poor. One notable exception to this involves our measure of the incidence of poverty where we did find that higher levels of poverty were associated with both lower levels of Regents participation in 1992 and smaller increases in participation between 1992 and 1996. More specifi-cally, we found that a 10% higher incidence of poverty in 1992 was associated with a 7.34% decline in the rate of participation over the next four years (see Table 3).10
Another exception is the positive correlation between increases in full value per pupil and participation in Regents’ examinations between 1992 and 1996.
We also found that districts reporting high pation rates in 1992 reported smaller increases in partici-pation over the period we studied. We interpret this as a ceiling effect in the sense that if the district already has a high rate of participation, it becomes more difficult to increase the rate further. The marginal cost of increas-ing participation rates must surely rise with the percent-age of students participating at the outset, and the nega-tive relationship we are finding in our regression analyses between 1992 participation rates and sub-sequent increases in participation is consistent with this expectation.
10 This marginal effect is determined by calculating the elas-ticity at the mean values and then multiplying it by 10. The New York State average measures for incidence of poverty (in 1992) and change in participation are 0.28 and 10.70 respect-ively. Hence, the elasticity is (dy/dx)(x/y)=(227.9)(0.28)/10.7 =20.734.
3.2. Results from the case studies
The case studies reveal a number of ‘critical factors’ that appear to have important influences on school dis-tricts’ willingness or ability to move forward with an ‘all-Regents’ reform agenda. Table 4 provides a list of these characteristics. We hasten to point out that we can-not generalize from this list. Nor is it the case that all of these phenomena were found in each of the ten case study sites. The list provides a sampling of the kinds of things respondents mentioned when they were asked about what gave rise to the reform.
We have several observations to make about the list. First, some of the items are not easily transferred from one place to another. For example, ‘amicable relation-ships with bargaining units’ can be elusive, and the case studies do not offer much insight into what needs to be done to increase Regents participation rates in places where labor relations are less than good.
Second, and in contrast, some of the items look like they are relatively easy to transfer to other sites. For example, we were impressed with how the maintenance of some kind of upper-level honors program seemed to make it easier to raise Regents participation rates.
And third, we were struck by the fact that a number of the items require a willingness of leaders at the local level to take real risks. We think the last two items on the list fall into this category. It takes considerable self-confidence to convince teachers and parents that the necessary support will be provided when the uncertainty surrounds the source, magnitude and nature of this sup-port.
Question 2: What have been the effects on student performance?
We dealt explicitly with two aspects of student per-formance: changes in test score results and changes in drop-out rates over the period. These findings all come from the statewide data, and we discuss our results for each aspect of student performance in turn.
3.2.1. Changes in the percentage of students passing
We found that for the State as a whole, the passing rate for the non-Big 5 districts went up by 2.68 percent-age points. The increase was the largest for the districts that decreased participation. It went up by better than eight points for these districts. The magnitude of the average increase went down as the magnitude of the change in participation rate increased and turned nega-tive for the districts that increased their participation the most.
Table 3
Predictors of initial percentage of students in grades 9–12 taking Regents’ examinations in 1992 and predictors of changes in the percentage of students in grades 9–12 taking Regents’ achievement examinationsabetween 1992 and 1996b,c,d
Participation ’92 Change in participation
(OLS) (WLS) (OLS) (WLS)
Urban 20.4309 (1.864) 0.189 (1.319) 20.326 (2.192) 21.79 (1.692)
Rural 1.143 (1.234) 1.070 (1.441) 0.147 (1.449) 20.515 (1.787)
ln FV ’92/pupil 0.926 (0.717) 20.911 (0.723) 23.02***e(0.914) 21.87* (1.100) Poverty ’92 231.75*** (3.684) 241.60*** (3.158) 229.84*** (4.64) 227.90*** (4.345) ln size ’92 0.233 (0.633) 0.0227 (0.593) 21.413* (0.7811) 20.892 (0.7323)
DFull value/pupil – – 6.19E-06 (4.04E-06) 1.20E-05** (4.87E-06)
DPoverty – – 211.12 (8.79) 216.04* (9.07)
Dsize – – 4.23E-04 (0.0029) 29.46E-04 (0.0017)
Participation ’92 – – 20.501*** (0.047) 20.4217*** (0.049)
Constant 60.230 87.28 100.496 77.26
Adjusted R2 0.196 0.312 0.193 0.145
Sample size 580 559
Mean value 65.27 10.755
a The dependent variable is an average for Course 1 (mathematics), English, Global Studies, and US History.
b The sample does not include the Big 5 districts and the districts for which participation and performance information is not avail-able.
c The WLS has been weighted by (8–12) enrolments. d Regression coefficients with standard errors in (). e *P,0.1, **P,0.05, ***P,0.01.
Table 4
Precursors and precipitators of movement toward ‘all-Regents’ programs. Findings from the ten case studies
Administrative turnover
A cooperative internal unit (e.g. a department within a high school)
Ability and willingness to block alternatives to the regents exams (e.g. requirement of a superintendent’s hearing) Amicable relationships with bargaining units
Commitment to the maintenance of an honors track Maintenance of data and the monitoring of progress Willingness to view the reform as k12 rather than secondary school only
Perception in the community that necessary support services will be available
Perception among teachers that appropriate inservice programs will be available
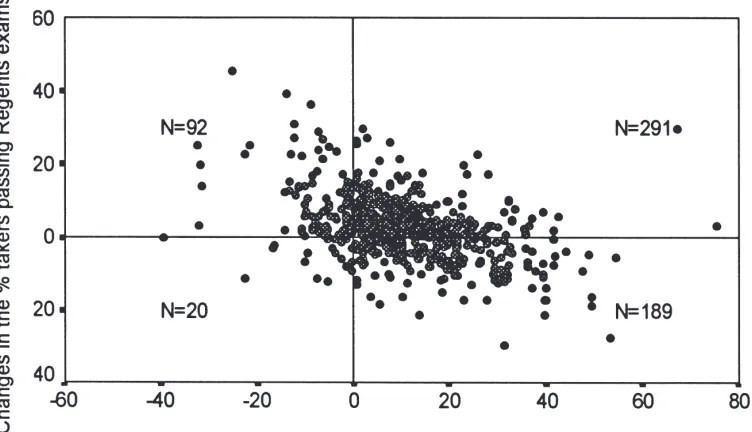
performance. The change in participation is on the hori-zontal axis and the change in performance is on the verti-cal axis.
There are several things to notice in the scatterplot. First, the drift of the points is negative suggesting that higher rates of increase in participation are associated with smaller increases in performance. Second, most of the points are above the horizontal line, suggesting that in most of the districts there have been increases in pass-ing rates. And third, there is a more even distribution of cases above and below the horizontal line for the districts
with increasing compared to decreasing participation rates.
Next, we turn to our regression models to examine the effects of changes in participation rates when controlling for a variety of characteristics such as structural features of districts, initial performance of districts (in 1992), and the baseline participation rate (in 1992). We find that the negative correlation between changes in participation and performance between 1992 and 1996 continues to hold. For instance, according to the WLS regression model, a 10% increase in the change in participation variable is associated with a 9.9% decrease in the change in performance variable11(see Table 5).
We expected to find that the higher the initial partici-pation rate, the more difficult it would be to maintain or
Fig. 2. Changes in performance and participation without the Big 5 districts (1992–96).
Table 5
Predictors of changes in the percentage of test takers who passed Regents’ achievement examinationsa(1992–96) and predictors of changes in the drop-out rate between 1992 and 1996b,c,d
Din percentage of test takers who passed Din percentage of total enrolments that regents achievement examinations dropped out between 1992 and 1996
(OLS) (WLS) (OLS) (WLS)
Urban 1.483 (1.184) 1.253 (0.870) 0.025 (0.265) 0.302 (0.217)
Rural 1.794** (0.782) 1.303 (0.915) 20.053 (0.173) 0.152 (0.222)
ln FV ’92/pupil 20.708 (0.498) 1.021*e(0.561) 20.140 (0.110) 20.323** (0.138) Poverty ’92 219.658*** (2.830) 215.465*** (2.618) 4.072*** (0.600) 3.673*** (0.604) ln size ’92 20.700* (0.422) 20.965** (0.374) 0.226** (0.096) 0.238** (0.093)
DFull value/pupil 1.421E-06 6.88E-06*** 23.306E-07 22.416E-07
(2.186E-06) (2.494E-06) (4.825E-07) (6.071E-07)
DPoverty 217.503*** (4.777) 217.743*** (4.662) 0.335 (1.050) 21.341 (1.131)
DSize 0.001 (0.001) 2.193E-04 (8.934E-04) 23.695E-05 (3.558E- 1.415E-04 (2.200E-04) 04)
Participation ’92 20.156*** (0.028) 20.125*** (0.027) 20.011* (0.006) 20.008 (0.006)
DParticipation 20.309*** (0.023) 20.248*** (0.021) 20.012** (0.005) 20.013** (0.005) Performance ’92 (columns 1, 2) 20.677*** 20.573*** 20.792*** 20.797***
Dropout rates 92 (columns 3, 4) (0.043) (0.048) (0.043) (0.046)
Constant 93.638 61.576 1.665 3.72
Adjusted R2 0.452 0.346 0.381 0.368
Sample size 559 559
Mean value 2.681 20.076
a The dependent variable is based on the average for Course 1 (mathematics), English, Global Studies, and US History. b The sample does not include the Big 5 and the districts for which participation and performance information is not available. c The WLS has been weighted by (8–12) enrolments.
increase performance rates. We reasoned that students with greater educational needs would be entering the testing program as the participation rates reached higher levels and that these students would place increasing demands on the resource base that was available within the school. Our estimates from the regression models12
do not reveal such a tendency. Specifically, we found that the marginal negative effect of the change in partici-pation variable decreases in magnitude with the baseline participation rate. In other words, the relative size of the negative effect depends upon where on the scale the dis-trict began. These results suggest that large increases in participation pose greater challenges for districts at lower starting points. Table 5 (columns 1 and 2) also shows that the districts with low starting points experienced less difficulty in their efforts to maintain and increase pass-ing rates.
3.2.2. Changes in the percentage of students dropping-out
Critics of increased high school graduation require-ments often express concern about the potential for higher requirements to discourage persistence in school and thereby increase drop-out rates. Therefore, we look to see if changes in Regents participation rates between 1992 and 1996 were related to changes in drop-out rates, as calculated by the State Education Department. We realize that changes in Regents participation rates were not directly linked to high school graduation require-ments during the period we studied, but we believe these analyses are relevant since the districts that increased participation were signaling increased expectations for academic performance. We were interested in seeing if these increased expectations translated into significant changes in the rates at which students left high school.
The last two columns of Table 5 report the effects of predictor variables on changes in the percentage of drop out rates. Here we can see that districts with larger increases in participation did not report increases in their drop-out rates over the period. In fact, the regression models suggest that the relationship was actually nega-tive, and this has led us to the conclusion that these data reveal no evidence that increases in participation led to increases in drop-out rates during this period.
12 To see whether the effects of increases in participation were dfferent across districts with different initial participation rates, we included in our basic (additive effects) model an inter-action term between initial participation rate and changes in participation between 1992 and 1996. This term allows the effect of change in participation to differ according to the level of the initial participation. The coefficient on this term was sig-nificant and positive. The results from these regression models are not reported in Table 5 and are available from authors upon request.
Question 3: What have been the changes in resource allocation behavior?
We used the statewide data to examine changes in dis-trict resource allocation behavior at several levels, including overall spending levels and more narrowly focused measures of staffing allocations. We also took advantage of the case study interviews to ask questions about how the ten districts changed their resource allo-cation behavior. We begin with a report on what we learned from the statewide data, and then turn to the results from our case studies.
3.3. Results from the statewide data
3.3.1. Changes in spending per pupil
Efforts by the Regents to raise graduation standards generate concerns about the adequacy of the underlying resource base. Questions are commonly asked about whether the State will be able to afford the costs associa-ted with fulfilling the higher expectations. Answering such questions is difficult, and the difficulty is com-pounded by the absence of clear information about how much it will cost to realize the reformers’ goals.
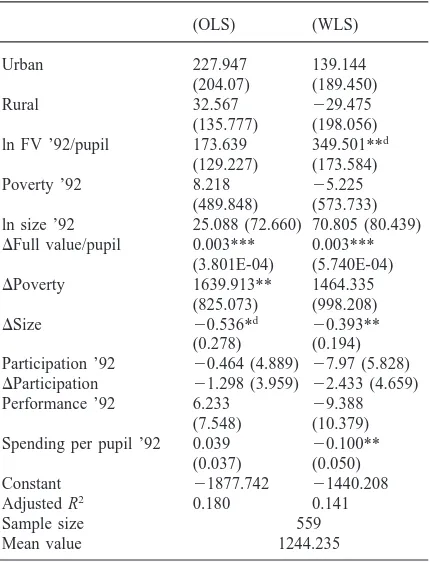
We hope to contribute fruitfully to this debate by examining what happened to spending levels in the dis-tricts that increased their Regents participation rates rela-tive to others. On average, the non-Big 5 city districts in the State increased their spending by $1240 between 1992 and 1996. In order to examine the determinants of the change in spending levels, we turned to our regression models. Table 6 reports what we found and follows the same format that we used for the previous analyses. Changes in full value per pupil (property wealth per pupil) and incidence of poverty were the only variables that significantly explain change in spending between 1992 and 1996. It thus appears that the magni-tude of the change in participation has little to do with changes in spending levels.
Table 6 also examines the impact of the initial partici-pation rate on subsequent spending changes. Our think-ing was that marginal costs ought to be higher in places that are increasing participation rates from already high levels and that this might manifest itself in the form of larger expenditure increases in those districts that are increasing participation from already high levels.13Our
analyses show no evidence of larger expenditure increases in the districts that are moving their
Table 6
Predictors of change in spending levels per pupil between 1992 and 1996a,b,c ln FV ’92/pupil 173.639 349.501**d
(129.227) (173.584)
Poverty ’92 8.218 25.225
(489.848) (573.733) ln size ’92 25.088 (72.660) 70.805 (80.439)
DFull value/pupil 0.003*** 0.003*** (3.801E-04) (5.740E-04)
DPoverty 1639.913** 1464.335
(825.073) (998.208)
DSize 20.536*d 20.393**
(0.278) (0.194) Participation ’92 20.464 (4.889) 27.97 (5.828)
DParticipation 21.298 (3.959) 22.433 (4.659)
Performance ’92 6.233 29.388
(7.548) (10.379) Spending per pupil ’92 0.039 20.100**
(0.037) (0.050)
Constant 21877.742 21440.208
Adjusted R2 0.180 0.141
Sample size 559
Mean value 1244.235
a The sample does not include the Big 5 and the districts for which participation and performance information is not avail-able.
b The WLS has been weighted by (8–12) enrolments. c Regression coefficients with standard errors in (). d *P,0.1, **P,0.05, ***P,0.01.
pation levels into the upper reaches of the range. It is clear that districts, during this period, did not accommo-date the needs of the new students entering their Regents programs by spending additional dollars.
3.3.2. Changes in staffing levels per pupil
We turn now to some alternative measures of staffing. We used BEDS data to construct measures of how the time of professional personnel is allocated across differ-ent areas of the instructional program. In making these calculations, we used a methodology developed pre-viously in conjunction with a study of microlevel resource allocation for education (Monk, Roelke & Brent, 1996). We began with the total FTE count of pro-fessional personnel and then worked our way toward more narrowly drawn categories of use.
On average, the staffing level per 1000 pupils in the State increased by 2.26 professional (i.e. certificated) personnel for the non-Big 5 districts between 1992 and 1996. It is interesting to notice that the increase tended
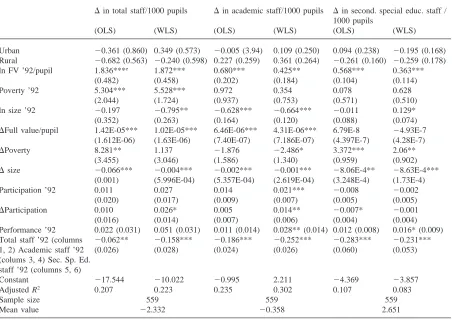
to be larger in the districts that increased their Regents participation rates the most. Table 7 provides the now familiar determinants with the focus on changes in the number of professional staff, academic staff, and second-ary special education staff. According to our WLS regression model, a 10% point increase in the change in Regents participation variable is associated with a 1.23% increase in the change in the total number of professional staff per 1000 pupils. It appears that while districts with large increases in their Regents participation rates have not been spending more dollars, they have been careful to protect the numbers of professional staff that are working with pupils.
As for resource allocation effects in places that started from the higher starting points, we found mixed results. In particular, districts with both low and high starting points did not show decreases in personnel per pupil.14
Perhaps the best conclusion to draw is that large increases in participation, regardless of the starting point, occasioned significant reallocations of resources.
Next, we provide an analysis of resources that are allo-cated into the academic portion of the curriculum between 1992 and 1996. We defined ‘academic’ to include courses in the following subject areas: English, foreign language, mathematics, music and art, physical education, science, and social studies. Overall the staffing levels in the academic area of the curriculum experienced an overall decline of 0.43 personnel per 1000 pupils between 1992 and 1996. Recall that the state experienced an overall increase in professional personnel during the period. It thus appears that academic subject areas’ share of resources within districts experienced a slight decline. Further analysis revealed that growth occurred for special education personnel. In particular, we found that for the State as a whole, the investment in special education increased on average by 2.67 pro-fessional personnel per 1000 pupils between 1992 and 1996.15
While there has been an overall decline in New York State in the average investment of personnel resources in the academic portion of the instructional program between 1992 and 1996, the positive direction of the WLS regression coefficient for the change in partici-pation variable (column 4 in Table 7) suggests that that
14 This was determined by adding a second order (interaction) term between initial participation rate and change in the partici-pation in the model. The coefficient on this term was not statisti-cally different from zero. We have not included this equation in Table 7, however, the results are available from authors upon request.
Table 7
Predictors of changes in professional staffing levelsaper 1000 pupils between 1992 and 1996b,c,d
Din total staff/1000 pupils Din academic staff/1000 pupils Din second. special educ. staff / 1000 pupils
(OLS) (WLS) (OLS) (WLS) (OLS) (WLS)
Urban 20.361 (0.860) 0.349 (0.573) 20.005 (3.94) 0.109 (0.250) 0.094 (0.238) 20.195 (0.168) Rural 20.682 (0.563) 20.240 (0.598) 0.227 (0.259) 0.361 (0.264) 20.261 (0.160) 20.259 (0.178)
ln FV ’92/pupil 1.836***e 1.872*** 0.680*** 0.425** 0.568*** 0.363***
(0.482) (0.458) (0.202) (0.184) (0.104) (0.114)
Poverty ’92 5.304*** 5.528*** 0.972 0.354 0.078 0.628
(2.044) (1.724) (0.937) (0.753) (0.571) (0.510)
ln size ’92 20.197 20.795** 20.628*** 20.664*** 20.011 0.129*
(0.352) (0.263) (0.164) (0.120) (0.088) (0.074)
DFull value/pupil 1.42E-05*** 1.02E-05*** 6.46E-06*** 4.31E-06*** 6.79E-8 24.93E-7 (1.612E-06) (1.63E-06) (7.40E-07) (7.186E-07) (4.397E-7) (4.28E-7)
DPoverty 8.281** 1.137 21.876 22.486* 3.372*** 2.06**
(3.455) (3.046) (1.586) (1.340) (0.959) (0.902)
Dsize 20.066*** 20.004*** 20.002*** 20.001*** 28.06E-4** 28.63E-4*** (0.001) (5.996E-04) (5.357E-04) (2.619E-04) (3.248E-4) (1.73E-4)
Participation ’92 0.011 0.027 0.014 0.021*** 20.008 20.002
(0.020) (0.017) (0.009) (0.007) (0.005) (0.005)
DParticipation 0.010 0.026* 0.005 0.014** 20.007* 20.001
(0.016) (0.014) (0.007) (0.006) (0.004) (0.004)
Performance ’92 0.022 (0.031) 0.051 (0.031) 0.011 (0.014) 0.028** (0.014) 0.012 (0.008) 0.016* (0.009) Total staff ’92 (columns 20.062** 20.158*** 20.186*** 20.252*** 20.283*** 20.231*** 1, 2) Academic staff ’92 (0.026) (0.028) (0.024) (0.026) (0.060) (0.053) (colums 3, 4) Sec. Sp. Ed.
staff ’92 (columns 5, 6)
Constant 217.544 210.022 20.995 2.211 24.369 23.857
Adjusted R2 0.207 0.223 0.235 0.302 0.107 0.083
Sample size 559 559 559
Mean value 22.332 20.358 2.651
a The total staff is a sum of (FTE) instructional and administrative staff/1000 pupils. The instructional staff is an aggregate of elementary, vocational, academic, and special education professional staff. The academic staff is a a sum of secondary staff/1000 pupils in math, English, social studies, science, foreign language, physical education, music, and art.
b The sample does not include the Big 5 and the districts for which participation and performance information is not available. c The WLS has been weighted by (8–12) enrolments.
d Regression coefficients with standard errors in (). e *P,0.1, **P,0.05, ***P,0.01.
districts with the greatest increases in Regents partici-pation are the most inclined to ‘protect’ their investments in academic subject area teaching. Specifically, the WLS model suggests that an increase of 10 percentage points in the change in participation variable was associated with a 4.32% increase in the change in academic staffing ratio.
The effects of the starting points in 1992 are also inter-esting. Specifically, we found that the districts with higher starting points actually increased their invest-ments in the staffing of academic courses. Indeed, the largest increase in staffing can be seen for the highest participation gain districts that started from the highest initial level of participation.
The last two columns of Table 7 reveal a weak nega-tive association between change in participation rate and
change in special education staff. However, it is important to note that this negative relationship is insig-nificant according to the WLS estimation technique.
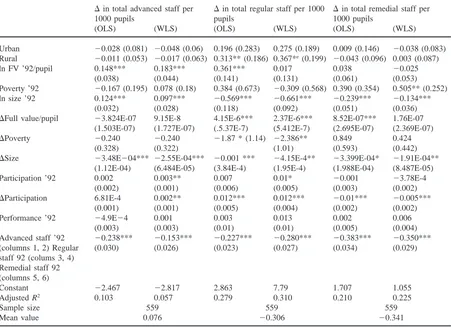
Finally, in Table 8, we refine our analyses and focus on investments of professional staff resources across advanced, ‘regular,’ and remedial course offerings within the academic portion of the curriculum.16
Table 8
Predictors of changes in professional staffing levelsaper 1000 pupils within the academic program between 1992 to 1996b,c,d
Din total advanced staff per Din total regular staff per 1000 Din total remedial staff per
1000 pupils pupils 1000 pupils
(OLS) (WLS) (OLS) (WLS) (OLS) (WLS)
Urban 20.028 (0.081) 20.048 (0.06) 0.196 (0.283) 0.275 (0.189) 0.009 (0.146) 20.038 (0.083) Rural 20.011 (0.053) 20.017 (0.063) 0.313** (0.186) 0.367*e(0.199) 20.043 (0.096) 0.003 (0.087)
ln FV ’92/pupil 0.148*** 0.183*** 0.361*** 0.017 0.038 20.025
(0.038) (0.044) (0.141) (0.131) (0.061) (0.053)
Poverty ’92 20.167 (0.195) 0.078 (0.18) 0.384 (0.673) 20.309 (0.568) 0.390 (0.354) 0.505** (0.252) ln size ’92 0.124*** 0.097*** 20.569*** 20.661*** 20.239*** 20.134***
(0.032) (0.028) (0.118) (0.092) (0.051) (0.036)
DFull value/pupil 23.824E-07 9.15E-8 4.15E-6*** 2.37E-6*** 8.52E-07*** 1.76E-07 (1.503E-07) (1.727E-07) (.5.37E-7) (5.412E-7) (2.695E-07) (2.369E-07)
DPoverty 20.240 20.240 21.87 * (1.14) 22.386** 0.849 0.424
(0.328) (0.322) (1.01) (0.593) (0.442)
DSize 23.48E204*** 22.55E-04*** 20.001 *** 24.15E-4** 23.399E-04* 21.91E-04** (1.12E-04) (6.484E-05) (3.84E-4) (1.95E-4) (1.988E-04) (8.487E-05)
Participation ’92 0.002 0.003** 0.007 0.01* 20.001 23.78E-4
(0.002) (0.001) (0.006) (0.005) (0.003) (0.002)
DParticipation 6.81E-4 0.002** 0.012*** 0.012*** 20.01*** 20.005***
(0.001) (0.001) (0.005) (0.004) (0.002) (0.002)
Performance ’92 24.9E24 0.001 0.003 0.013 0.002 0.006
(0.003) (0.003) (0.01) (0.01) (0.005) (0.004)
Advanced staff ’92 20.238*** 20.153*** 20.227*** 20.280*** 20.383*** 20.350*** (columns 1, 2) Regular (0.030) (0.026) (0.023) (0.027) (0.034) (0.029) staff 92 (colums 3, 4)
Remedial staff 92 (columns 5, 6)
Constant 22.467 22.817 2.863 7.79 1.707 1.055
Adjusted R2 0.103 0.057 0.279 0.310 0.210 0.225
Sample size 559 559 559
Mean value 0.076 20.306 20.341
a The dependent variables include math, science, English, social studies, and foreign language.
b The sample does not include the Big 5 and the districts for which participation and performance information is not available. c The WLS has been weighted by (8–12) enrolments.
d Regression coefficients with standard errors in (). e *P,0.1, **P,0.05, ***P,0.01.
Table 8 reveals some noteworthy relationships between increases in Regents participation rates and the distribution of teacher resources among advanced, reg-ular, and remedial academic course offerings. In parti-cular we found rather striking positive relationships between the magnitude of the increase in participation and the investment of resources in regular versions of academic courses. It is clear that districts with the high-est increases in Regents participation rates have been shifting resources away from remedial courses and toward regular courses. According to our WLS regression results, a 10% increase in the change in Regents participation variable is associated with a 4.63% increase in the change in staffing ratio for regular aca-demic courses and a 1.63% reduction in the change in staffing of remedial academic courses.
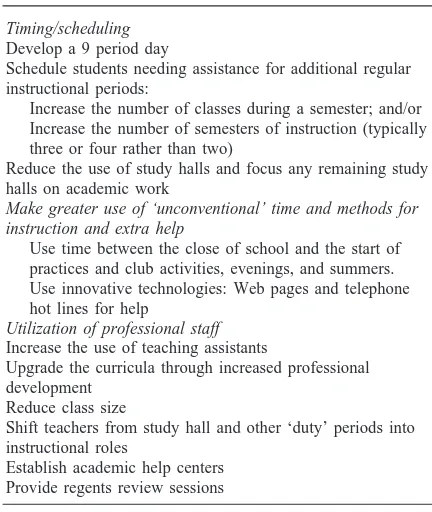
3.4. Results from the case study data
The case studies provide information about how the ten sites changed resource allocation practices as they made efforts to move toward an ‘all-Regents’ program. Table 9 provides a list of the different devices the respondents talked about utilizing. These can be grouped into three broad categories. The first involves efforts to provide additional class time for students needing the extra assistance. These efforts involved doing things like: moving to a nine period day; reducing the use of study halls; making it possible for a student to take a Regents course over more than two semesters; and making it possible for students to attend extra periods of instruction while they were enrolled in Regents classes.
Table 9
Resource allocation responses to ‘all-Regents’ reforms. Find-ings from the ten case studies
Timing/scheduling Develop a 9 period day
Schedule students needing assistance for additional regular instructional periods:
Increase the number of classes during a semester; and/or Increase the number of semesters of instruction (typically three or four rather than two)
Reduce the use of study halls and focus any remaining study halls on academic work
Make greater use of ‘unconventional’ time and methods for instruction and extra help
Use time between the close of school and the start of practices and club activities, evenings, and summers. Use innovative technologies: Web pages and telephone hot lines for help
Utilization of professional staff Increase the use of teaching assistants
Upgrade the curricula through increased professional development
Reduce class size
Shift teachers from study hall and other ‘duty’ periods into instructional roles
Establish academic help centers Provide regents review sessions
instructional opportunities outside of regular school hours. These changes included: providing Regents review sessions in the evenings; establishing a telephone hot line for students with questions about their Regents courses; making use of new technologies like Web pages to provide support for students; and using time between the end of the school day and the start of extra curricular activities for some additional study time.
The third category involved making changes in the
type of instruction that was being offered. Here we heard
reports of districts: making greater use of teaching assist-ants to supplement what classroom teachers were able to provide; taking steps to reduce class size; and increasing the quantity as well as the quality of professional devel-opment for teachers.
We also asked the case study districts about how they paid for all these changes. Our respondents confirmed what we found using the statewide data: It is not the case that these districts made increases in their spending lev-els per pupil. The story coming from these districts is much more a story of making efforts to re-allocate exist-ing resources.
Table 10 provides a list of the strategies the case study respondents talked about as they reflected upon their efforts to pursue reform. In particular respondents in these districts talked about: limiting growth in salaries so that the savings could be used to hire new staff; using
Table 10
Resource allocation strategies. Findings from the ten case stud-ies
Limit the growth of salaries and use the savings to support the hiring of new staff
Use savings realized from the breakage associated with retirements to support teaching assistants and other types of new staff
Rely on the willingness of teachers and other professionals to increase their effort without direct or immediate compensation
Rely on other donated resources (e.g. the time and energy of National Honor Society members and parents)
Take advantage of resources that become available as special education students are included in regular classroom programs
a portion of the ‘breakage’ savings that are realized from retirements to support teaching assistants and smaller class sizes; relying on the willingness of teachers to increase their effort without direct or immediate extra compensation; relying on donated resources such as tutoring help from parents and honor society students; and taking advantage of resources that become available as part of inclusion programs.
4. Discussion
The districts that moved toward an ‘all-Regents’ cur-riculum between 1992 and 1996 have enjoyed some suc-cess. There is a negative relationship between increases in participation and increases in passing rates, but this could be expected given the influx of students who ordi-narily would not have taken these exams. It is note-worthy that despite a more than 10 percentage point increase in test taking, the overall passing rate for the State actually increased by better than 2 percentage points. Moreover, drop-out rates have not increased, and districts seem to be handling the challenge largely through a re-allocation of existing resources.
While these early signs are encouraging, there are at least four reasons to be cautious. First, the districts that moved early toward an ‘all-Regents’ curriculum are not necessarily representative of other districts. These dis-tricts moved voluntarily in this direction. Their experi-ences are instructive but may be a poor guide to what will come when more reluctant districts are forced to increase participation due to regulations.
from moving it between 70 and 80%. The hardest cases will presumably be the last to enter the program, and these students’ experiences could be quite different and less encouraging from what the 1992–96 data reveal.
Third, students during this period could continue to meet graduation requirements even if they performed poorly on the Regents examinations. In the future this option will be curtailed and this could have significant effects on students’ willingness to persist with their stud-ies. And finally, the fact that increases in Regents exam participation were not associated with increased levels of spending should not be interpreted to mean that these gains were costless. We saw evidence of shifts in how resources are used in addition to reports of influxes of new resources that are not captured on district financial statements. The volunteer efforts of parents and teachers who were reported to be working harder for little or no additional compensation both constitute new resources that are entering the system in ways that are difficult to measure precisely. The fact that these new resource flows are difficult to measure should not detract from a recog-nition of their significance.
Nevertheless, our results suggest that the schooling system in New York State enjoys some capacity to
increase pupil performance in response to a widespread desire to raise standards and to provide the resources that will become necessary to maintain the early gains that have been revealed by these data.
References
Education Week (1997a). Mills outlines proposals for stricter standards, September 24.
Education Week (1997b). Quality counts. A report card on the condition of public education in the 50 states, vol XVI. Lankford, H., & Wyckoff, J. (1995). Where has the money
gone? An analysis of school district spending in New York. Educational Evaluation and Policy Analysis, 17 (2), 195– 218.
Miles, K. H. (1995). Freeing resources for improving schools: a case study of teacher allocation in Boston public schools. Educational Evaluation and Policy Analysis, 17 (4), 476– 493.