*Corresponding author. Tel.:#9344-4108; fax: 61-3-9349-4293.
E-mail address:[email protected] (D. Samson)
Manufacturing practices and performance:
Comparisons between Australia and New Zealand
Danny Samson
*
, Steve Ford
Department of Management, University of Melbourne, Parkville VIC 3052, Australia
Received 11 November 1998; accepted 25 March 1999
Abstract
This study compares and contrasts manufacturing practice and performance variables in two neighbouring countries with broadly similar cultures and histories, but only one of the countries has undertaken substantial economic reform. A large, representative sample of manufacturing sites was examined in Australia and New Zealand in order to compare the manufacturing management practices and performance of the better performing sites in each country. New Zealands manufacturers came out ahead on most dimensions, particularly the management of people, leadership and quality management factors, whereas in these factors Australia's lack of labour market#exibility was found to be a barrier to progress. ( 2000 Elsevier Science B.V. All rights reserved.
Keywords: Manufacturing management; Manufacturing performance; Quality management; Australia; New Zealand
1. Introduction: The business context of manufacturing
Manufacturing companies that consider locating plants in particular countries must consider local conditions and norms of manufacturing practices and the impact of these on manufacturing perfor-mance. Hence, it is worthwhile to study the com-parative di!erences between countries in terms of the manufacturing practices and performance that exist in those countries.
Australia and New Zealand's economies have been characterised historically as having strong agricultural industries, with Australia also being
abundant in mineral resources, but with small populations and hence small and somewhat fragile domestic markets. Until a decade ago, manufactur-ing industries in both countries have been tradi-tionally small, domestically focussed and protected by import tari!s and quotas.
Australian and New Zealand's manufacturing industries have comprised substantially branch plants of foreign transnational or multinational companies. For example, unlike the USA, Britain, France, Italy, Germany, Spain, Russia, Japan, Korea and a host of other countries, there are no domestically owned automobile assembly com-panies in Australia or New Zealand, but rather branch plants of Ford, GM, Toyota and Mit-subishi. The competitiveness of these operations is constantly reviewed by their parent companies that make strategic facility location decisions based on cost, quality and overall shareholder wealth consid-erations. In the automobile assembly industry,
Nissan, Volkswagen, Chrysler and others have withdrawn from local manufacturing as part of rationalising their manufacturing, and become importers into these markets. Other key industries are similarly structured, such as electronics in which global corporations such as Alcatel, Erics-son, NEC, and Siemens operate plants that are important to the local economies, but which could from a shareholders'perspective be closed or sub-stantially downsized without much loss of share-holder value. The local branch plants of these companies seem always to be on a knife edge of competitiveness and hence survival.
On the other hand, these industries have spawned solid numbers of smaller companies, such as in automobile componentry, which not only support local assemblers but also in recent times have successfully exported to Asia, Europe and the USA. The reduction of tari!s has caused many of these component manufacturers to adopt modern manufacturing practices, and like everywhere else, success has been mixed, although there have been many notable successes.
For companies that want to operate in these markets, they must decide whether to ship the product in or set up local manufacturing, and a key determinant of this is the local practices and eco-nomic, political and business environment as well as the workplace culture, local practice norms and technological base.
The structure of the local economies of New Zealand and Australia makes it particularly impor-tant that manufacturing practices that will lead to world class levels of competitiveness are adopted. The implications of not achieving and sustaining high levels of competitiveness are clear, namely the loss of the wealth-creating manufacturing sector to countries which do successfully implement these practices and which may have signi"cantly lower cost structures of both labour and overhead.
New Zealand and Australia have proceeded dif-ferently during the past 20 years in terms of the national policy framework that governs the busi-ness environment. During the past 15 years, both the Australasian economies have been restructured although this has proceeded much more pervasive-ly and somewhat faster in New Zealand. Australia has not succeeded in the accomplishedment of the
government sector and microeconomic reform to the extent that New Zealand has, nor has it exten-sively freed up its labour market and competition policy framework. The much stronger level of re-forms in New Zealand followed a deep recession during the late 1980s, during which it substantially transformed itself from an inward focused, bureau-cratic structure to a #exible, entrepreneurial and export oriented business sector. Australia is about "ve times the scale of New Zealand, but has ac-complished only some of the restructuring, and was late in beginning this process. As of 1998, Australia still does not have a Goods and Services Tax, but rather an old fashioned, complex tax system with high personal income tax rates. Tari!protection in Australia on manufactured products is being re-duced from very high levels to levels of about 15%, whereas New Zealand has gone faster and much further on this. In both the countries, many com-panies are facing lower real prices for their manu-factured products and their local manufacturing operations are either signi"cantly improving their competitiveness or closing down. For example, productivity in the automobile industry for both the countries has risen solidly during the past dec-ade but from a relatively low base, and a part of the industry has moved out.
The rest of this paper is organised as follows: we "rst examine the overall business environment of the two countries using comparative data from the IMD Yearbook [1]. Then the manufacturing prac-tices and performance data set is described. The analysis and results are presented of ANOVAS on these two countries using a wide range of practice and performance measures, with the aim of under-standing speci"cally the nature and extent to which New Zealand may be ahead of Australia in its manufacturing sector. Conclusions are then drawn.
2. Macro-level comparisons of New Zealand and Australia
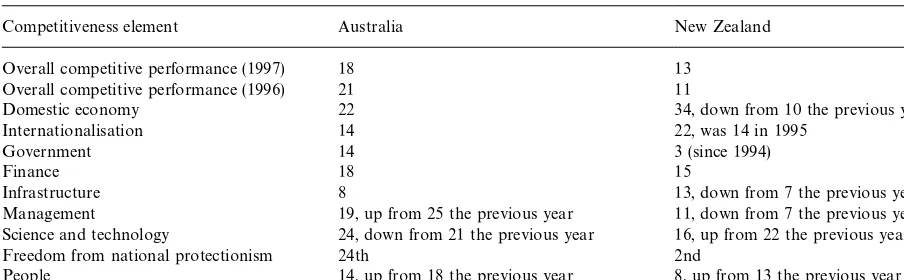
Table 1
Overall competitiveness rankings in Australia and New Zealand!
Competitiveness element Australia New Zealand
Overall competitive performance (1997) 18 13
Overall competitive performance (1996) 21 11
Domestic economy 22 34, down from 10 the previous year
Internationalisation 14 22, was 14 in 1995
Government 14 3 (since 1994)
Finance 18 15
Infrastructure 8 13, down from 7 the previous year
Management 19, up from 25 the previous year 11, down from 7 the previous year
Science and technology 24, down from 21 the previous year 16, up from 22 the previous year
Freedom from national protectionism 24th 2nd
People 14, up from 18 the previous year 8, up from 13 the previous year
!Signi"cant changes are noted in this table from the previous year. Some of these changes re#ect the economic and related changes in#uencing each country.
Source:IMD (1987)
rankings in Table 1 are from 46 industrialised countries including all OECD countries and many newly developed countries such as the Asian nations. Table 1 also shows recent signi"cant changes in rankings.
From Table 1, it can be seen that New Zealand is ranked well ahead of Australia on most of the key criteria. Although the gap narrowed down from 1996 to 1997, Australia was behind in the aggregate measure of&Overall Performance'. While New Zea-land's domestic economic strength slumped in 1997, falling from 10th strongest to 34th, basic factors of competitiveness were generally stronger in New Zealand, particularly management, govern-ment and people factors, as also in technological strength and investment.
In order to develop an understanding and views of the business environment in these countries, one further level of detail is instructive in terms of the drivers of competitiveness. New Zealand ranks relatively poorly (30th) in terms of exchange rate stability. Australia ranked 15th on this measure. The New Zealand economy is generally subject to more#uctuation from outside, such as an economic crisis in Asia, because of the small domestic econ-omy there and the free market approach to economic control. Given these factors, one would expect New Zealand's manufacturers to pursue &best practices' with a relatively high degree of vigour.
New Zealand ranked 3rd on`The image of your country abroad supports the development of busi-nessawhile Australia was 19th. Government subsi-dies to public and private companies in Australia were 1.65% of GDP, ranking well behind New Zealand's 0.26%, which was the fourth lowest of 46 countries.
New Zealand's labour market#exibility led to its ranking of 1st in the dimension `Labour regula-tions are #exible enougha, while Australia ranked 34th from the 46 countries. Similarly, in the area of
`Competition laws do prevent unfair competition in your countrya, New Zealand ranked 3rd, with Australia 13th.
Australia's overall labour productivity was well ahead at US$47,000 against New Zealand's US$37,000, re#ecting the super-e$cient mining in-dustry in Australia and other scale advantages. Does this lead to the adoption of more or less advanced practices in the manufacturing sectors of these countries, particularly given the protectionist policies of a series of Australian governments?
In terms of corporate performance, New Zealand ranked a creditable 7th in the time-to-market dimension: `Launching a new product into the market generally takes less time than in the case of foreign competitorsa, while Australia was ranked 20th on this measure. New Zealand ranked 6th out of 46 countries on both`Price/quality of domestic products is superior to foreign competitorsa and
`Domestic companies emphasize customer satisfac-tion adequatelya. Australia ranked 22nd on price/ quality and 13th on customer orientation. New Zealand's sweeping changes and improvements led it to be ranked 2nd on corporate board practices with Australia 10th. New Zealand was 3rd on entrepreneurship with Australia ranked a relatively lowly 28th. Similarly, New Zealand was ranked 5th while Australia 22nd on the availability of compet-ent senior managers. New Zealand was also ahead (14th) of Australia (23rd) on the international busi-ness experience of managers.
On the industrial relations front, Australia had a large numbers of days lost per 1000 inhabitants, measured at 31, which was nearly three times as high as that in New Zealand. Australia ranked very poorly (36th) on management}employee relations, with New Zealand at a ranking of 8th on this scale. Related to this, New Zealand ranked 10th on worker motivation with Australia a lowly 34th.
In terms of technological strength, New Zealand ranked very highly (3rd) on the legal support for the development and application of technology, with Australia 18th. New Zealands annual average com-pound growth rate in patents granted was 9% with Australia's at negative 0.87%.
In terms of the education investments made in their people, Australia had 15% less relevant age group people receiving full-time education than New Zealand, and New Zealand had a 4th ranking of 58% of 20}24 year old in higher education com-pared with Australia's 12th ranking of 42%.
On a societal values question, `Values of the society support competitiveness (such as hard work tenacity or loyalty)a, New Zealand was ranked as 7th in the world, ahead of countries such as Taiwan and the USA, while Australia ranked a lowly 35th. Given these circumstances of economic revitaliz-ation in New Zealand, with the freeing up of the economy and labour markets and the government
stepping out of the way of the business sector and allowing a renewed spirit of business competitive-ness and entrepreneurship, what manufacturing practice di!erences would be expected between Australia and New Zealand? Despite New Zea-land's smaller scale, or indeed partly because of it, one would generally anticipate a stronger propen-sity there to implement newer practices in areas such as quality management.
One would expect generally that a comparison of the better performing companies in the two coun-tries would "nd New Zealand's manufacturing enterprises ahead on the factors where manufactur-ing managers and their workforces can control or in#uence. It is proposed that New Zealand would be&ahead'on aspects of leadership, customer focus and management of people, which are the three major categories of quality award frameworks most closely associated with superior business perfor-mance [2]. It is proposed that New Zealand's bet-ter companies would have higher adoption rates of modern manufacturing management practices and systems such as JIT and MRP, higher employee morale, faster process change-over times and better quality performance indicators than Australia's.
Hence the null hypothesis is H
0: that Australia and New Zealand do not have di!erent extents of the adoption of modern manufacturing manage-ment practices and systems. The alternative hypoth-esis is H
1: that New Zealand has a greater extent of adoption of modern manufacturing management practices and systems. This hypothesis was tested through decomposing the term &modern manufac-turing management practices and systems'into parts and into individual items within these parts. The parts were planning, manufacturing structure, leadership, people management, customer focus, quality processes, manufacturing scheduling and re-lated performance measures. In addition, compara-tive measures of barriers of performance that hold back companies from progressing were measured.
3. Manufacturing practices and performance comparison: Empirical study
practices and a work culture that governs the outcomes of manufacturing operations. These out-comes are generally measured in terms of cost, productivity, quality,#exibility, reliability, innova-tiveness and other dimensions. This study empiric-ally investigates the relationship between practices and performance in Australia and New Zealand, focusing particularly on aspects of international comparisons. Although the economies are closely tied together and Australia generally has scale advantages, the deeper, earlier restructuring that occurred in New Zealand is expected to have led to the more widespread adoption of modern manufac-turing practices, and further, this should have driven manufacturing operational performance further forward.
This section reports on observed manufacturing practices in Australia and New Zealand, using a large strati"ed sample of manufacturing sites. Manufacturing site managers made assessments of the strength of manufacturing practices and perfor-mance. Some of these were on Likert type scales and others, particularly the performance variables, were on ordered scales. Previous examinations of total quality management practices, quality certi"cation and technology management practices have already shed light on the relationships between various prac-tices and performance in Australia. For example, Terziovski et al. [3] found virtually no signi"cant relationship between quality certi"cation status and quality performance. Challis and Samson [4] found that technological strength was signi"cantly and positively related to manufacturing business perfor-mance for companies that were strong in their qual-ity practices, but not for those that were weak in their quality. Dow et al. [5] found that some com-ponents of the quality awards frameworks were strongly related to quality performance, such as leadership and people management, while others were only weakly or not related to performance.
4. Research methodology
4.1. Sample
An initial strati"ed, random sample was drawn from manufacturing sites in Australia and New
Zealand. Each manufacturing site was registered with the Australian Bureau of Statistics or Statistics New Zealand in 1993, and had at least 20 em-ployees. The strati"cation by industry and size (number of employees) was intended to ensure representativeness.
This initial sample of approximately 4000 sites across Australia and New Zealand were mailed a comprehensive questionnaire (described below) on manufacturing strategy, practice, operating per-formance, and business performance. The Chief Executive O$cer or a member of the Senior Man-agement was requested to complete part of the questionnaire and manufacturing site managers completed the main section. Responses were re-ceived from 1289 sites; 962 from Australia and 327 from New Zealand; yielding response rates of 32% and 38%, respectively. All responses were returned within a ten-week period.
Of these, the top 40% from each nation on a manufacturing practice index were selected for the "nal sample (348 Australian sites, 118 New Zealand sites). The selection process and rationale are outlined in greater detail below.
4.2. Survey instrument
The survey was constructed on the basis of a model of &Best Practice' designed to re#ect the major issues and linkages between manufacturing strategy, practice, operations, and business perfor-mance [6]. This was critical to ensuring content validity of the questionnaire, i.e. the extent to which the empirical measurements re#ects the speci"c do-main of content under consideration. The model provided a descriptive framework for ensuring that the issues pertinent to manufacturing performance were included in the study.
criteria, the Deming Prize Criteria, the European Quality Award, and the Australian Quality Award criteria were also used to guide construction of the questionnaire. In addition, careful reference was made to the literature of manufacturing strategy [7,8] and the Global Manufacturing Research Group survey and methodology [9] and the pion-eering work of Voss [10].
This added further precedence for the items on the"nal survey instrument. The questionnaire was piloted on six sites in Australia, with subsequent minor modi"cations.
The"nal questionnaire contained 246 questions. The response scales varied; many were Likert scales (1}5 point scales), others were rankings, and some were requests for percentage estimates or counts, such as defect rates. The response tags varied con-siderably across the items. These will be identi"ed in relation to the presentation of results in the Results section. Where possible, however, the re-sponse scales were anchored by objective criteria; that is a series of percentage estimates, to increase the objectivity of responses. The variation in re-sponse scales and tags assists in reducing rere-sponse bias and method variance.
4.3. Data analysis
4.3.1. Sample selection and&best practice'index development
To select the top 40% of manufacturing sites from each nation, a &best practice' index was de-veloped by aggregating a number of items related to strategy and practice. A panel of experienced academics and practitioners in manufacturing se-lected these items. They were drawn together hav-ing taken into account the"ndings of other studies of manufacturing and quality management practi-ces in terms of what constitutes the practipracti-ces of leading"rms in a&modern manufacturing'or&best practice'sense [10,11]. Although many other stud-ies have examined quality practices, relatively few have closely examined practices and performance on an international basis such as in the present study in which two closely associated countries are compared for their similarities and di!erences. Black and Porter [11] as well as Saraph et al. [12] used factor analysis to produce construct measures
of the elements of quality management. Ahire et al. [13] did the same, but none of these researchers neither focus on international comparison nor con-sidered organisational performance in either an op-erational or business sense. Adam [14] found some connections between quality practices and perfor-mance, but the results were patchy in terms of strength of connection. Flynn et al. [15] and the further validations made by Black and Porter [11], Saraph [12], and Ahire [13] were useful studies of quality management practices, but generally did not extend more broadly into other areas of manu-facturing management.
The data set has been substantially discussed in [3}5]. These items ranged across the facets of planning, manufacturing structure, factory opera-tions, leadership, people practices, customer focus, quality processes, benchmarking, and technology. Items were not weighted. No attempt was made to demonstrate the unidimensionality of this index because it was regarded as a multifaceted aggregate of performance based upon conceptually agreed (by leading practitioners and researchers) criteria of best practice. The index re#ected the items shown in Tables 2}8.
Not all respondents provided valid responses to the items forming the index; however, 95% of the sample had only two missing scores or less out of the 60 items comprising the index. Therefore, sites with fewer than three missing responses were replaced by the sample means for the item. The remaining sites were excluded from the sample. The details of index construction are shown in the Australian Government Report,`Leading the Way: A Study of Best Manufacturing Practices in Aus-tralia and New Zealanda[6]. Comparisons made in this report between leading and poorly perform-ing Australian and New Zealand's manufacturers certainly showed that leading companies (de"ned in terms of their manufacturing performance) in both places were more likely to use certain practi-ces than the rest of the pack. In this study, we address the research question of whether there is a pattern of di!erences between the respective lead-ing companies in the two countries.
Australian sites and that of New Zealand sites. The choice of the top 40% was an attempt to exclude those sites that were not performing according to the best practices index with the rationale that lagging sites may obscure the di!erential perfor-mance of the manufacturing sectors in both coun-tries. Furthermore, the study of &leaders' is of greater substantive and practical value than study-ing those who are not demonstratstudy-ing leadership. A smaller subset of sites was not chosen to ensure that sample sizes were su$cient to enable generaliz-ation. Greater focus would also defeat the purpose of such an extensive survey sample, returning to the problem, so common in business research, of hav-ing small sample sizes thereby reduchav-ing generaliz-ation. Also, the New Zealand sample was only a third of the size of the Australian sample which bounded the percentage selection criteria; that is, a smaller percentage would result in an uncomfor-tably small sample size for New Zealand which would shrink further since respondents did not answer all the performance items. A larger sample size also ensured a reasonable degree of statistical power.
4.3.2. Statistical analyses
Given that the focus was on di!erences between Australian and New Zealand manufacturing prac-tices and performance, the most appropriate ana-lyses were ANOVAs. This approach will invite criticisms over potential Type 1 error rates with the number of dependent variables under examination; however, the rationale was carefully considered, and its limitations acknowledged. Typically, MANOVAs are recommended to reduce Type 1 errors in this situation, however, MANOVAs examine a fundamentally di!erent question com-pared to ANOVA, that being what weighted combi-nation of variables best di!erentiates between the independent variables. Determining which vari-ables contribute to the di!erences depends on many methodological issues similar to those en-countered with regression (such as order of entry). ANOVA examines the unweighted di!erence of a dependent variable according to the independent variable, and therefore helps pinpoint the nature of the di!erences. Some attempt to aggregate the per-formance factors was made by using exploratory
and con"rmatory factor analysis to determine the performance factors underlying the performance items. The drawback of aggregation, however, is loss of detail.
The sample size disparity between the two na-tional samples also jeopardizes the results of ANOVA; so the experimental method of ANOVA (SPSS 7.0) was used. This approach minimizes the problems with disparate sample sizes.
5. Results
5.1. Strategy and practice
While the central interest was in the di!erences in performance, the di!erences in strategy and prac-tice were also of interest. Therefore, many of the items on these facets were examined. The di$culty encountered with these analyses was the potential for restricted range of results given that the top 40% were chosen on the basis of the aggregate of many of these items. It was reasonable to expect that most sites had high scores on many of these items and with Likert scales the sensitivity to di! er-ences in the upper range may be weakened. In this respect, signi"cant di!erences may be di$cult to "nd. This o!sets the risk of Type 1 error to some extent.
5.1.1. Planning
Table 2 shows the comparisons on the"ve-point scales for strength of practice in planning elements. All variables were scaled by participants on "ve-point scales, from a score of 1 (representing &strongly disagree') to 5 (representing &strongly agree').
As indicated in Table 2, New Zealand was direc-tionally superior on all but one item; however, the only item reaching statistical signi"cance was for the operation of a more structured approach to planning in New Zealand Industry (p(0.05).
Table 2
Means, sample size and ANOVA signi"cance for Planning vari-ables
Variable AUST NZ Fsig
PL1: Mission communicated and supported
3.98 4.11 p"0.154 (348) (118)
PL2: Structured planning process
4.06 4.25 p"0.020 (347) (118)
PL3: Focus on best practice 4.17 4.13 p"0.650 (348) (118)
PL4: Plans include customer, supplier, community
4.23 4.34 p"0.174 (348) (118)
PL5: Clearly articulated strategy
3.84 3.98 p"0.174 (348) (118)
PL6: Operations aligned with mission
4.17 4.22 p"0.511 (348) (118)
PL7: Manufacturing central to success
4.44 4.49 p"0.536 (348) (118)
Table 3
Means, sample size, and ANOVA signi"cance for Manufactur-ing structure
Variable AUST NZ Fsig
MS3A: Size advantage 3.17 3.55 p"0.002 (341) (116)
MS3B: Process technology advantage
3.70 3.62 p"0.443 (344) (117)
MS3C: Skills advantage 3.93 4.02 p"0.326 (348) (117)
MS3D:Materials Management advantage
3.40 3.42 p"0.855 (343) (117)
MS3E: Production planning advantage
3.66 3.61 p"0.545 (345) (117)
MS3F: Quality procedures advantage
3.98 4.07 p"0.304 (345) (117)
MS3G Supplier relations advantage
3.49 3.59 p"0.244 (339) (116)
MS3H: New product development advantage
3.56 3.60 p"0.775 (340) (117)
MS3I: Raw material advantage 3.27 3.07 p"0.069 (342) (115)
MS3J: Distribution advantage 3.67 3.64 p"0.776 (343) (118)
MS3K: Marketing advantage 3.74 3.69 p"0.632 (342) (118)
MS4A:Making too many products
2.71 2.87 p"0.188 (340) (118)
MS4B: Addressing several diverse markets
3.14 3.35 p"0.094 (348) (118)
MS4C: Too many technologies to develop & maintain
2.26 2.23 p"0.765 (348) (118)
MS4D: HRM clearly focused 3.90 3.83 p"0.432 (347) (118)
MS4E: Too many improvement initiatives
2.72 2.58 p"0.247 (346) (118)
5.1.2. Manufacturing structure
In general, the manufacturing structure was found to be similar across the two nations. The only signi"cant issue was a perceived size advant-age by New Zealand (p(0.05). Australia also had
a raw material advantage according to the means; however, the result was not signi"cant (Table 3).
5.1.3. Leadership practices
As re#ected in Table 4, New Zealand sites report being stronger on leadership relative to Australia. Many of the mean di!erences were of sizable mag-nitude; however, only one result was statistically signi"cant. New Zealand sites reported more proactively pursuing continuous improvement (p(0.05).
5.1.4. People management practices
Site managers in New Zealand reported as being superior in inculcating the internal customer con-cept, top-down and bottom-up communications, and have more formal processes for assessing em-ployee satisfaction (See Table 5). This set of
Table 4
Means, sample size, and ANOVA signi"cance of Leadership practices
Variable AUST NZ Fsig
LE1: Management encourages trust & involvement
4.25 4.26 p"0.898 (348) (117)
LE2: Have eliminated barriers 3.75 3.90 p"0.102 (348) (118)
LE3: Use&champions of change' 3.57 3.73 p"0.075 (346) (117)
LE4: Proactively pursue continuous Improvement
4.05 4.28 p"0.004 (348) (118)
LE5: Shop#oor ideas used by management
4.13 4.23 p"0.112 (347) (118)
Table 5
Means, sample size, and ANOVA signi"cance on People man-agement practices
Variable AUST NZ Fsig
PE1: Internal customer concept understood
3.89 4.10 p"0.015 (348) (118)
PE2: Organisation wide training & development
3.43 3.53 p"0.257 (347) (117)
PE3: Top-down & Bottom-up communication
3.76 3.93 p"0.026 (347) (118)
PE4: Employee satisfaction measured
3.32 3.54 p"0.029 (348) (118)
PE5: Occupational health & safety excellent
4.00 4.07 p"0.452 (348) (118)
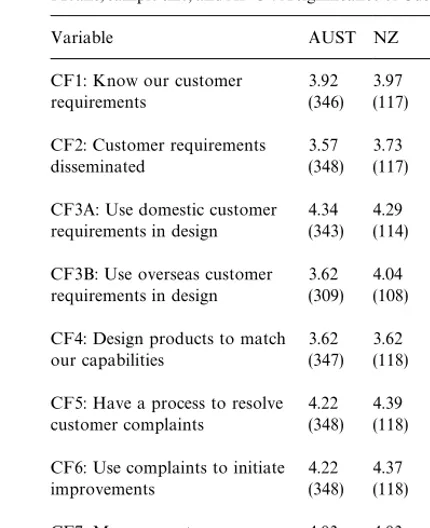
Table 6
Means, sample size, and ANOVA signi"cance of Customer focus
Variable AUST NZ Fsig
CF1: Know our customer requirements
3.92 3.97 p"0.554 (346) (117)
CF2: Customer requirements disseminated
3.57 3.73 p"0.093 (348) (117)
CF3A: Use domestic customer requirements in design
4.34 4.29 p"0.425 (343) (114)
CF3B: Use overseas customer requirements in design
3.62 4.04 p"0.001 (309) (108)
CF4: Design products to match our capabilities
3.62 3.62 p"0.972 (347) (118)
CF5: Have a process to resolve customer complaints
4.22 4.39 p"0.013 (348) (118)
CF6: Use complaints to initiate improvements
4.22 4.37 p"0.046 (348) (118)
CF7: Measure customer satisfaction
4.03 4.03 p"0.994 (347) (118)
environments of the countries. Australia's manufac-turing managers have been more constrained by the lack of #exibility in employee relations and therefore have been less sucessful than their counterparts from New Zealand in trying to seek competitive advantage through their people.
5.1.5. Customer focus
Some di!erences were evidenced in favour of stronger customer focus in New Zealand, mainly
regarding the use of customer complaint programs, and customer involvement in product design, parti-cularly from overseas customers. This is consistent with the export orientation associated with the more open trading environment in New Zealand and the fact that the smaller domestic market there leads the superior companies to focus strongly on export sales (Table 6).
5.1.6. Quality processes
Again there is a strong trend across most of the quality process items in favour of superior progress in New Zealand (Table 7). Signi"cant di!erences were found for mutual cooperation with suppliers to improve each others processes, document their procedures, and drive the responsibility for quality down the chain to employees.
5.1.7. Manufacturing planning and scheduling
Table 7
Means, sample size, and ANOVA signi"cance on Quality pro-cesses
Variable AUST NZ Fsig
QP2: Suppliers assist in product development
3.44 3.56 p"0.256 (345) (118)
QP3: Work with suppliers to improve each others processes
3.48 3.71 p"0.009 (348) (118)
QP4: Suppliers measure quality of materials they send to us
3.69 3.75 p"0.479 (348) (118)
QP5: Have established quality measures
4.23 4.36 p"0.061 (348) (118)
QP6: Have documented procedures
4.17 4.41 p"0.006 (348) (118)
QP8: Quality is each employees responsibility
3.61 3.82 p"0.000 (898) (315)
Table 8
Means, sample size, and ANOVA signi"cance Manufacturing planning/scheduling
Variable AUST NZ Fsig
The following are on a scale of 0}3
TE1Od: TQM used at site 1.63 1.78 p"0.200 (345) (118)
TE1Pd: JIT 1.01 1.42 p"0.000
(342) (118)
TE1Qd: MRP 0.92 1.19 p"0.019
(342) (118)
Table 9
Means, sample size, and statistical signi"cance on Composite performance factors
Variable AUST NZ Fsig
Cost performance 14.39 15.45 p"0.004 (298) (110)
Lead times 14.34 14.43 p"0.810
(213) (82)
Teamwork 7.69 7.98 p"0.491
(218) (105)
Quality 6.64 6.06 p"0.032
(301) (100)
Overall performance 20.75 21.80 p"0.003 (338) (115)
resource planning. Both these results indicated a greater use by manufacturers in New Zealand. Surprisingly, there was no signi"cant di!erence in the use of TQM for the two nations (Table 8). Given the number of di!erences in favour of New Zealand that relate to quality management, it would have been reasonable to expect a greater di!erence in these variables. The result implies that, while Australian manufacturers use TQM to an extent similar to that New Zealand, they may not be implementing their quality programs with the
same success, or pervasiveness. This is consistent with the more advanced human resources elements of practice observed in New Zealand.
5.2. Operational and business performance
The performance measures were analyzed using exploratory factor analysis which revealed "ve factors: quality, cost performance, lead-times, team-work, and overall business performance. Com-posite scores were generated to re#ect these factor scores. The results on these factors are presented in Table 9.
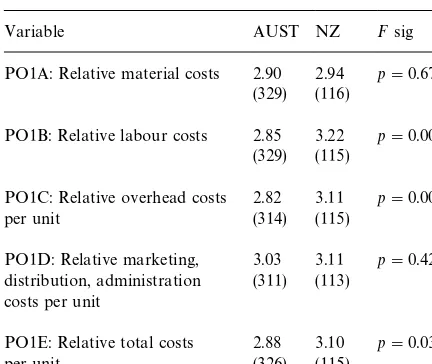
Table 10
Means, sample size, and signi"cance for cost performance vari-ables
Variable AUST NZ Fsig
PO1A: Relative material costs 2.90 2.94 p"0.676 (329) (116)
PO1B: Relative labour costs 2.85 3.22 p"0.000 (329) (115)
PO1C: Relative overhead costs per unit
2.82 3.11 p"0.005 (314) (115)
PO1D: Relative marketing, distribution, administration costs per unit
3.03 3.11 p"0.421 (311) (113)
PO1E: Relative total costs per unit
2.88 3.10 p"0.032 (326) (115)
Table 11
Means, sample size, and ANOVA signi"cance for quality vari-ables
Variable AUST NZ Fsig
PO8A: Defect rates 2.83 2.54 p"0.033 (328) (113)
PO8B: Warranty costs 1.73 1.58 p"0.126 (320) (106)
PO8C: Cost of quality 2.06 1.99 p"0.545 (325) (110)
5.2.1. Cost performance
Examination of the cost-related variables re-vealed that some di!erences exists in the cost struc-tures of sites in the two nations. Speci"cally, New Zealand's leading manufacturers claim superior cost performances on labour costs (a high score indicates lower costs), overhead costs, and thus overall total cost relative to industry competitors (Table 10).
These results are again consistent with the higher degree of labour market deregulation in New Zea-land. One would expect this condition to lead to more variance in labour costs and hence more scope for comparative advantage in leading com-panies, than in a more constrained system, such as Australia.
5.2.2. Quality performance
Again, New Zealand sites report a trend towards superior quality performance (a low score indicates superior quality). However, only defect rates was statistically signi"cant, although warranty cost was also close to signi"cance (Table 11).
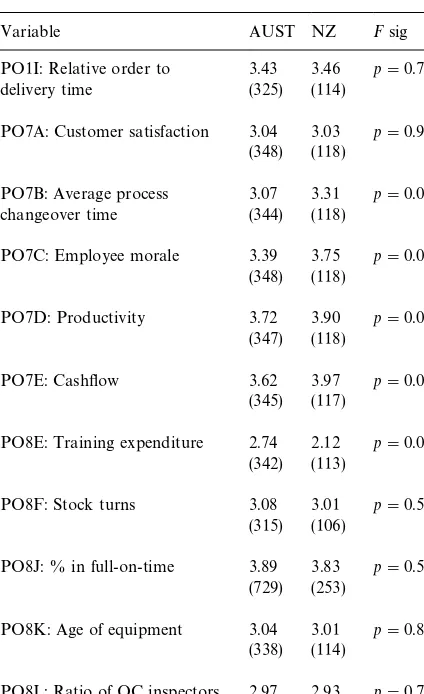
5.2.3. Overall business performance
Apart from increased expenditure on training employees, Australia lagged behind New Zealand in reported process changeover time, productivity,
cash#ow, and employee morale. These outcomes indicate very di!erent facets of business or manu-facturing performance, suggesting the generality of the New Zealand manufacturing industries' su-perior performance overall. The higher reported training expenditure in Australia may well be be-cause the government there mandated minimum training expenditure rates during the mid-1990s (Table 12).
5.2.4. Barriers to performance
Table 13 presents the results concerning the ex-tent of the barriers on performance as identi"ed by each nation. While these issues are generally be-yond the control of manufacturing sites, they do indicate the contextual issues that a!ect manufac-turing plants in each country. They also o!er com-peting explanations for the variable performance between the two nations. The major barriers for New Zealand relative to Australia were: exchange rates and the availability of skilled people. In con-trast, the major barriers for Australia were national infrastructure costs, government policies, and ex-ternal in#uences on employee relations (most prob-ably unions).
6. Summary
In summary, New Zealand appears to be signi" -cantly ahead of Australia on many facets of manu-facturing practice, and performance. The null hypothesis H
Table 12
Means, sample size, and signi"cance for Overall business perfor-mance variables
Variable AUST NZ Fsig
PO1I: Relative order to delivery time
3.43 3.46 p"0.738 (325) (114)
PO7A: Customer satisfaction 3.04 3.03 p"0.967 (348) (118)
PO7B: Average process changeover time
3.07 3.31 p"0.025 (344) (118)
PO7C: Employee morale 3.39 3.75 p"0.000 (348) (118)
PO7D: Productivity 3.72 3.90 p"0.034 (347) (118)
PO7E: Cash#ow 3.62 3.97 p"0.000 (345) (117)
PO8E: Training expenditure 2.74 2.12 p"0.000 (342) (113)
PO8F: Stock turns 3.08 3.01 p"0.532 (315) (106)
PO8J: % in full-on-time 3.89 3.83 p"0.599 (729) (253)
PO8K: Age of equipment 3.04 3.01 p"0.834 (338) (114)
PO8L: Ratio of QC inspectors to operators
2.97 2.93 p"0.737 (338) (114)
Table 13
Means, sample size, and signi"cance for the barriers to perfor-mance
Variable AUST NZ Fsig
PO6A: Exchange rates 3.28 3.69 p"0.001 (343) (117)
PO6B: Ability to utilise leading edge technology
3.08 3.17 p"0.418 (343) (116)
PO6C: Availability of skilled people
3.03 3.32 p"0.022 (345) (117)
PO6D: Availability of"nance for capital equipment
2.95 3.01 p"0.653 (346) (117)
PO6E: Availability of"nance for operations
2.80 2.85 p"0.682 (344) (117)
PO6F: Ability to implement change by senior management
2.76 2.85 p"0.473 (347) (116)
PO6G: Ability to implement change by middle management
3.01 3.11 p"0.394 (344) (117)
PO6H: Ability of production operators to implement change
3.05 3.03 p"0.921 (347) (116)
PO6I: External in#uences on employee relations
3.03 2.78 p"0.030 (346) (115)
PO6J: Parent company restrictions
2.60 2.53 p"0.570 (342) (111)
PO6K: Our company's knowledge of best practice
2.72 2.80 p"0.427 (347) (117)
PO6L: Access to international markets
3.06 3.10 p"0.750 (247) (86)
PO6M: National infrastructure costs
3.56 3.22 p"0.001 (347) (117)
PO6N: Government policies 3.48 3.06 p"0.005 (201) (84)
to quality management practices and quality per-formance. Dow et al. [5] and Terziovski et al. [3] have already demonstrated this relationship be-tween quality practices and quality performance, and this evidence from comparisons of Australia and New Zealand supports the fact that this exists in an international cross-sectional context. The evidence "rmly supports the connection between the macro-environment (by which we mean busi-ness, government and economic factors) and the manufacturing practices that local companies ad-opt. Despite (or perhaps due to) the small economy and domestic market as well as the lack of raw materials in New Zealand, their manufacturing sec-tor has gone ahead of the Australian counterpart in
References
[1] World Competitiveness Report, 1997 Yearbook, IMD, 1997.
[2] D. Samson, M. Terziovski, The relationship between total quality management and operational performance, Jour-nal of Operations Management, to appear.
[3] M. Terziovski, D. Samson, D. Dow, The business value of quality management systems certi"cation: Evidence from Australia and New Zealand, Journal of Operations Man-agement 15 (1997) 1}18.
[4] D. Challis, D. Samson, A strategic framework for technical function management in manufacturing, Journal of Operations Management 14 (2) (1996).
[5] D. Dow, D. Samson, S. Ford, Exploding the myth: Do all quality management practices contribute to superior qual-ity performance? Production and Operations Manage-ment 8 (1) (1999) 1}27.
[6] AMC, Leading the Way: A Study of Best Manufacturing Practices in Australia and New Zealand, Australian Manufacturing Council, November 1994.
[7] R.H. Hayes, S.C. Wheelwright, Restoring our Competitive Edge: Competing through Manufacturing, Wiley, New York, 1984.
[8] T.J. Hill, Manufacturing Strategy, McMillan, London, 1985.
[9] B.H. Rho, D.C. Whybark, Comparing manufacturing and control practices in Europe and Korea, Interna-tional Journal of Production Research 28 (12) (1990) 2393}2404.
[10] C. Voss, Made in Britain, London Business School, 1993. [11] S.A. Black, L.J. Porter, Identi"cation of the critical factors
of TQM, Decision Sciences 27 (1) (1996) 1}21.
[12] J.V. Saraph, P.G. Benson, R.G. Schroeder, An instrument for measuring the critical factors of quality management, Decision Sciences 20 (1989) 810}829.
[13] S.L. Ahire, D.Y. Goihar, M.A. Waller, Development and validation of TQM implementation constructs, Decision Sciences 27 (1) (1996) 23}56.
[14] E.E. Adam Jr., Alternative quality improvement practices and organisation performance, Journal of Operations Management 12 (1994) 27}44.