ANALYSIS
Activities implemented jointly: another look at the facts
Reimund Schwarze *
,1Center for En6ironmental Science and Policy,Stanford Uni6ersity,Stanford CA94305,USA
Received 28 December 1998; accepted 20 July 1999
Abstract
The first Conference of the Parties to the United Nations Framework Convention on Climate Change in Berlin established a pilot phase of so-called Activities Implemented Jointly (AIJ). This pilot phase started in 1995 and was to end in 1999. It was prolonged at the fourth Conference of the Parties in Buenos Aires (1998) for a yet undetermined period after 2000. This paper is an empirical study of AIJ experience in the first five years (1995 – 1999) based on 96 AIJ from the UNFCCC’s web site as of April 30, 1999, and a separate study on seven AIJ projects of Japan. The main results of this study are: (1) AIJ investment shows a pattern of regional-specificity with rather divergent regional investment portfolios in the United States, Japan and Europe. This pattern can be traced back to differences in the national AIJ programs of investors and hosts, on the one hand, and to specific ways of minimizing transaction cost on the other, e.g. by attaching AIJ to established institutional links of development co-operation or by ‘trading in the neighbourhood’; and (2) AIJs are overwhelmingly no regret-measures with almost zero or negative cost. Transaction costs of reporting have been minimized by applying simple and straightforward methods of baseline determination. The exception to this is the verification procedure where expensive external verification prevails. © 2000 Elsevier Science B.V. All rights reserved.
Keywords:International policy on climate change; Joint implementation; Activities implemented jointly; Empirical analysis www.elsevier.com/locate/ecolecon
1. Introduction
The first Conference of the Parties (CoP1) to the United Nations Framework Convention on
Climate Change (UNFCCC) in Berlin (1995) es-tablished a program of so-called Activities Imple-mented Jointly (AIJ). Under this program, greenhouse gas reduction and sequestration projects can be carried out through partnerships between an investor from a developed country and a host from a developing country or a coun-try with an economy in transition.2 The purpose
of this program is to enhance the transfer of
* Tel.: +1-650-723-2300.
1I am indebted to Achim Czerny for his excellent research assistance and to Rieko Matsuura for providing me with comprehensive information on the AIJ of Japan. Helpful comments and suggestions on an earlier version of this paper came from John-O Niles and Peter Zapfel as well as two anonymous referees of this journal. Financial support for this study from the Thyssen-Foundation is gratefully acknowl-edged.
2Countries with economies in transition (EIT) are central and eastern European countries and states of the former Soviet Union that are in a transition to a market economy.
technology and know-how on global warming protection from developed to developing coun-tries and to gather experience on the opportunities and obstacles for the joint implementation of policies and measures to avert climate change. The AIJ experience will help to elaborate the design of project-based mechanisms outlined in Article 6 and Article 12 of the Kyoto Protocol (KP), which are respectively known as Joint Im-plementation (JI) and the Clean Development Mechanism (CDM).
The Subsidiary Body for Scientific and Techno-logical Advice (SBSTA) of the UNFCCC was asked to review the experience of AIJ and, with the assistance of the UNFCCC Climate Secretar-iat in Bonn, to prepare a synthesis report on AIJ to the Conference of the Parties on a regular basis. At the time of writing of this article the second report has been published (UNFCCC, 1998). This report as well as the first report (UN-FCCC, 1997a) takes a descriptive and predomi-nantly institutional look at the facts. It addresses mainly questions of reporting, assessment meth-ods and procedures. This led me to do an inde-pendent study, which takes a more analytical approach. In this study, I identify some additional information, e.g. on GHG mitigation cost. And I correct some false general beliefs on AIJ, e.g. the belief in a lack of private participation. As an-other new result, I discover a pattern of regional-specific investment portfolios, which differ significantly between the US, Japan and European countries. These investment patterns can be traced back to differences in the national programs on AIJ of investor and host countries (UNFCCC, 1997b). These national programs set out the ob-jectives and criteria for government approval of AIJ projects.3 Another influence comes from the
established national links of trade and general development aid. Other issues discussed in this paper are the baseline issue and transaction cost.
2. The data
This study is based on AIJ projects that have been reported to the UNFCCC by designated national authorities (DNA) and presented by the UNFCCC on its web-site as of April 30, 1999.4
The source for the AIJ of Japan is a detailed report of the New Energy and Industrial Technol-ogy Development Organization (NEDO) on seven mutually agreed AIJ projects (NEDO, 1998). Combined, this study consists of 103 activity re-ports on 143 projects5 from 36 countries (27 host
and 9 investor countries) with a total of approxi-mately 170 million tons (Mt) of emissions reduced at a total cost of approximately US$ 640 million.6
Except for the Japanese projects, the data were taken as found in the standardized reporting for-mats (URF or USIJI-URD). No adjustments were made to this data even though there are numerous deficits in the current DNA reports, e.g. great differences in the quality and the meth-ods of reporting (see Ellis, 1999). The ‘take it as you find it’ approach of this study can be justified on two grounds. Firstly, any adjustments of the original data would have implied arbitrary report-ing requirements and methods beyond the ones established by the Berlin Mandate. Secondly, the results presented in this paper proved to be robust in two sampling experiments, one in which I omitted 25 projects in the planning stage (see below footnote 7), and another based on a smaller sample of 96 projects (Schwarze, 1998).
4www.unfccc.de/fccc/ccinfo/aij act and www.unfccc.de/fccc/ ccinfo/aijact98.
5Several UNFCCC-reports are on more than one project, e.g. the AIJ between Norway and Poland (norpolOla, see App. 1) is on 21 projects of coal-to-gas boiler conversion. To make this information compatible with other more disaggregated reports, e.g. on boiler conversion between Sweden and Estonia (estsweOl-estswel6, see App. 1), I have changed the UNFCCC-definition of projects (‘activities’) in this study to ‘projects as declared in the DNA-reports’. Resulting from this new defini-tion of projects, my set of data contains 143 projects as compared to 96 projects considered by the UNFCCC.
6A full list of the projects considered and their general characteristics is given in Appendix 1.
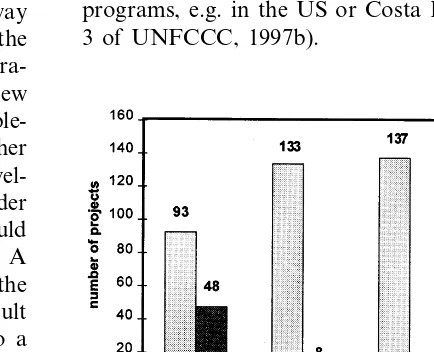
Fig. 1. Activity starting date.
the UNFCCC in Buenos Aires opened the door to prolong the pilot phase beyond 1999 for a yet undetermined period (Decision 6/CP.4). Given this schedule, one might expect that AIJ would be mainly pursued during the five-year period 1995 – 1999. As Fig. 1 reveals, a great number of projects do not conform to this expectation. Looking at the project starting date, we find that 29 projects were initiated before the program was introduced in 1995, and 16 projects have not been imple-mented by now which implies that they will start on a date later than 1999. Only 98 projects (or 69%) were taken up during the AIJ period of the Berlin Mandate.7
This picture becomes even more pronounced if we look at the project ending date. Here we find that virtually all projects have a lifetime exceeding 1999. In fact, the average duration of projects is 31 years. Thus, the true effects of AIJ are largely realized outside the stipulated AIJ program pe-riod. This evidence suggests that AIJ projects have been undertaken to a great extent indepen-dent of the AIJ program and largely with the expectation that the pilot phase would be pro-longed beyond 2000 or transferred into a program with crediting.8
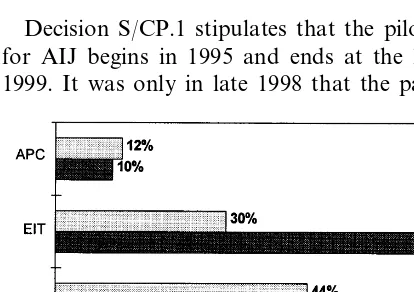
3.2. Regional distribution of AIJ
The 1998-report on AIJ by the UNFCCC (UN-FCCC, 1998) points out that ‘the geographical distribution of activities... shows a marked imbal-ance’. This analysis confirms this view (see Fig. 2):
3. The results
Based on the analysis of these data I have been able to identify six major issues on AIJ:
the timing of AIJ,
the regional distribution of AIJ, the distribution of activity types, the private sector participation in AIJ, the baseline issue,
the cost of AIJ.
The results will be presented in this order.
3.1. The timing of AIJ
Decision S/CP.1 stipulates that the pilot phase for AIJ begins in 1995 and ends at the latest in 1999. It was only in late 1998 that the parties to
Fig. 2. Regional distribution.
7There is some confusion in the current DNA reports with respect to the meaning of the activity starting date. Several projects (25) were reported with a starting date but actually have not started in a technical sense, e.g. because lack of funding. According to the UNFCCC classification they are ‘mutually agreed’ but not ‘in progress’. Omitting these projects would, however, not change the general results presented in this study.
Out of 139 projects9, 95 projects (68%) were
lo-cated in Economies in Transition. Only 32% of the projects were located elsewhere, mainly in Latin America (19%). Considering the amount of GHG reduced, however, a more balanced picture emerges. The greatest effect of GHG reduction will be achieved in Latin American countries with 44% of all GHG reduced or sequestered located there as compared to only 30% in Economies in Transition.
This contradicting evidence on the regional dis-tribution of AIJ can be traced back to a general inhomogeneity of AIJ projects: the average amount of GHG reduced by project is five times larger in Latin America than in Central and East-ern Europe.10 This is due to the fact that some
European investor countries (e.g. Sweden) with a large number of investments in EITs (e.g. 50 projects) have stipulated in their national pro-grams that ALT shall be ‘small to allow for quick implementation’ (www.unfccc.de/fccc/ccinfo/ aijprog/aij –pswe.htm).11
Looking at the share of projects in Fig. 2, we can also confirm the view of the UNFCCC that ‘the bulk of current AIJ is between Annex I Parties’’12
(UNFCCC, 1997a, 4), reaffirmed in UNFCCC (1998, 4). Since only KIT hosts and all investor countries are in Annex I, we can easily figure out that 68% of all projects (i.e. the KIT share) has been between Annex I-Parties. Only 32% (the remaining share) has taken place be-tween Annex I- and the Non-Annex I-Countries
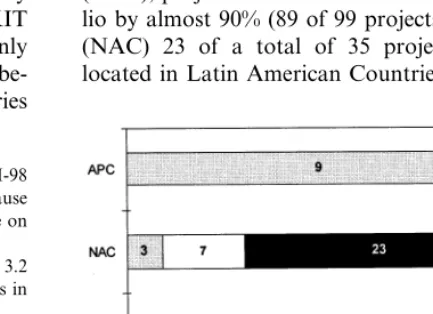
of Latin America, Africa and the Asia Pacific region. There is one plausible explanation for this pattern of cooperation. Most projects were ini-tiated before the Kyoto-Conference in 1997 which implies that they were done under the reasonable expectation that AIJ projects would (if at all) be incorporated after 2000 into a program of joint implementation between Annex I-Countries only. Before the Clean Development Mechanism (CDM) was introduced in Kyoto it was rather unsure whether AIJ with Non-Annex I-Countries could ever be used to support Annex I-Countries fulfill their emission reduction commitments. Thus it was much more attractive for Annex I-Coun-tries to invest in the Annex I-CounI-Coun-tries of Central and Eastern Europe rather than in Non-Annex I-Countries elsewhere in the world. However, this is only one explanation for the observed pattern of co-operation in AIJ. Looking at the regional investment portfolios in Fig. 3, another reason emerges, which I will call the ‘neighbourhood trading’ hypothesis.
Reviewing the investment portfolio of Asia-Pacific investor countries (APC), i.e. Australia and Japan, we find that all projects take place within neighbouring Asian-Pacific economies, pre-dominantly in China. In the case of Europe (EUR), projects in EITs dominate the AIJ portfo-lio by almost 90% (89 of 99 projects). In the U.S. (NAC) 23 of a total of 35 projects (66%) are located in Latin American Countries (LAC). This
9Four projects in EITs (criusa07a. Ituswe09-98. Ivandl0I-98 and estswe17-98) were omitted from this comparison because the emission reductions of these projects were not available on the UNFCCC’s website as of April 30, 1999.
10The respective values of the average project size are 3.2 Mt CO2for Latin America and 0.6 Mt CO2 for Economies in Transition.
11A detailed list of national AIJ programs can be found in UNFCCC (1997b). An example of a national AIJ program is the United States Initiative on Joint Implementation (U.S.I.J.I., 1998).
12The term Annex I-Countries refers to Annex I of the United Nations Framework Convention on Climate Change. This list of countries includes the 24 original OECD member countries and 11 former states of the Soviet bloc as well as the European Community as a regional economic integration or-ganization.
Fig. 4. Regional specific investment portfolios (amount in $ mill. and share of investor funding).
Americas,14
and the Baltic Sea Region Initiative of the Nordic States and the EU.15 In the case of
Australia and Japan, the focus on neighbouring Asia-Pacific economies is a stated, trade and devel-opment policy-related objective of the national AIJ programs.16
This result becomes even more pronounced if we look at the flows of AIJ investment in Fig. 4. Based on a study of 117 projects with a declared compo-sition of funding, we find that US$ 77 million (89%) of the total European AIJ funding went to neigh-bouring EITs. US$ 47 million of a total US funding of US$ 49 million went to LACs. Stemming from their regional focus on the Asia-Pacific region, the AIJ investment of Japan and Australia (US$ 27 million) remained entirely within that region.
3.3. Distribution of acti6ity types
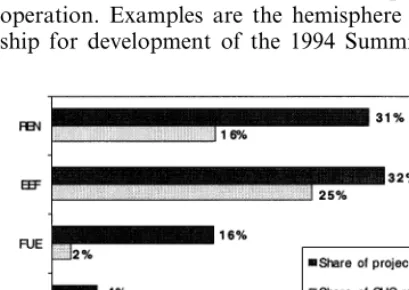
According to the International Panel on Climate Change (IPCC), climate change mitigation ac-tivities can be classified as related to energy efficiency (EEF), renewables (REN), fuel switch-ing (FUE), fugitive gas capture (FGC), land use change and forestry (LIUCF),17 agriculture,
in-pattern of Asian, European and intra-American cooperation (‘neighbourhood trading’) is significant according to contingency analysis indi-cators.13
It can be explained by reference to the established institutional links of development co-operation. Examples are the hemisphere partner-ship for development of the 1994 Summit of the
Fig. 5. Activity type.
14See US Department of State, Summit of the Americas Action Plan (1995).
15See Baltic Sea States Summit (1996), Presidency Declara-tion, Visby 3 – 4 May 1996, and Commission of the European Communities, Final Communication from the Commission Baltic Sea Region Initiative. Brussels, 10.04.1996, SEC (96) 608 (Commission of the European Communities, 1996).
16The Australian International Greenhouse Partnerships Office (1997) states as one main objective of AIJ ‘to enhance Australian trade and investment links in environmental tech-nology and services..., particularly in the Asia-Pacific region’ (reaffirmed in an interview with Hugh Withycombe, project officer of the AIJ Australia offiice, in JIQ 3(1), 1997 (Withy-combe, 1997). The Government of Japan is cited in JIQ 2(2), 1996, to believe ‘that the role of Japan is to share technologies with other countries, especially with Asian economies’ (Mat-suo, 1996). Recentlv the Government of Japan initiated an effort to co-operate with Russia to broaden its regional scope of AIJ (Matsuo, 1998). but this effort has not yet led to actual projects between these countries.
17The IPCC actually distinguishes between three different LUCF activities. i.e. afforestation, reforestation and deforesta-tion. Experience in the pilot phase, however, shows that this systematically important distinction is not very useful to clas-sify AIJ projects in this field, since most of these projects combine measures to protect existing forest and activities to reforest non-forest lands (e.g. abandoned pasture). Following this. U.S.I.J.I. has classified its latest projects in this sector as ‘LUCF’ (see e.g. criusaO9-9S).
13Throughout this study we applied contingency analysis to test the existence (Pearson’s x2), the strength (Contingency Coefficient) and the direction (Goodman and Kruskal’st) of
Fig. 6. Average GHG reduction by activity types (Mt CO2).
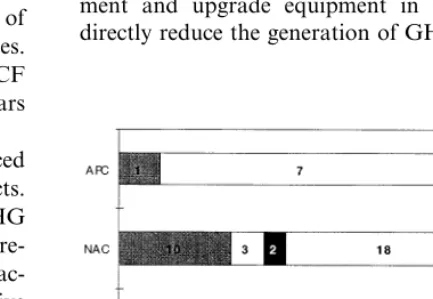
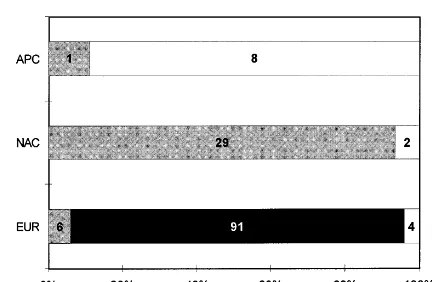
It is of some interest to look at the regional distribution of investment on different activities (Fig. 7). Europe, Japan and Australia focus on technological mitigation activities (EEF, FUE, FGC, and REN) while the United States displays a much greater involvement in forestry projects (LUCF). These regional specific investment port-folios can be traced back to the provisions from national AIJ programs. Several European na-tional AIJ programs exhibit preferences for fuel switching and energy efficiency related projects (e.g. in Germany and Switzerland) or for quickly implementable small investments (in Sweden), whereas in the United States no particular focus on project type and size can be found in the national AIJ program. In the case of Japan and Australia again, we find a consistent priority of ‘sharing of environmental technology and ser-vices’ in both national AIJ programs (see above footnote 16).
Another influence on the observed distribution of activity types stems from national AIJ priori-ties of host countries. For example, the govern-ment of Poland, who is host of 21 projects of coal-to-gas conversion and four projects of energy efficiency enhancement, selected this portfolio with the aim ‘to achieve technological develop-ment and upgrade equipdevelop-ment in activities that directly reduce the generation of GHG in produc-dustrial processes, solvents, waste disposal and
bunker fuels. Only the first five indicated activity types have been implemented in AIJ (see Fig. 5).18
The majority of projects (83%) have been techni-cal by nature in energy-related activities (EEF, FU1S, REN or FGC). Only 17% of the projects have been related to LUCF activities (forest preservation, reforestation and afforestation). Looking at the share of GHG reduced or se-questered, a rather different picture emerges. LUCF-projects account for more than 38% of the GHG reductions as compared to a remainder of 62% for all other emission mitigation activities. This result is largely due to the fact that LUCF projects exhibit a much longer lifetime (39 years on average) than average AIJs (21 years).
Again, this contradicting evidence can be traced back to the great inhomogeneity of the projects. As can be seen in Fig. 6, the average GHG reduction per project is much greater in LUCF-re-lated activities compared to fossil fuel-reLUCF-re-lated ac-tivities. A very notable exception to this is fugitive gas capture, which shows the largest GHG reduc-tion per project.
Fig. 7. Regional specific activity portfolios (number and share of projects).
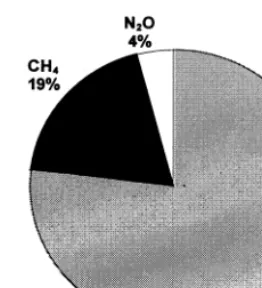
Fig. 8. Share of GHG reduced by gas type.
19% to CH4. The share of these gases is still
remarkably high because it results from very few projects. The share of CH4 comes from only six
projects of fugitive gas capture with an average GHG reduction per project of 5.5 Mt CO2
equiv-alents (see Fig. 5). The N2O reductions are
virtu-ally all from one Integrated Agricultural Demand Side Management project in India (indnorO1-98). The higher global warming potentials20 of these
gases largely contribute to the high efficiency of projects in this field on the per project basis (Fig. 6) and on the per dollar basis (Fig. 12).
3.4. Pri6ate sector participation in AIJ
AIJ is conceptually a program of bilateral co-operation between countries. Private sector in-volvement is not a formal part of the program. It has been delegated to the Parties to the Conven-tion to induce private sector participaConven-tion and funding, e.g. by crediting emission reductions from AIJ against national CO2 tax duties or
voluntary commitments by national industrial sec-tors. However, such incentives are not existing in any national program. On the contrary, most countries have explicitly foreclosed the opportu-tion of goods and services’. On the other hand,
the government of Costa Rica promoted projects in the forestry sector ‘to claim the cost of environ-mental services executed by private forest owners at international level’. Costa Rica hosts 15 AIJ projects, 11 of which are LUCF-related, i.e. in sustainable forestry, reforestation and forest preservation.19
There is a suggestive link between the observed regional pattern of AIJ (‘neighbourhood trading’) and the sectoral pattern of AIJ. Private US in-vestors, looking for AIJ in their neighbourhood, find hosts who favor forestry projects, which confirm to the U.S.I.J.I-criteria of project diver-sity and cost-effectiveness. Public or publicly cofi-nanced private investors in Europe and Japan find hosts in their neighbourhood (EITs and China), who share the goals of energy efficiency and fuel substitution. Of course, the actual reasoning for each AIJ project may have been quite different but this is the typical reasoning that the aggregate data suggest.
Another general result is the dominance of CO2-related projects (see Fig. 8): 77% of all GHG
reductions from AIJ are occurring as CO2
reduc-tions. Of the remainder 4% is going to N2O and
Fig. 9. Private sector funding share.
20The global warming potential (GWP) measures the CO2 equivalent contribution to global warming of other greenhouse gases e.g. CH4 and N2O. It is established by reference to the IPCC model on global warming (Houghton et al., 1996, Tab. 3), and is conventionally based on a 100-year time horizon. The pertinent GWPs of CH4 and N2O are 24.5 and 310, respectively.
19The mentioned host country priorities in thc AIJ pilot-phase are drawn from www.unfccc de/fccc/ccinfo/aij –np htm
(Poland) and www unfccc de/fccc/ccinfo/aij –pcri.htm (Costa
Fig. 10. Regional specific funding portfolios (number and share of projects).
can be related to the fact that the US Initiative on Joint Implementation explicitly encourages pri-vately initiated projects (see U.S.I.J.I., 1998).
We may halt at this point to establish an in-terim result: AIJ investment exhibits regional spe-cificity. It greatly differs between the US, Asian and European investor countries. US projects are typically (i) large in cost and effects; (ii) not particularly focused on technologies; and (iii) pri-vately initiated. They are overwhelmingly imple-mented in Latin American countries. European projects, on the other hand, are typically small, publicly funded and related to energy efficiency and fuel substitution. They are predominantly located in EITs. Asian projects are somewhat similar to European projects, i.e. they are small and publicly co-financed21, however, they are
ex-clusively focused on the AsiaPacific region.
3.5. The baseline issue
The determination of a reference case of emis-sions (‘baseline’) to be compared to the projected or actual emissions of an activity is a crucial issue in emission reductions crediting. While AIJ is formally not a crediting approach, it still calls for a comparison of a reference case and a projected or actual emission scenario to establish the amount of GHG reductions from a project to be reported to the UNFCCC. Experience with AIJ can thus help to identify a practicable and accept-able method for baseline determination.
Several methods and procedures for baseline determination have been proposed in the litera-ture on joint implementation (see Chomitz, 1998, Michaelowa, 1998 or, for a brief overview, Jepma, 1997). For the purpose of this study, I have nity to credit AIJs at the national level (see
FCCC/SBSTA/1997/12/Add.1). Thus, we should expect that private investment in AIJ is insignifi-cant. Looking at the share of private funding in Fig. 9, however, we find a surprisingly large amount of private investment of $ 140 million, which compares to $ 47 million of public investor AIJ funds. There is also a remarkably large share of public non-AIJ related funding, e.g. from the Global Environmental Facility of the World Bank or bilateral direct aid. This result is based on a study of the investor country funding in 131 projects, for which funding data were available. Extending our analysis to the reports with non-available investor funding, we can identify an even larger degree of private sector participation in AIJ. Of the missing 12 projects with total cost of $96 million, at least 50% will be privately financed because these projects are initiated exclu-sively by private sector entities.
Most of the private funding is from US in-vestors as can be seen in Fig. 10. In this figure, AIJ projects were classified as private, public or mixed according to their funding composition. In the case of non-available funding data, projects were classified according to an exclusive private, public or a mixed institutional participation in the financing of the projects. Looking at the share of private projects, we find that private US investors funded 29 out of the 33 private projects, whereas only six private European projects and one pri-vate Australian project were reported. This result
21The public funding of AIJ projects is much smaller in Japan than in Europe. In Japan, we find government support for five projects in an amount of US$ 0.9 million. This compares to government support tor AIJ projects of US$ 42 million in the Netherlands (FY 1996 – 1999, 12 projects), US$ 40 million in Sweden (FY 1993 – 1997, 42 projects) or US$ 18 million in Norway (FY 1995-1999, 32 projects). These figures are taken from www.northsea.nl/jiq/japan.htm, www. northsea.nl/jiq/nether.htm,www.unfccc.de/fccc/ccinfo/aijprog/
developed a simplified scheme of four indicators taken from the designated national authorities’ reports to characterize observed patterns of base-line assessment. The first two of these indicators are related to the method of defining the reference scenario, where I distinguish between a static and a dynamic baseline (S/D) on the one hand, and between a fixed and an adjustable baseline (F/A) on the other. In a stylized way we may define a static baseline as resulting from an extrapolation of the status quo over the entire lifetime of a project, whereas a dynamic baseline is established by considering changing trends of technology, economic policy, behavior, etc. The keywords to identify a static approach in the DNA-reports is ‘unchanged over lifetime of the project’ which may apply to deforestation rates, energy efficiency or energy demand. A dynamic approach, on the other hand, can be identified in the DNA-reports either by models on future energy and environ-mental trends or simply by a reference to new domestic technologies (common in the host coun-try) instead of existing technology.
A fixed baseline can be defined in a stylized way as a ‘once and for all’ approach: Once defined, the baseline will be valid over the entire project dura-tion. It will not be adjusted according to new information arising in the course of project imple-mentation. An adjustable baseline, on the other hand, will account for unforeseen outside devel-opments that affect the reference scenario. Under an adjustable baseline such developments would lead to re-accounting of emission reductions. A re-accounting of emission reductions during the implementation of a project may either result from a changed reference scenario, e.g. due to a decreasing energy demand, or from a changing project scenario, e.g. from unexpected technical problems and thus increasing emissions of the project. The reader should be aware that adjusta-bility as defined above is applying to a changed reference scenario.
Another important characteristic of determin-ing emission reductions from projects is the choice of the scope of the project or system boundary. Two methods of accounting can be distinguished in this respect: an accounting of direct or primary effects (Di), and an accounting of indirect or
secondary effects (Id). Typical secondary effects of AIJ are leakage from shifting deforestation, or an increased energy demand in the course of an increased efficiency of usage-the so-called ‘snap-back effect’.
A final characteristic of baseline assessment is the verification procedure, which can either be, performed internally (I) or externally (E) by third parties, e.g. Non Governmental Organizations.22
Fig. 11 depicts a dominating S-F-Di-E-pattern of baseline assessment, i.e. a predominant static, once-and-for-all-approach in determining the baseline, which is concentrated on direct effects and verified externally. Compared to possible al-ternative approaches this is a rather simple and straightforward approach, which is only compli-cated by the involvement of third parties in the process of verification. This pattern is plausible since AIJ are not eligible for real credits. The wide use of expensive external verification, on the other hand, can be attributed to the strong support given to this procedure in several national AIJ programs, e.g. in the US or Costa Rica (see Tab. 3 of UNFCCC, 1997b).
Fig. 11. Baseline.
Fig. 12. Gross average reduction cost by activity-type ($/t CO2).
revenues from fuel saving (the amount of which can not be extracted from the available data of the DNA reports), these ALl options are clearly ‘no regrets’, i.e. options with negative cost. Only renewables and fuel substitution may have positive cost. They are at least much more expensive on average than the options mentioned before. This result is compatible with the results of previous studies on the relative cost-effectiveness of the different mitigation activi-ties (e.g. Halsnaes et al., 1996, Ridley, 1998).
4. AIJ-What can we learn from the facts?
The UNFCCC-reported projects give a rich but rather patchy picture of AIJ. Projects are unevenly distributed by region, size and activity type; emis-sion reductions and cost figures are based on rather different accounting methods, and figures on project revenues are largely missing. In this study I have attempted to sort out these figures without making any changes to the original data. From these data I find that AIJ is very much influenced by regional factors, particularly by national AIJ programs. Specifically, I find that regional investment portfo-lios in the United States on the one hand, and Europe and Japan on the other are rather different. US projects are typically large in cost and environ-mental effects, privately initiated and located in the Latin American countries. European and Japanese projects are typically small, publicly funded and located in EITs and China. This regional pattern of AIJ can be related to proximity (‘neighbourhood trading’) and to the established institutions of trade and development aid (lower transaction cost).
Another general result of this analysis is the cost minimizing feature of AIJ. AIJs are overwhelmingly no regret-measures with almost zero or even nega-tive cost. Applying simple and straightforward methods of baseline determination has minimized transaction costs. The exception to this is the verification procedure where expensive external verification prevails. This general result is consistent with a program design that prohibits the opportu-nity of crediting of emission reductions at the international and to a large extent at the national level, too.
3.6. Cost of AIJ
The costs of AIJ projects has not been reported in the UNFCCC’s synthesis reports because of the patchy and partly inconsistent cost data in the original DNA-reports (see UNFCCC, 1998, 5, 12). Looking at gross figures only (i.e. not considering project revenues), we can establish a credible and consistent picture of AIJ cost. In Fig. 12 the reader finds the average total cost per ton of CO2equivalent
reduced by activity type. Total as transaction cost for monitoring, verification and general project administration. Looking at these figures, we find that fugitive gas capture (FGC) is by far the cheapest way to reduce GHG, closely followed by LUCF-ac-tivities and acLUCF-ac-tivities related to energy efficiency (EEF). Each of these options is costing less than $4 per ton of CO2 equivalent reduced.
Given our gross total cost-approach, this is an absolute rock-bottom figure. It compares to a UNEP estimate of US$ 14 per ton of CO2, which
is based on a Non-Annex I multicountry study (UNEP, 1994). It is also well below the recent, very optimistic estimate of the price of CO2-permits on
an international emission trading market of the Clinton Administration.23Furthermore, if we take
into account that FGC and EEF are generating
Appendix A. AIJ projects (1995 – 1999)
GHG reduced Total cost Report Host Investor Subprojects Starting date
(t CO2) ($)
265 84200
ausfi jO1-98 Fiji Australia 1 1997
1997 50250
belcroO1-98 Croatia Belgium 1 792000
25169000
1997 20400000
bfanorO1-98 Burkina Faso Norway 4
1 1996 25
bhundlO1 Bhutan Netherlands 412000
1995 6023992
bizusaO1-98 Belize USA 2 2600000
1360000
n.a. 40944000
chijapO1 China Japan 1
n.a. 510000
chi japO2 China Japan 1 n.a.
n.a. 1440000
n.a.
chi japO3 China Japan 1
1 1998 3687.27 375000
crinldO1-98n Costa Rica Netherlands
846405 3395243
1997 crinorO1-98 Costa Rica Norwav 2
1284690 1100000
criusaO1 -98 Costa Rica USA 1 1995
1995 222817
criusaO2 Costa Rica USA 1 27000000
21776749
1996 12499765
criusaO3 Costa Rica USA 4
1996 36194
criusaO4 Costa Rica USA 1 8850000
57773795 18480000
n.a.
criusaO5 Costa Rica USA 2
1 1996 210796 28000000
criusaO6 Costa Rica USA
n.a. n.a.
1997
criusaO7a Costa Rica USA 1
1997 57203
criusaO8-98 Costa Rica USA 1 31500000
5900000 168000
n.a. czefraO1-98 Czech Rep. France 1
2 1992 10198000 75585000
czendlO1-98 Czech Rep. Netherlands
607150 8000000
1995
czeusaO1-98 Czech Rep. USA 2
1 1995 7073 2143590
deulvaO1 Latvia Germanv
700000 225000
1997
deurusO1 Russia Germany 1
1 n.a. 1170108 380000
ecuusaO1-98 Ecuador USA
704594 85000
1994
estsweO1 Estonia Sweden 1
1 1995 2712
estsweO2-98 Estonia Sweden 675713
1994 2000
estsweO3 Estonia Sweden 1 214646
3900
1997 213333
estsweO4 Estonia Sweden 1
1994 48600
estsweO5 Estonia Sweden 1 930145
140816 8500
1996
estsweO6 Estonia Sweden 1
1 1994 32250 901877
estsweO7 Estonia Sweden
185795 9100
1996
estsweO8 Estonia Sweden 1
1 1993 53000 633357
estsweO9 Estonia Sweden
1994 7000
estswe10 Estonia Sweden 1 432009
2200
1994 191586
estswe11 Estonia Sweden 1
1994 147000
estswe12-98 Estonia Sweden 1 732325
853372 40000
1994
estswe13 Estonia Sweden 1
1 1994 3000 366000
estswe14 Estonia Sweden
85000 827338
1993
estswe15-98 Estonia Sweden 1
1994 101000
estswe16 Estonia Sweden 1 759409
1996 n.a.
estswe17-98n Estonia Sweden 1 560000
291250
1997 1046660
estswe18-98n Estonia Sweden 1
1997 97357
estswe19-98n Estonia Sweden 1 960000
2860000 34398
1997
hndusaO1-98 Honduras USA 1
1 1997 2373940 26000000
hndusaO2 Honduras USA
26000000 2373940
1997
hndusaO3 Honduras USA 1
1995 7400
hunndlO1 Hungary Netherlands 1 1300000
1994 240000
hunndlO2 Hungary Netherlands 1 4080000
134379
n.a. 180000
idnusaO1 -98 Indonesia USA 2
1820000 n.a.
idn japO1 Indonesia Japan 1 n.a.
n.a. 1040000
n.a.
idnjapO2 Indonesia Japan 1
1998 8115660
indnorO1-98 India Norway 1 4600000
1998 5684448
Appendix A. AIJ projects (1995 – 1999)
GHG reduced Total cost Report Host Investor Subprojects Starting date
(t CO2) ($)
72700 622000
ItusweO1 Lithuania Sweden 1 1995
1994 22000
ItusweO2 Lithuania Sweden 1 539000
36500
1996 343000
ItusweO3 Lithuania Sweden 1
1 1995 194690
ItusweO4 Lithuania Sweden 1456000
1995 147000
ItusweO5 Lithuania Sweden 1 745000
3300
1996 133000
ItusweO6 Lithuania Sweden 1
1994 16350
ItusweO7 Lithuania Sweden 1 400000
824213 127254
1993 ItusweO8-98 Lithuania Sweden 1
1 1998 n.a. 1700000
ItusweO9-98n Lithuania Sweden
n.a. n.a.
1997 IvanldO1-98 Latvia Netherlands 2
1 1995 58250
IvasweO1 Latvia Sweden 887209
1994 4120
IvasweO2 Latvia Sweden 1 465893
17000
1995 189330
IvasweO3 Latvia Sweden 1
1996 45000
IvasweO4 Latvia Sweden 1 212666
274969 31250
1995
IvasweO5 Latvia Sweden 1
1 1994 30750 514803
IvasweO6 Latvia Sweden
162663 19000
1996
IvasweO7 Latvia Sweden 1
1 1994 31000 603761
ivasweO8 Latvia Sweden
1995 195000
IvasweO9-98 Latvia Sweden 1 871512
65670
1993 414187
Ivaswe10 Latvia Sweden 1
1994 159500
Ivaswe11 Latvia Sweden 1 807728
956771 46700
1996
Ivaswe12 Latvia Sweden 1
1 1995 2100 186189
Ivaswe13 Latvia Sweden
150611 3350
1996
Ivaswe14 Latvia Sweden 1
149338 800
Ivaswe15 Latvia Sweden 1 1995
1994 40000
Ivaswe16 Lahia Sweden 1 544552
30850
1996 466666
Ivaswe17 Latvia Sweden 1
1995 17000
Ivaswe18 Latvia Sweden 1 189330
260833 62928
1997
Ivaswe19-98n Latvia Sweden 1
1 1997 142100 899999
Ivaswe20-98n Latvia Sweden
303999 1980
1997
Ivaswe21-98n Latvia Sweden 1
1 1997 4640 379999
Ivaswe22-98n Latvia Sweden
1994 727130
mexnowO1 Mexico Norway 1 23000000
1080
1996 500000
mexusaO1-98 Mexico USA 1
n.a. 3065333
mexusaO3-98n Mexico USA 1 4961626
945000 7415
1998
mexusaO4-98n Mexico USA 1
1 1999 14119470 130000000
nicusaO1 Nicaragua USA
1093000 973105
1997 nidromO1 Rumania Netherlands 1
1994 296596
nidrusO1 Russia Netherlands 2 1238000
1994 315
nidrusO2 Russia Netherlands 1 3386806
2989858
1995 45000000
norpolO1a Poland Norway 21
1995 7600
norpolO1b Poland Norway 4 3110000
498000 50000
1998 norsvkO1-98n Slovakia Norwav 2
1 1998 57640 3700000
panusaO1 Panama USA
146000 292728
1993
rususaO1 Russia USA 1
1995 30955750
rususaO2 Russia USA 2 192500
n.a. 1575840
rususaO3 Russia USA 1 n.a.
858000
n.a. 1378000
rususaO4 Russia USA 1
62000 n.a.
siajapO1 Thailand Japan 1 n.a.
73500 13850
1997
sibausO1 Soiomon Australia 1
n.a. 286000
viejapO1 Vietnam Japan 1 n.a.
170778825
References
Australian International Greenhouse Partnerships Office, 1997. Intemational Greenhouse Partnerships. Guidelines and Priorities (www.dpie.gov.au/resources.energy/ environ-ment/greenhouse/igp/guidelines.html).
Baltic Sea States Summit, 1996. Presidency Declaration, Visby (from: www.baltinfo.org/docs).
Chomitz, K. M., 1998. Baselines for Greenhouse Gas Reduc-tions: Problems, Precedents, Solutions, Paper prepared for the Carbon Offsets Unit of the World Bank (unpublished). Commission of the European Communities, 1996. Final Com-munication from the Commission Baltic Sea Region Inita-tive, Brussels, 10.04.1996, SEC (96) 608 (from: www.baltinfo.org/docs).
Ellis, J., 1999. Experience with emission baselines under the AIJ pilot phase, OECD Information Paper, Paris (unpub-lished) (www.oecd.org/env/cc/freedocs.htm).
Houghton, J.T. et al. (Eds.), 1996. Climate Change 1995. The Science of Climate Change. Contribution of WGI to the Second Assessment Report of the Intergovernmental Panel on Climate Change, Cambridge.
Jepma, C. 1997. On the baseline. In: Joint Implementation Quarterly vol. 3 (2), p. 1.
Matsuo, N., 1996. AIJ Japan Program Update. In: Joint Implementation Quarterly vol. 2 (2 from:www.northsea.nl/
jiq/japan.htm).
Matsuo, N., 1998. Mm supports 37 new projects. In: Joint Implementation Quarterly vol. 4 (3), p.6.
Michaelowa, A., 1998. Joint Implementation — the baseline issue. Economic and political aspects, In: Global Environ-mental Change 8 (1), pp. 81 – 92.
NEDO, 1998. New Energy and Industrial Technology Devel-opment Organization, NEDO’s AIJ Projects, Tokyo (un-published).
Halsnaes, K. et al., 1996. A review of mitigation cost studies. In: Bruce, J.P. et al. (Eds.), Climate Change 1995. Eco-nomic and Social Dimensions of Climate Change. Contri-bution of WGIII to the Second Assessment Report of the Intergovernmental Panel on Climate Change, Cambridge, pp. 297 – 366.
Ridley, M. 1998. Lowering the cost of emission reduction:
Joint Implementation in the Framework Convention on Climate Change, Dordecht.
Schwarze, R. 1998. Activities Implemented Jointly: Another look at the facts. Diskussionspapier der Wirtschaftswis-senschaftlichen Dokumentation der TU Berlin 98- 18, Berlin (unpublished).
UNEP, 1994. UNEP greenhouse gas abatement costing stud-ies, Phase Two Report, Part 1: Main Report, UNEP Collaborating Centre on Energy and Environment, Riso National Laboratory, Denmark.
UNFCCC, 1997. United Nations Framework Convention on Climate Change/Subsidiary Body for Scientific and Tech-nological Advice, Activities implemented jointly under the pilot phase. Synthesis report on activities implemented jointly. (FCCC/SBSTA/1997/12, from www.unfccc.de). UNFCCC, 1997. United Nations Framework Convention on
Climate Change/Subsidiary Body for Scientifc and Tech-nological Advice, Activities implemented jointly under the pilot phase. Synthesis report on activities implemented jointly. Addendum (FCCC/SBSTA/1997/12/Add.1, from www.unfccc.de).
UNFCCC, 1998. United Nations Framework Convention on Climate Change/Conference of the Parties, Activities im-plemented jointly: Review of Progress under the Pilot Phase (Decision 5/CP.1). Second synthesis report on activ-ities implemented jointly. Note by the secretariat (FCCC/
CP/1998/2, from: www.unfccc.de).
U.S. Department of State, Summit of the Americas Action Plan, 1995. Implementation of the Summit Action Plan (from www.eia.doe.gov).
U.S.I.J.I, 1998. Unique Aspects of US Initiative on Joint Implementation Projects (from www.ji.org/usiji/unique. html).
White House, 1998. The Kyoto Protocol and the President’s Policies to Address Climate Change (from: www.whitehouse.
gov/WH/New/html/augnew98.htmlcKyoto).
Withycombe, H., 1997. Australia relies purely on private in-vestments AIJ financing, In: Joint Implementation Quar-terly vol.3 (1) (from: www.northsea.nljiq/australia). Wirl, F., Huber, C., Walker, I.O. 1998. Joint Implementation: