ANALYSIS
Is biodiversity-friendly coffee financially viable? An analysis
of five different coffee production systems in western El
Salvador
Jose´ A. Gobbi *
Center of Latin American Studies,The Uni6ersity of Kansas,Lawrence,KS 66045, USA Received 26 February 1999; received in revised form 1 November 1999; accepted 1 November 1999
Abstract
The current trend for reducing shade cover in coffee plantations in northern Latin America has prompted concern among conservationists because of its potential implications for the loss of biodiversity. To help reverse such a trend, a project has been launched to promote biodiversity-friendly cultural practices in coffee plantations and the marketing of certified ‘biodiversity-friendly’ coffee. This paper examines the financial feasibility of investing in the certification criteria for a ‘biodiversity-friendly’ coffee in farms with different production systems in western El Salvador. Models were developed to estimate net present values and risks associated with the investment for five hypothetical, but typical, coffee farms: (1) traditional polyculture; (2) commercial polyculture; (3) technified shade less than 1200 m elevation; (4) technified shade greater than 1200 m elevation; and (5) unshaded monoculture. To invest in the ‘biodiversity-friendly’ certification criteria was financially viable in all farms. The unshaded monoculture farm type was the most profitable case, and the farm under traditional polyculture was the only risk-free. Capital requirements for the investment are low, though they increase as shade cover in the farm becomes reduced. Small, cash-poor farmers will need assistance to make the up-front expenditures required to have the farm certified. Incentives for certified biodiversity-friendly coffee plantations such as tax relief, payment for environmental services, and soft credits could help make the investment more attractive. © 2000 Elsevier Science B.V. All rights reserved.
Keywords:Shade coffee production; Farm investment analysis; Biodiversity-friendly coffee; Agroforestry systems; El Salvador www.elsevier.com/locate/ecolecon
1. Introduction
Shade coffee plantations are potential areas for biodiversity conservation in northern Latin Amer-ica (Pimentel et al., 1992; Perfecto et al., 1996;
* Present address: College of Natural Resources and Envi-ronment, 103 Black Hall, PO Box 116455, University of Florida, Gainesville, FL 32611-6455, USA. Tel.: +1-352-3929230; fax: +1-352-3929748.
E-mail address:[email protected] (J.A. Gobbi)
Rice and Ward, 1996; Moguel and Toledo, 1999). Due to the structural and floristic complexity of the shade trees, shade coffee plantations can re-semble the original forest and harbor relatively high biodiversity (Perfecto et al., 1996; Moguel and Toledo, 1999). Evidence suggests that shade coffee plantations help preserve biodiversity and deserve protection (Aguilar Ortı´z, 1980; Williams Linera et al., 1995; Moguel and Toledo, 1996; Perfecto et al., 1996; Toledo and Moguel, 1996; Wunderle and Latta, 1996; Greenberg et al., 1997; Perfecto et al., 1997; Moguel and Toledo, 1999).
In spite of their potential as refugia for biodi-versity, a trend is underway in northern Latin America (Colombia, Panama, Costa Rica, El Sal-vador, Guatemala, Nicaragua, Honduras, and Mexico) for coffee producers to convert from shade coffee plantations to reduced or non-shaded coffee plantations. Initially, the transformation was a response to the appearance of coffee leaf rust (Hemileia 6astatrix) in Brazil and Central America during the 1970s (Perfecto et al., 1996). The recent tendency, however, appears to be mo-tivated by higher coffee yields per hectare, since yields of reduced or non-shade coffee plantations are frequently higher than those of shade coffee plantations (Perfecto et al., 1996; Rice and Ward, 1996). Recent estimates indicate that about 41% of the 2.7 million ha devoted to coffee production in northern Latin America have been converted to reduced or non-shade coffee plantations (Rice and Ward, 1996).
From the standpoint of conserving biodiversity, it is imperative to devise strategies to redirect the ongoing trend toward the simplified shade indi-cated above to biologically more diverse shade. Recently, a project has been launched in El Sal-vador to conserve biodiversity through the maintenance and enhancement of habitats within shade coffee plantations. Among the several ob-jectives associated with the project are the promo-tion of biodiversity-friendly cultural practices and the development of a market for a certified ‘biodi-versity-friendly’ coffee (Oliver Komar, 1998, per-sonal communication). Of great interest is whether the adoption of a certified ‘biodiversity-friendly’ coffee production system may provide financial returns to act as an incentive to the
farmers to retain the forest cover or increase the density of shade trees in their coffee plantations. To this end, this paper considers the financial viability of investing in the certification criteria of a ‘biodiversity-friendly’ coffee under different pro-duction systems in western El Salvador. The ob-jective of this study is to explore the effects of adopting the biodiversity-friendly certification criteria on the financial performance of coffee plantations. Information generated through the models is of potential interest not only to coffee farmers but also to government agencies in charge of environmental matters and institutions related to the coffee sector. Policy issues of current inter-est include the development of strategies to con-serve forest cover and biodiversity and to make the coffee sector more environmentally sound. The results reported here can improve the back-ground on which to base related policy decisions. Furthermore, given that throughout northern Latin America coffee plantations share many of the features described in this study, this analysis can provide some insights for adopting the biodi-versity-friendly certification criteria in other coun-tries of the region as well.
2. Coffee production systems in El Salvador
Coffee production and exportation play a prominent role in the economy of northern Latin American countries where it is the leading source of foreign exchange (Perfecto et al., 1996). In El Salvador, coffee is the most important agricul-tural export commodity representing 30% of the country’s total exports (Pe´rez, 1996). Coffee is also an important generator of employment, en-gaging approximately 15.5% of the economically active rural population (Pe´rez, 1996). There are around 20 000 coffee farms that cover 196 000 ha or 9% of the country (Direccio´n General de Eco-nomı´a Agropecuaria, 1996). Coffee plantations are located on the volcanic coastal range at alti-tudes between 300 and 1800 m. Of the two com-mercially important coffee species,Coffea arabica
which produce 3 – 4 years after planted and have an economic life between 20 and 30 years (Gal-loway and Beer, 1997).
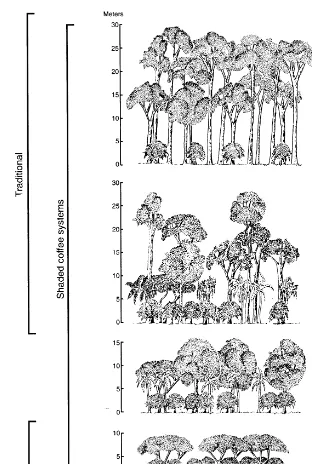
Coffee is cultivated under several structurally different production systems in Latin America. These systems conform a continuum from the more traditional ones, with higher diversity in the structure and composition of the shade canopy, to those with reduced shade and intense manage-ment (Moguel and Toledo, 1996; Perfecto et al., 1996; Rice and Ward, 1996). Following a classifi-cation developed in Mexico using shade levels and management as indicators for intensification, we can distinguish five coffee production systems: rustic (R), traditional polyculture (TP), commer-cial polyculture (CP), technified shade (TS), and unshaded monoculture (SUN), the first two classified as ‘traditional’ and the last two as ‘mod-ern’ (Fuentes Flores, 1979; reviewed by Moguel and Toledo, 1996) (Fig. 1). In El Salvador, it is possible to recognize these five systems, although the rustic and SUN systems are not important in the extent of production. The tendency to mod-ernization has been more significant in farms greater than 35 ha, while in smaller farms the traditional and commercial polyculture systems are predominant.
As shown in Fig. 1, in rustic systems, coffee is grown under the shade of a natural forest where the understory has been replaced by coffee shrubs but the native forest canopy remains more or less intact. This system is the less intensive one, affect-ing minimally the composition and structure of the original forest. Farms under rustic system are rare in El Salvador. The traditional polyculture system resembles the rustic system in structure, but has a greater diversity due to the deliberate planting of economically valuable shade tree spe-cies by the farmer. This system is generally com-mon in farms less than 15 ha located in the lowlands (between 500 and 800 m). In commercial polyculture, the shade trees are mostly planted rather than remaining from the original natural forest. Citrus, banana, avocado, and wood for timber are planted as alternative commercial products. This system is common in farms less than 15 ha distributed up to 1200 m.
When the original forest has been entirely re-moved and replaced with a few tree species (usu-ally Inga spp.) to provide shade to the coffee bush, it is called a technified shade system. Under this system, coffee plantations have a controlled appearance and the density of the shade trees is low with considerable gaps between them. The density of shade trees follows an indirect relation-ship with the altitude where the farm is located: the higher the location of the farm, the lower the density of shade trees. This system is predominant among farms greater than 35 ha and located at more than 1200 m. In the unshaded monoculture system, the coffee plantation is exposed to full sun, and the land is completely stripped of all shade trees. The SUN plantations resemble tightly packed hedgerows and the coffee plant produces high yields, but the system is highly dependant on chemical inputs. SUN coffee plantations require elevated initial investments and are costly to maintain, which make them financially vulnerable to market swings. This system is uncommon in El Salvador and the area covered is limited. Farms with SUN production systems are only found at more than 1200 m in El Salvador.
3. What is a ‘biodiversity-friendly’ coffee plantation?
Under the current trend towards reducing shade cover in northern Latin America (Perfecto et al., 1996; Rice and Ward, 1996), farmers must have financial incentives to keep abundant and diversified shade in their coffee plantations. One of the intentions of promoting a biodiversity-friendly coffee is to obtain a premium over the market price that recognizes the value of shade cover in conserving biodiversity. The above de-scription of the different production systems, however, indicates that not all shade covers are good for conserving biodiversity. As shade cover becomes simplified, its importance as a refuge for biodiversity decreases. Therefore, it is necessary to define what constitutes a biodiversity-friendly cof-fee plantation.
Fig. 1. Coffee production systems according to shade gradient and composition. Modified from Moguel and Toledo, 1999.
a diverse shade canopy is essential, pruning prac-tices should have minimal impact on the epiphytic plants, mosses, and lichens, and the use of agro-chemicals should be reduced (Perfecto et al., 1996). The Ministry of Environment and Natural Resources held a workshop during December
the workshop, a biodiversity-friendly coffee plan-tation must meet the following basic requirements: (a) the shade, in the part of the farm devoted to coffee production, must cover a minimum of 40% of the land with even distribution; at altitudes above 1200 m, average shade of 40% over the entire property is acceptable; (b) the shade of the coffee plantation must include as a minimum ten species of native trees, with a minimum density of 1.4 individuals of each species per hectare; (c) prescribed conservationist practices for managing forest, soil, and bodies of water must be adopted; (d) hunting and removal of flora and fauna for commercial purposes are prohibited; (e) solely authorized low-toxicity pesticides must be used following national and international standards for the application of agrochemicals; and (f) workers must be trained in the use, storage and application of agrochemicals.
4. Financial analysis of adopting the ‘biodiversity-friendly’ certification criteria
A benefit-cost analysis to evaluate the financial viability of investing in the conversion of an estab-lished coffee plantation to ‘biodiversity-friendly’ (BF) was conducted. Models were developed fol-lowing Brown (1979) and Gittinger (1982) for five hypothetical, but representative, coffee planta-tions under different production systems in west-ern El Salvador. The five coffee plantations were defined as follows: (1) plantation with TP; (2) plantation with CP; (3) plantation with TS at less than 1200 m; (4) plantation with TS at more than 1200 m; and (5) plantation with SUN at more than 1200 m.
For each one of the models, the following steps were carried out: (1) estimated parameters of pro-duction and sale for the ‘typical’ farm according to each coffee production system; (2) computed investments to certify the farm as BF, and esti-mate the production costs and sales of the farm once certified; (3) created cash flow over a 20-year period; (4) using a Monte Carlo approach, incor-porated risk for the production and price vari-ables; and (5) estimated expected net present values (NPV) considering the situation certified as
BF (with the project) versus the situation non-cer-tified (without the project) in order to obtain the incremental net benefits due to adopting the BF certification criteria. The final result for the Monte Carlo simulations were sets of 3000 NPVs for each model. Results are presented as frequency distri-butions of a possible range of incremental NPVs. The basic numbers for production costs, pro-duction per hectare, replanting costs, investment costs, and sale prices were derived from data provided by the Salvadorian Coffee Research Foundation (PROCAFE). The data correspond to a total of 45 coffee farms located in western El Salvador, identified according to production sys-tem, that were surveyed by PROCAFE during 1997. All data are pertinent to the coffee farming year 1996/1997. Data were used to create farm budgets, which were later utilized as a base for developing the models. All prices (production costs and sales) are farm-gate prices, presented on a 1-ha basis. Prices are expressed in US dollars1 and without adjustments for inflation.
Operating funds are derived from sales of coffee and production loans. In addition to coffee, other products from the coffee plantation may be sold.2
1US$ 1.00=8.75 Salvadorenian colones (12/97).
Revenues from these additional products was not quantified or included in the analysis because: (1) there was no information about the magnitude or value of the sales (sales of medicinal and orna-mental plants, and uses of wildlife); (2) sales are erratic and unplanned, making revenue calcula-tions unwieldy (timber); (3) precise yields are not reliable since reported sales include sources other than coffee plantations (firewood); or (4) there is no inherent difference in the situation ‘with’ ver-sus ‘without’ the project in the value of the sales (fruits).
Coffee plants have a ‘cyclic production’ so that a year of high production may be followed by a decrease up to 50% the next year due to depletion of the plant resources. To reflect this circum-stance, yields from the last 3 years were averaged. In this way, production values represent the farm’s mean yields taking into account years of high as well as low yields. In general, more than half of the coffee plants in El Salvador are older than 20 years. Given that older coffee plants produce lower yields, farmers are re-placing those plants. The models assumed that the farmers replant 5% of the coffee plantation every year.
The representative coffee price paid by the
beneficios (processing plants) to the coffee farmer for the harvest 1996/1997 was $103 perquintal oro
(qq, common weight unit used for coffee equiva-lent to 46 kg; Consejo Salvadoren˜o del Cafe´, 1997). This price was adjusted into the future by the historical rate of price increase for cocoa, coffee and tea, which is 0.63% per year (Radetzki, 1990).
As with other certified environmentally-friendly products (e.g. organic products (UNCTAD, 1996)), it is expected that a BF coffee will obtain a premium3 over the market price for being cer-tified as such. Since no coffee is currently mar-keted as BF, it is assumed that the premium for BF will have a similar behavior to that for
or-ganic coffee. Premiums for oror-ganic coffee vary inversely with the relative price of the coffee market (Boyce et al., 1994). This means that when the commodity market is low, premiums are high and vice versa. In the models, the expected premi-ums for BF vary along with the price in an inverse relationship. The premiums are also set up with declines in premium size over time, as more pro-ducers enter the market. The premium is obtained during the second year for the farm with tradi-tional polyculture, after investments have been undertaken in the coffee plantation to be certified BF. In the rest of the farms, the premium is obtained at the sixth year of the project, when the shade trees provide a minimum cover of 40% and all the certification criteria are met (Appendix A).
Farmers borrow money to finance their annual production. In the models, the credits were as-sumed to be annual production loans covering 75% of the production costs. In the scenario of the farm certified as BF, certification costs are included as part of production costs. The real interest rate (after inflation is removed) for the short-term coffee production loan was estimated as 10%, and the loan is fully paid back each year after the coffee was sold.
Coffee production costs result from inputs and materials, harvest and cultivation labor, sales costs, administration, and repairs and mainte-nance. While expenditure categories are common to all production systems, magnitudes vary across systems (Table 1).
Most of the production costs were defined as fixed, i.e. a fixed amount per hectare of coffee in cultivation (Table 1). The only production cost that was defined as variable is the labor cost for harvesting, which was stated in 5 man-days per quintal. Average harvesting labor wage was esti-mated at $3.00/day. The labor costs of cultivation include clearing, replanting, weeding, pruning, and applying fertilizers.
Costs related to compliance with the BF certifi-cation criteria include: (a) the implementation of a permanent training program for the workers in the use, storage and application of agrochemicals; (b) maintaining a minimum density and composi-tion in the shade trees; and (c) the expenses of the
certifying team (Table 2). The costs of implement-ing a trainimplement-ing program on managimplement-ing agrochemi-cals was estimated to be about $92.00 per year. For satisfying the second criteria, a certain mini-mum number of native shade trees, which varies according to production system and altitude of the farm, should be planted per hectare (see below). It is assumed that each shade tree covers approximately 25 m2 (Mario Salazar, 1997, personal communication), and that shade trees planted in the first year of the project will provide such cover in the sixth year of the project. Costs associated with planting and
maintaining shade trees are incurred during the first 3 years; afterwards, shade trees do not require further care other than pruning. The cost of certifying the farm as BF includes the travel expenses and the salary costs of visiting inspectors. This cost is fixed per farm regardless of production system, location, or size of the farm. The figure estimated for the cost of certifica-tion is $700.00 per year. The certificacertifica-tion cost is incurred beginning in the first year in the coffee plantation under TP, while it is incurred begin-ning in the sixth year in the rest of the planta-tions.
Table 1
Coffee production costs according to production systems for farms in western El Salvador (in US$) Coffee plantationsa
TSB1200 m
CP SUN\1200 m
TP TS\1200 m
Variable(per qq.)
15.00
Production labor-harvest 15.00 15.00 15.00 15.00
Fixed(per ha)
426.01 406.64
387.29 Production labor-cultivation 287.25 314.37
266.05
Inputs and materials 286.26 388.46 407.88 466.15
20.59 31.70
Repair and maintenance 32.90 33.04 55.72
60.09 95.77
54.47 85.83
Sales and administration 82.47
aTP, traditional polyculture; CP, commercial polyculture; TSB1200 m, technified shade at less than 1200 m above sea level; TS\1200 m, technified shade at more than 1200 m above sea level.; SUN\1200 m, unshaded monoculture at more than 1200 m above sea level.
Table 2
Initial investments and incremental production costs associated with adopting the biodiversity-friendly certification criteria in coffee plantations under different production systems (in US$/ha), western El Salvador
Coffee plantationsa
TP CP TSB1200 m TS\1200 m SUN\1200 m 0 28.00
Planting shade trees (@ $1.00/tree)b 104.00 124.00 160.00
99.20 83.20
22.40 0
Maintaining shade trees (@ $0.80/tree)c 128.00
62.00 80.00
14.00
Pruning shade trees (@ $0.50/tree)d 0 52.00 140.00 46.67
Certification teamd 20.00 10.00 10.00
6.13
18.40 1.31
Training workers in the use of agrochemicalse 26.28 1.31
aTP, traditional polyculture; CP, commercial polyculture; TSB1200 m, technified shade at less than 1200 m above sea level; TS\1200 m, technified shade at more than 1200 m above sea level.; SUN\1200 m, unshaded monoculture at more than 1200 m above sea level.
bIncurred only during the first year. cIncurred during the second and third years. dIncurred beginning in the sixth year.
Table 3
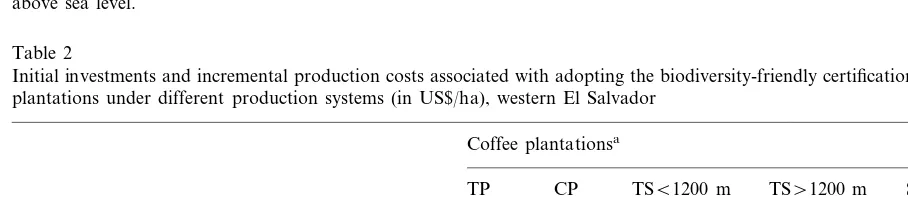
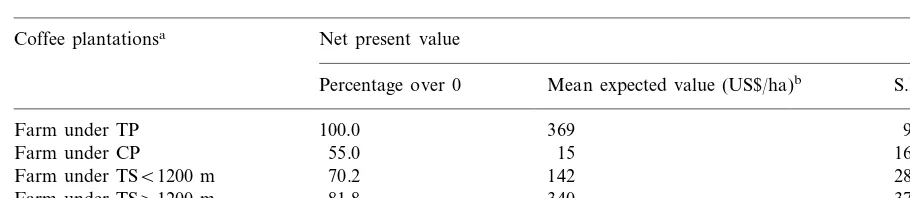
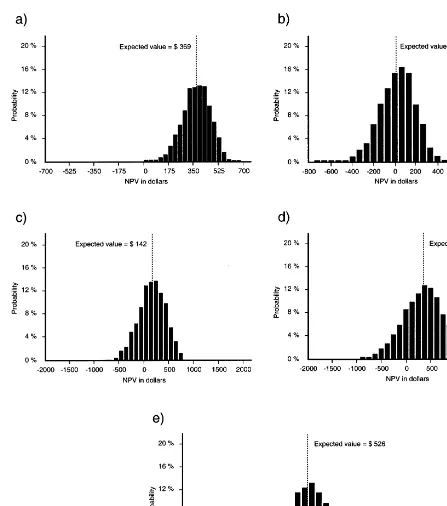
Financial analysis of adopting the biodiversity-friendly certification criteria in coffee plantations with different production systems in western El Salvador: simulation results
Net present value Coffee plantationsa
Mean expected value (US$/ha)b S.D. (US$/ha) Percentage over 0
Farm under TP 100.0 369 96
55.0
Farm under CP 15 163
142
70.2 285
Farm under TSB1200 m
81.8
Farm under TS\1200 m 340 377
526 445
Farm under SUN\1200 m 87.8
aTP, traditional polyculture; CP, commercial polyculture; TSB1200 m, technified shade at less than 1200 m above sea level; TS\1200 m, technified shade at more than 1200 m above sea level.; SUN\1200 m, unshaded monoculture at more than 1200 m above sea level.
bThese values represent the incremental gains over the non-certified production of the coffee farm.
Using the Monte Carlo simulation, the uncer-tainty of variations in coffee prices and coffee yields was incorporated into the models. World coffee prices show short-term fluctuations driven by factors such as weather patterns, size of stocks in producing and consuming countries, and eco-nomic conditions, among others (UNCTAD, 1995). El Salvador possesses an open market sys-tem (Pelupessy, 1993), that makes internal coffee prices paid to farmers move roughly parallel to the world market following its short-term fluctua-tions. It is estimated that the internal coffee price may deviate 920% from the projected future price based on an historical range of $30.60 – 172.71 per quintal. A lognormal probability distri-bution curve was used to model the price changes. For farmers with coffee plantations under pro-duction systems other than TP, an important concern regarding the investment in a BF produc-tion system may be that incorporating more shade trees may reduce coffee production yields. To reflect this concern, the models assumed that de-creases in the yields up to 15% in farms under CP, TS, and SUN may occur as shade trees grow and the canopy begins to close. A triangular probabil-ity distribution (minimum, most likely, maximum) was used to express decreases in production yields with the following values in percent: year 4 (−5%, −2%, 0%); year 5 (−10%, −5%, 0%); years 6 – 20 (−15%, −10%, 0%).
A real discount rate of 10% was used, which was derived from the interest rate applied by the
banks for coffee production loans minus the infla-tion rate. The life of the project for the investment analysis was 20 years. This period corresponds to the average optimal life of a coffee plant.
4.1. Farm with traditional polyculture
The farm has a surface of 5 ha and is located at low altitude (700 m above sea level). The coffee plantation has a density of 1700 plants of coffee per hectare with an average yield of 11.5 qq/ha. There are 200 shade trees/ha providing a 50% shade cover of the coffee plantation. The result of the simulations models are presented in Table 3 and Fig. 2.
4.2. Farm with commercial polyculture
4.3. Farm with technified shade at medium altitude
The farm has a surface of 35 ha and is located at medium altitude (1000 m above sea level). The entire farm is devoted to coffee plantation with a density of 3500 plants/ha, producing an average yield of 32.6 qq/ha. There are 70 trees/ha ofInga
spp., which provide 15% shade cover. To fulfil the certification criteria on the density and composi-tion of the shade cover, 104 trees of at least ten native species are planted per hectare. The costs of planting and maintaining these additional shade trees are summarized in Table 2. The simu-lation results are summarized in Table 3 and Fig. 2.
4.4. Farm with technified shade at high altitude
The farm has a size of 70 ha and is located at high altitude (1400 m above sea level). The coffee plantation contains a density of 4600 plants/ha producing an average yield of 42 qq/ha. The coffee plantation possesses a 10% shade cover provided by 47 trees/ha ofIngaspp. To provide a 40% shade cover of the coffee plantation, 124 shade trees of at least ten native species are planted per hectare. The costs of incorporating and maintaining the additional shade trees are described in Table 2. The simulation results are summarized in Table 3 and Fig. 2.
4.5. Farm with unshaded monoculture
The farm comprises a surface of 70 ha and is located at high altitude (1400 m above sea level). The coffee plantation contains a density of 5500 plants/ha producing an average yield of 50.4 qq/
ha. To fulfil the certification criteria about shade cover, 160 trees of at least ten native species are planted per hectare. The costs of planting and maintaining the required extra shade trees are reported in Table 2. The results of the simulations for a SUN coffee plantation adopting the BF certification criteria are presented in Table 3 and Fig. 2.
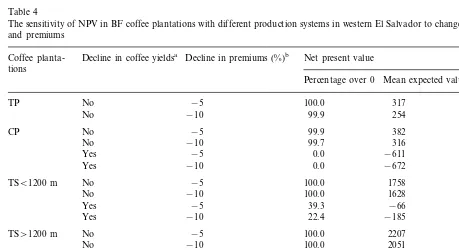
4.6. Sensiti6ity analysis
The sensitivity of the investment to declines in coffee production due to shade effects and to declines in premium levels was assessed. Except for the farm with CP, the net present value of the BF coffee plantations is more sensitive to declines in coffee yields than to decreases in the forecasted premium levels (Table 4). This is mainly due to the direct relation between coffee yields and net income.
5. Discussion
The models indicate that investing in the certifi-cation criteria for BF coffee is financially feasible for farms under different production systems in El Salvador. For the five farms, the simulation re-sults show positive expected net present values in more than 50% of the trials (Table 3). Large differences in the results, however, are evident among the different production systems (Table 3 and Fig. 2). The results also indicate that financial feasibility increases directly in relation to yields, as net income in the certified farm is a function of coffee production (Table 4).
Investing in the TP farm presents the most promising case, in which 100% of the expected net present values are positive (Table 3 and Fig. 2). By definition, TP farms fulfil the requirements of composition and density of shade trees. The only additional certification costs incurred are capaci-tation of workers in the use of agrochemicals and the costs of the certifying team (Table 2). As result, the TP farm shows the lowest costs associ-ated with the certification criteria. Nevertheless, as TP farms tend to be of small size, those costs are high per hectare (Table 2). In El Salvador, they represent an increase of about 20% of the production costs per hectare of a similar non-cer-tified farm. Yet, revenues easily compensate for those costs, as coffee is paid a premium starting at year 2 of the project and production yields remain unaffected by the adoption of the certification criteria.
(Table 3 and Fig. 2). The capital requirements for the initial investments on shade trees in the first 3-year period were low (Table 2). Similarly, incre-mental production costs for managing the farm once certified were not considerable (Table 2), representing about 6% of the production costs for a similar non-certified CP farm. In spite of these low capital requirements, net present values were positive only 55% of the time (Table 3). Farms with CP are characterized by modest coffee yields since the land is devoted to different economic enterprises. Coffee yields were even poorer when the farm was certified (in the model), as production may decline in response to adding shade trees. Those poorer yields mean discrete incremental revenues for BF that are just enough to compensate the required investments and the opportunity cost of lower yields.
Finally, investing in the TS farms at medium and high altitude and in the SUN farm was financially viable with acceptable levels of risk (Table 3 and Fig. 2). The initial investment in planting shade trees jumped up significantly for these farms with respect to that from the CP farm (Table 2). Not surprisingly, the SUN farm exhib-ited the largest initial investment, followed by the farm with TS at more than 1200m, and the farm with TS at less than 1200 m, respectively. Yet, these capital requirements were not considerable, representing less than 10% of the production costs in all farms. Contrary to the CP farm, production yields in the three farms were substantially higher. Thus, the incremental revenues (from being cer-tified as BF) offset the larger initial investments and the opportunity cost of abatements in coffee yields. Indeed, the SUN farm was the most remu-nerative investment with the lowest associated risk.
Table 4
The sensitivity of NPV in BF coffee plantations with different production systems in western El Salvador to changes in coffee yields and premiums
Decline in coffee yieldsa
Coffee planta- Decline in premiums (%)b Net present value tions
Percentage over 0 Mean expected value (US$/ha)
No −5
TP 100.0 317
No −10 99.9 254
382 No
CP −5 99.9
316
No −10 99.7
−611 0.0
−5 Yes
Yes −10 0.0 −672
No
TSB1200 m −5 100.0 1758
1628 100.0
−10 No
39.3
−5 −66
Yes
Yes −10 22.4 −185
2207 No
TS\1200 m −5 100.0
No −10 100.0 2051
Yes −5 37.1 −123
Yes −10 23.5 −265
−5
SUN\1200 m No 100.0 2655
−10
No 100.0 2469
Yes −5 38.6 −140
Yes −10 24.4 −312
aDeclines in coffee yields are due to increases in shade cover: no=no drops in yields; yes=maximum declines are: year 4 (−5%), year 5 (−10); years 6–20 (−15%).
Since the process to ‘modernization’ of coffee plantations started in the 1970s, coffee farms with dense shade cover have usually been perceived as inefficient and unproductive (Perfecto et al., 1996). Based on this premise, agronomic research and technical advice directed to increasing coffee yields in northern Latin America has focused on the reduction or elimination of the shade cover. As a result, there is a lack of knowledge about how to increase production in a coffee plantation with high levels of shade cover. Although TP farms represent the safest case for adopting the BF certification criteria, the mentioned lack of know-how constitutes a limitation for increasing revenues. If yields were raised, farmers may see the value of their properties increased, and conse-quently, their borrowing capacity enlarged. Fur-thermore, BF coffee in TP farms would be a more competitive option compared to other land-use alternatives.
The modernization has also led to concern that increasing the shade cover in farms may result in yield declines. Studies underway in Costa Rica indicate that increases in shade cover up to 40% do not affect coffee production (Eduardo Somar-riba, 1997, personal communication). Further-more, coffee varieties cultivated in El Salvador are shade tolerant (Galloway and Beer, 1997), which makes the chance of dramatic abatements in yield because of increase in shade cover unlikely. If the fulfilment of the 40% shade cover requirement does not have negative incidence on coffee pro-duction, the investment becomes riskless (Table 4). For the four farms that require investments in additional shade trees such an eventuality would pull net present values up, reducing accordingly the risk of the investment. It would also represent a strong incentive for farmers, particularly those with CP farms, to invest in a BF production system.
Although not contemplated in the models for simplicity, farmers may consider choosing timber species when adding the required shade trees. Since timber species are common components of the shade strata of perennial crops like coffee (Fuentes Flores, 1979), they are a reasonable op-tion. Farmers, however, are concerned with dam-age to coffee plants due to tree felling and log
skidding when timber species are harvested (Mus-sak and Laarman, 1989). There are indications that such concern should not be a limitation for adding timber shade trees in coffee plantations (Somarriba, 1997). A study in Costa Rica shows that damage to coffee plants can be minimized following basic rules for planting and pruning the shade trees, and that income from timber sales easily pays for the planting and management of shade trees and for the limited damages inflicted to coffee plants (Somarriba, 1992). Those findings suggest that adding timber species is likely to produce larger net present values than the ones generated by the models in this study.
Adopting the certification criteria requires some initial capital, which varies according to the pro-duction system in the farm. This requirement can be burdensome for small farmers if they have no access to credit, as has been the case in El Sal-vador (Pelupessy, 1993). Particularly demanding is the estimated $700 cost of the certification team that small farmers could not cover without some assistance. For example, most of the owners of TP farms, the most significant production system for conserving biodiversity, are cash-poor farmers who do not have the monetary resources to pay that cost. In this regard, international NGOs and aid agencies from developed countries could assist with start up funds to subsidize the cost of the certification team in small farms, at least during the initial years of the project. In this manner, the local certifying agency, which is a non-profit foun-dation, could bestow those costs allowing small farmers to became enrolled in the project and receive financial compensation for the environ-mental services that their farms provide to the global society.
green-conscious purchases (UNCTAD, 1996). Speciality coffees have exhibited the fastest growth rate among the different coffee categories (Thrupp, 1995). Whereas factors related to green consumerism are diverse (UNCTAD, 1996), an increasing number of coffee drinkers are con-cerned with conserving bird habitats and forests and prevention of water pollution (Rice and Ward, 1996). In the US alone, about 10 000 pack-ages of ‘bird-friendly’ coffee are sold each month (David Griswold, 1997, personal communication), bearing retail prices of up to $10.50 per a 14-oz package. Under the favorable conditions of an expanding market for speciality coffees with con-sumers preoccupied with environmental quality, it is likely that BF coffee has a good chance of establishing a niche in the market. Predicting the level of the premium for BF is at this time an educated guesswork. The closest antecedent is the premium paid for certified organic coffees. Or-ganic coffees may command premiums up to 100% of the conventional product price, although on average they bear premiums in the order of 10 – 30% above the price of similar non-certified coffees (UNCTAD, 1996). Obviously, the models in this paper are confined to one of a myriad of possible premium combinations. Other combina-tions based on different assumpcombina-tions are likely to produce different results.
5.1. A comment on the ecosystem ser6ices and
social benefits deri6ed from biodi6ersity-friendly
coffee plantations
BF coffee plantations provide coffee and other goods through well-established markets, but also provide numerous ecosystem services and social benefits, all of which contribute to human welfare but are not captured by the market. Among the ecosystem services provided by BF coffee planta-tion we can menplanta-tion, at least: (1) providing refu-gia and habitats for biodiversity (Perfecto et al., 1996; Rice and Ward, 1996; Moguel and Toledo, 1999); (2) maintaining and enhancing the nutrient and organic content of soils (Wilken, 1987; Bocco, 1991; Babbar and Zak, 1993); (3) sequestering carbon (Herrera, 1995); (4) pollinating crops and other plants (Perfecto et al., 1997); (5) controlling
pest outbreaks (Ibarra-Nunez, 1990); and (6) act-ing as sources of clean air and water (MAG, 1995). The social benefits, at least, include: (1) improved health conditions for farmers and coffee workers through reduced and/or controlled use of agrochemicals; (2) improved living conditions for local workers through an environmental educa-tion campaign to provide informaeduca-tion on how to live in a cleaner and healthier environment; (3) increased opportunities for recreation and eco-tourism; and (4) increased opportunities for ex-pressing and developing the ethical, aesthetic, and cultural values of many farmers and citizens who appreciate ‘the beauty of nature’.
6. Conclusions
Under the model’s assumptions, to invest in the BF certification criteria is financially profitable for farms under different production systems in west-ern El Salvador. If adding shade trees has no effect on coffee yields, the prospects further im-prove. The capital required for investment in the certification criteria is not substantial, though it increases when shade cover is at a low level. In practice, small farmers may need additional help and incentives to adopt the BF certification crite-ria. Small, cash-poor farmers with TP coffee plan-tations may not participate in the project if assistance is not provided to cover up-front costs of the certifying team. Small farmers with CP farms need to be presented with strategies to lower the risk of the investment, like choosing timber species as additional shade trees or any other combination aimed at maximizing net present values. Additional stimuli may include declaring certified BF coffee plantations as ‘priority areas’ for forest conservation as con-templated by the proposed Law on Special Forestry Incentives. According to this law, owners of priority areas are entitled to receive different incentives, including payments for environmental services, tax deductions, and loan facilities for planting trees. If this were the case, the financial benefits of adopting the certification criteria would certainly increase, which in turn would improve the prospects for CP farms. Moreover, it would make more attractive the investment to coffee farmers with TS and SUN production sys-tems.
Acknowledgements
This analysis was supported by a preparation grant from the Global Environmental Facility, and by El Salvador’s Ministry of Environment and Natural Resources. I would like to thank personnel from PROCAFE: Guillermo Pe´rez, Mario Salazar, Salvador Gonza´lez, Felipe Cero´n, Antonio Mun˜oz, Napoleo´n Bonilla, Manuel Tor-res, and staff from the Department of Economic Studies and Planning for their help and support
for obtaining the data. The manuscript greatly benefited from the comments and critics, although not all agreed, provided by Clyde Kiker, Ricardo Olea, Oliver Komar, Robert Mendelsohn, and two anonymous reviewers. Analı´a Pu´gener pre-pared the illustrations.
Appendix A. Percentages assigned to the premium for ‘biodiversity-friendly’ according to coffee price levels
1. For TP farms
Years 1–10
Coffee price level Years 11–20 (%)
(%)
5 3
More than $135/
15
Between $100 10 and 135/qq
Between $65 and 25 20 100/qq
25 Less than $65/qq 30
2. For the rest of the farms
Years 11–20 Years 6–10
Coffee price level
(%) (%)
More than $135/ 5 3 qq
Between $100 15 10 and 135/qq
25
Between $65 and 20 100/qq
Less than $65/qq 30 25
References
Babbar, L., Zak, D., 1993. Nitrogen cycling in coffee agrosys-tems, net N mineralization and nitrification in the presence and absence of shade trees. Agriculture Ecosyst. Environ. 48, 107 – 113.
Bocco, G., 1991. Traditional knowledge for soil conservation in Central Mexico. J. Soil Water Conserv. 46, 346 – 348. Boyce, J.K., Ferna´ndez Gonza´lez, A., Fu¨rst, E., Segura
Bonilla, E., 1994. Cafe´ y Desarrollo Sostenible: del Cultivo Agroquı´mico a la Produccio´n Orga´nica en Costa Rica. Editorial Fundacio´n UNA, Heredia.
Brown, M., 1979. Farm Budgets: from Farm Income Analysis to Agricultural Project Analysis. The World Bank, John Hopkins University Press, Baltimore, MD.
Consejo Salvadoren˜o del Cafe´, 1997. Ambiente cafetero na-cional. Rep. Trimestral Estado Caficultura Nacional 9, 6 – 8.
Current, D. and Jua´rez, M., 1992. Estado presente y futuro de la produccio´n y consumo de len˜a en El Salvador. USAID, El Salvador (unpublished), 123 pp.
Direccio´n General de Economı´a Agropecuaria, 1996. El Sal-vador Agrı´cola: Mapa de Uso Actual del Suelo 1995 – 1996. Ministerio de Agricultura y Ganaderı´a, San Salvador. Fuentes Flores, R., 1979. Coffee production systems in
Mex-ico. In: de Salas, G. (Ed.), Agroforestry Systems in Latin America. Centro Agrono´mico Tropical de Investigacio´n y Ensen˜anza, Turrialba, Costa Rica, pp. 60 – 72.
Galloway, G., Beer, J., 1997. Oportunidades para Fomentar la Silvicultura en Cafetales en Ame´rica Central. Centro Agro-no´mico Tropical de Investigacio´n y Ensen˜anza, Turrialba, Costa Rica.
Gittinger, P., 1982. Economic Analysis of Agricultural Projects. The World Bank, John Hopkins University Press, Baltimore, MD.
Greenberg, R., Bichier, P., Sterling, J., 1997. Bird populations and planted shade coffee plantations in eastern Chiapas, Mexico. Biotropica 29, 501 – 514.
Herrera, A., 1995. Balance del Impacto Ambiental del Cultivo y Procesamiento del Cafe´ en El Salvador. Unio´n de Coop-erativas de Cafetaleros de El Salvador, San Salvador. Ibarra-Nunez, G., 1990. Los artro´podos asociados a cafetos en
un cafetal mixto del Soconusco, Chiapas, Me´xico. Variedad y abundancia. Folia Entomol. Mexicana 79, 207 – 231.
MAG, 1995. Polı´ticas Forestales en El Salvador. Ministerio de Agricultura y Ganaderia, San Salvador.
Moguel, P., Toledo, V., 1996. El cafe´ en Me´xico: ecologı´a, cultivo indı´gena y sustentabilidad. Ciencia 43, 50 – 51. Moguel, P., Toledo, V., 1999. Biodiversity conservation in
traditional coffee systems of Mexico. Conserv. Biol. 13, 11 – 21.
Mussak, M.F., Laarman, J.G., 1989. Farmer’s production of timber trees in the cacao-coffee region of coastal Ecuador. Agroforestry Syst. 9, 155 – 170.
Pelupessy, W., 1993. El Mercado Mundial del Cafe´: El Caso de El Salvador, 1960 – 1995. Universidad Nacional, Heredia.
Pe´rez, G., 1996. Importancia de la Caficultura en la Economı´a de El Salvador, 1960 – 1995. PROCAFE, Nueva San Sal-vador (Unpublished), 27 pp.
Perfecto, I., Rice, R.A., Greensberg, R., Van der Voort, M.E., 1996. Shade coffee: a disappearing refuge for biodiversity. BioScience 46, 598 – 608.
Perfecto, I., Vandermeer, J., Hanson, P., Cartin, V., 1997. Arthropod biodiversity loss and the transformation of a tropical agro-ecosystem. Biodiversity Conserv. 6, 935 – 945. Pimentel, D., Stachow, U., Takacs, D.A., Brubaker, H.W., Dumas, A.R., Meany, J., O’Neil, J.A., Onski, D., Corzil-ius, D.B., 1992. Conserving biological diversity in agricul-tural/forestry systems. BioScience 42, 254 – 362.
Radetzki, M., 1990. A Guide to Primary Commodities in the World Economy. Basil Blackwell, Cambridge.
Rice, R., Ward, J., 1996. Coffee, Conservation, and Com-merce in the Western Hemisphere. How Individuals and Institutions Can Promote Ecologically Sound Farming and Forest Management in Northern Latin America. Smithso-nian Migratory Bird Center and Natural Resources De-fense Council, Washington, DC.
Somarriba, E., 1992. Timber harvest, damage to crop plants and yield reduction in two Costa Rican coffee plantations with Cordia alliodora shade trees. Agroforestry Syst. 18, 69 – 82.
Somarriba, E., 1997. Se puede aprovechar a´rboles maderables sin dan˜ar al cafe´? Agroforesterı´a Am. 4, 28 – 29.
Thrupp, L., 1995. Bittersweet Harvest for Global Supermar-kets: Challenges in Latin America’s Agricultural Export Boom. World Resources Institute, Washington, DC. Toledo, V., Moguel, P., 1996. Searching for sustainable coffee
in Mexico: the importance of biological and cultural diver-sity. In: Rice, A., Harris, M., McLean, J. (Eds.), Proceed-ings of the First Sustainable Coffee Congress. Smithsonian Migratory Bird Center, Washington, DC, pp. 163 – 173. UNCTAD, 1995. Recent trends on the world coffee market.
UNCTAD/COM/59, Geneva.
UNCTAD, 1996. Organic production in developing countries: potential for trade, environmental improvement, and social development. UNCTAD/COM/88, Geneva.
Wilken, G.C., 1987. Good Farmers: Traditional Agricultural Resource Management in Mexico and Central America. University of California Press, Berkeley, CA.
Williams Linera, G., Sosa, V., Platas, T., 1995. The fate of epiphytic orchids after fragmentation of a Mexican cloud forest. Selbyana 16, 36 – 40.
Wunderle, J., Latta, S.C., 1996. Avian abundance in sun and shade coffee plantations and remnant pine forest in the Cordillera Central, Dominican Republic. Ornitol. Neotropical 17, 19 – 34.