TIME-SERIES ANALYSIS OF SATELLITE-MEASURED VEGETATION PHENOLOGY
AND AEROSOL OPTICAL THICKNESS OVER THE KOREAN PENINSULA
S. Park a a
Geography Education, Pusan National University, Busan, Korea - [email protected]
ATMC-4
KEY WORDS: Aerosol, MODIS, Vegetation Index, Phenology, AOT
ABSTRACT:
The spatiotemporal influences of climatic factors and atmospheric aerosol on vegetative phenological cycles of the Korean Peninsula was analysed based on four major forest types. High temporal-resolution satellite data can overcome limitations of ground-based phenological studies with reasonable spatial resolution. Moderate Resolution Imaging Spectroradiometer (MODIS) vegetation index (VI) (MOD13Q1 and MYD13Q1) and aerosol (MOD04_D3) data were downloaded from the USGS Earth Observation and Science (EROS) Data Center and NASA Goddard Space Flight Center. Harmonic analysis was used to describe and compare the periodic phenomena of the vegetative phenology and atmospheric aerosol optical thickness (AOT). The method transforms complex time-series to a sum of various sinusoidal functions, or harmonics. Each harmonic curve, or term (or Fourier time-series), from time-time-series data us defined by a unique amplitude and a phase, indicating the half of the height and the peak time of a curve. Therefore, the mean, phase, and amplitude of harmonic terms of the data provided the temporal relationships between AOT and VI time series. The phenological characteristics of evergreen forest, deciduous forest, and grassland were similar to each other, but the inter-annual VI amplitude of mixed forest was differentiated from the other forest types. Overall, forests with high VI amplitude reached their maximum greenness earlier, and the phase of VI, or the peak time of greenness, was significantly influenced by air temperature. AOT time-series showed strong seasonal and inter-annual variations. Generally, aerosol concentrations were peaked during late spring and early summer. However, inter-annual AOT variations did not have significant relationships with those of VI. Weak relationships between inter-annual AOT and VI variations indicate that the impacts of aerosols on vegetation growth may be limited for the temporal scale investigated in the region.
1. INTRODUCTION
Surface greenness dynamics are associated with the patterns of primary productivity and atmospheric carbon exchange rates on a broad scale (Field et al. 1995; Running et al. 2004; Potter et al. 2007). Vegetation responses to climate change appear strong in Northeast Asia, where diverse forest types and tree species in the region are considered as important carbon sinks. It is reported that Northeastern China and the Korean Peninsula experience significant changes of species composition in forested areas (Jiang et al. 1999). Since atmospheric aerosols play an important role in the interactions between solar radiation and the atmosphere, they are considered one of the key variables in climate modeling (Remer et al. 2005; Lee et al. 2009). The objective of this study is to determine the spatiotemporal influences of climatic factors and atmospheric aerosol on phenological cycles of the Korea Peninsular on a regional scale.
Systematic, continuous, broad-scaled vegetation monitoring requires satellite-based, remote sensing technologies. High temporal-resolution satellite data can overcome limitations of ground-based phenological studies with reasonable spatial resolution. One set of biophysical variables formulated from remote sensing data is vegetation indices (VI). These indices are defined as dimensionless, radiometric measures that have strong correlations with biophysical parameters of green vegetation, including leaf area index (LAI). The Moderate Resolution Imaging Spectroradiometer (MODIS), a hyperspectral earth-observing satellite sensor operated by the National Aeronautics and Space Administration (NASA), provides daily satellite coverage, and its VI data products are designed to provide
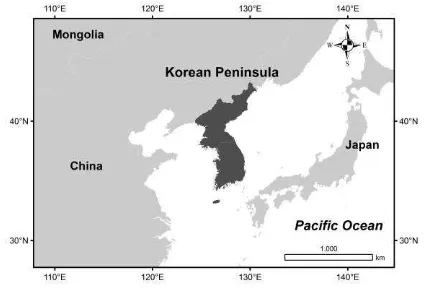
forest types of the region include boreal, temperate, and subtropical forests.
Figure 1. Study area.
2.2 Data Processing
Since MODIS provides both morning (Terra) and afternoon (Aqua) vegetation index products with high compatibility, the relatively new system is a valuable data source for environmental studies, including seasonal patterns of photosynthesis over large geographic areas (Running et al., 2004; Yang et al., 2005). MODIS 16-day composites VI data, MOD13Q1, were downloaded from the EROS data center for the 2001-2010 period (https://wist.echo.nasa.gov). Three image tiles (h27v04, h27v06, and h28v05) were mosaicked together to cover the entire Korea Peninsula with the spatial resolution of 250 meters. In total, 690 composite images were processed for cloud screening and only clear-sky pixels were used for further analyses.
Biophysical parameters, such as the fraction of photosynthetically active radiation absorbed by chloroplasts (fPAR) and leaf area index (LAI), have strong correlations with vegetation indices. In MODIS-based modeling of primary production, the Enhanced Difference Vegetation Index (EVI) has been common used. The algorithm of EVI was developed to improve its sensitivity to densely vegetated areas (Huete et al., 2002). This index incorporates the blue band (ρblue) into its formula for atmospheric correction, and has been applied to vegetation phenology studies:
EVI = 2.5 ⅹ(ρnir - ρred)/(ρnir + (6ⅹρred - 7.5ⅹρblue) + 1) In addition to MODIS VI data, aerosol products, MOD04, were analyzed to extract AOT over the study area. Land aerosol observations are based on near-infrared (2.1μm, 3.8μm) channels, which are relatively free from atmospheric interference, and the data are provided with the spatial resolution of 10km. With improved algorithms, their accuracy is known ±0.05±0.20AOT (Remer et al., 2005; Levy et al., 2007). Distributions of atmospheric aerosols are determined from a light extinction coefficient, which is the fraction of light that is scattered or absorbed by aerosol particles as a function of altitude (Wong et al., 2009). AOT is the sum of light extinction coefficients integrated over a vertical column, and it estimates the amount of aerosols for the whole atmospheric column (Kaufman et al., 1997; Remer et al., 2005).
Although greenness signals in forest ecosystems are complex, frequently acquired VI records allow researchers to extract and identify the fluctuations of canopy greenness (Huete et al. 2006; Xiao et al. 2005). Spectral analysis, or harmonic analysis, was
used to extract major periodic fluctuation signals, or wave forms from the temporal domain of the input data (Azzali and Menenti 2000; Jakubauskas et al. 2001; Moody and Johnson 2001; Park 2009). Any complex raw data collected on a regular basis, such as VI time-series, can be reduced to a series of harmonic terms that have a unique set of amplitude, wavelength, and phase angle (Figure 2). Annual and inter-annual variations and peak points of greenness and AOT signals were analyzed by the technique. Four major forest types, mixed forest, evergreen forest, deciduous forest, and grassland, were selected from ESA GlobCover landuse data (Sophie et al. 2010), and their primary phonological cycles were extracted from the VI time-series. Monthly minimum, maximum, and mean temperatures at 90 weather stations, where no missing data were found during the study period, were collected from NOAA and Korea Meteorological Agency. Spectral analysis was also applied to these data to determine their annual variations.
Figure 2. Main components of harmonic analysis (a), and a schematic illustration of the first three harmonic terms, 1st, 2nd, and 3rd terms (b). Principal seasonality of mid-latitude regions is
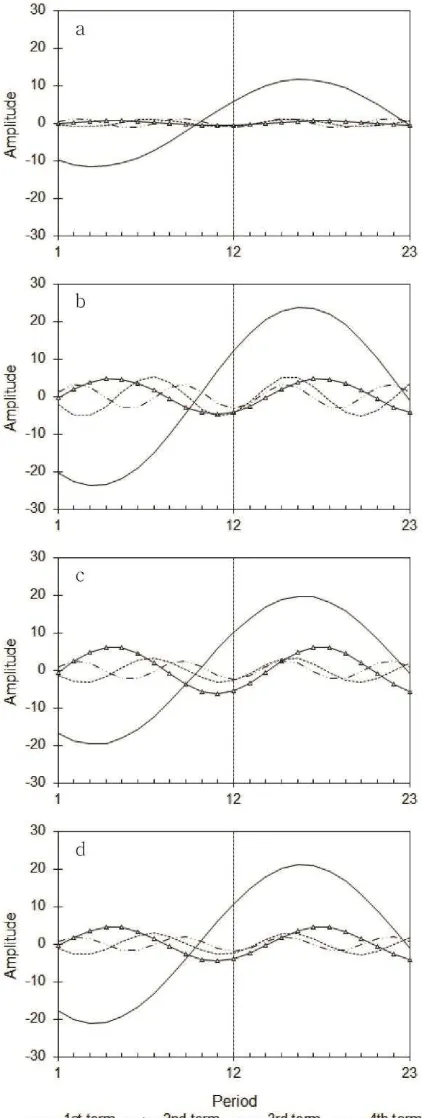
Figure 3. Harmonic patterns for the 4 land cover types (a-mixed forest, b-deciduous forest, c-evergreen forest, d-grassland).
3. SUMMARY OF RESULTS
Study results showed that phenological characteristics were similar among evergreen forest, deciduous forest, and grassland, while the inter-annual VI amplitude of mixed forest was differentiated from the other forest types (Figure 3). The VI amplitude indicates the degree of greenness fluctuations over
the year, and it was greatest for deciduous forest followed by grassland, evergreen forest, and mixed forest. Vegetation types with high VI amplitude reached their maximum VI values, but this relationship was not observed within the same forest type. The phase of VI, or the peak time of greenness, was significantly influenced by air temperature (r=0.61~0.79). The earlier the peak air temperature, the earlier the greenness peak time. It is likely that the growth of mountain forests is typically limited by temperature throughout the Korean peninsula, where deciduous and evergreen forests dominate. However, influences of mountain elevation and aspect on forest growth should be further investigated. The pace of forest growth is important with respect to the regional climate. Recent studies showed that earlier vegetation growth had increased evapotranspiration and its cooling effect had taken place in the spring season (Jeong et al., 2009a; Jeong et al., 2009b).
AOT time-series showed strong seasonal and inter-annual variations. Generally, aerosol concentrations were highest from late spring to early summer. However, inter-annual AOT variations did not have significant relationships with those of VIs. Aerosol concentrations in the peninsula are strongly associated with industrialization in the Eastern China as well as domestic wild fires and man-made aerosol emission (Li et al., 2007). Annual variations of AOT, or amplitude, had only weak correlations with surface greenness. The phase of AOT had weak negative correlations with surface greenness (r=-0.43~-0.67). VI peak values were observed later over the year as AOT concentrations reached earlier in spring, Pixel-based, high resolution research is still required to determine the influences of the characteristics of aerosols (sources, spatial distributions, etc.) on the vegetation phenology in the region.
4. CONCLUDING REMARKS
It is apparent that AOT time-series has a strong seasonality and geographically uneven distributions in the Korean Peninsula (Kim et al., 2007; Park, 2014). Unfortunately, long-term monitoring of the natural and anthropogenic aerosols is still technically limited due to the lack of continuous atmospheric data over the country. Since intense urbanization and industrialization in the eastern China and Korean Peninsula had direct and sensitive impacts on the atmospheric quality of the region from ecological, public health, and socioeconomic perspectives, broad-scaled, satellite-based atmospheric monitoring should be systematically practiced to overcome limitations of ground-based observations of atmospheric aerosols. AOT observations, a quantitative measure of the atmospheric quality, had significant geographical variations in the region. Particularly, the maximums of monthly AOT means showed 1.9-fold to 3.2-fold variations across the peninsula. AOT measurements were apparently higher in western regions than eastern regions, indicating the strong effects of atmospheric effluents from China. Therefore, in addition to forest types, geographical characteristics should be considered as an important factor when it comes to the impacts of AOT on the vegetation phenology.
ACKNOWLEDGEMENTS
REFERENCES
Azzali, S. and Menenti, M., 2000. Mapping vegetation-soil-climate complexes in southern Africa using temporal Fourier analysis using NOAA-AVHRR-NDVI data. International Journal of Remote Sensing, 21, pp. 973-996.
Field, C.B., Behrenfeld, M.J., Randerson, J.T., and Falkowski, P., 1998. Primary production of the biosphere: integrating terrestrial and oceanic components. Science, 281, pp. 237-240.
Holben, B.N., Eck, T.F., Slutsker, I., Tanre, D., Buis, J.P., Setzer, A., Vermote, E., Reagan, J.A., Kaufman, Y.J., Nakajima, T., Lavenu, F., Jankowiak, I., and Smirnov, A., 1998. AERONET-a federated instrument network and data archive for aerosol characterization. Remote Sensing of Environment, 66, pp. 1-16.
Huete, A.R., Didan, K, Shimabukuro, Y.E., Ratana, P., Saleska, S.R., Hutyra, L.R., Yang, W., Nemani, R.R., and Myneni, R., 2006. Amazon rainforests green-up with sunlight in dry season. Geophysical Research Letters 33, L06405, DOI:10.1029/2005GL025583.
Jakubauskas, M.E., Legates, D.R., and Kastens, J.H., 2001. Harmonic analysis of time-series AVHRR NDVI data. Photogrammetric Engineering and Remote Sensing, 67, pp. 461-470.
Jeong, S.-J., Ho, C.-H., and Jeong, J.-H., 2009a. Increase in vegetation greenness and decrease in springtime warming over East Asia. Geophysical Research Letters, 36, L02710, doi:10.1029/2008GL036283.
Jeong, S.-J., Ho, C.-H., Kim, K.-Y., and Jeong, J.-H., 2009b. Reduction of spring warming over East Asia associated with vegetation feedback. Geophysical Research Letters, 36, L18705, doi:10.1029/2009GL039114.
Jiang, H., Apps, M.J., Zhang, Y., Peng, C. and Woodard, P., 1999. Modelling the spatial pattern of net primary productivity in Chinese forests. Ecological Modeling, 122, pp.275-288.
Justice, C.O., Vermote, E., Townshend, J.R.G., Defries, R., Roy, D.P., Hall, D.K., Salomonson, V.V., Privette, J.L., Riggs, G., Strahler, A., Lucht, W., Myneni, R.B., Knyazikhin, Y., Running, S.W., Nemani, R.R., Wan, Z., Huete, A.R., van Leeuwen, W., Wolfe, R.E., Giglio, L., Muller, J.P., Lewis, P., and Barnsley, M.J., 1998. The Moderate Resolution Imaging Spectroradiometer (MODIS): land remote sensing for global change research. IEEE Transactions on Geoscience and Remote Sensing, 36, pp.1228–1249.
Kaufman, Y.J., Tanré, D., Remer, L., Vermote, E.F., Chu, A., and Holben, B.N., 1997. Operational remote sensing of troposphere aerosol over land from EOS Moderate Resolution Imaging Spectroradiometer. Journal of Geophysical Research, 102, pp. 17051-17067.
Kaufman, Y., Tanre, D., and Boucher, O., 2002. A satellite view of aerosols in the climate system. Nature, 419, pp. 215-223.
Kim, S.W., Yoon, S.C., Kim, J., Kim, S.Y., 2007. Seasonal and monthly variations of columnar aerosol optical properties over East Asia determined from multi-year MODIS, Lidar, and
AERONET sun/sky radiometer measurements. Atmospheric Environment, 41, pp.1634-1651.
Lee, K., Li, Z., Kim, Y., and Kokhanovsky, A., 2009. Atmospheric aerosol monitoring from satellite observations: a history of three decades. In: Kim, Y., Platt, U., Gu, M., and Iwahashi, H., 2009. Atmospheric and Biological Environmental Monitoring DOI 10.1007/978-1-4020-9674-7_2, pp.13-38. Springer.
Levy, R.C., Remer, L., Mattoo, S., Vermote, E., and Kaufman, Y.J., 2007. A second-generation algorithm for retrieving aerosol properties over land from MODIS spectral reflectance. Journal of Geophysical Research, 124, pp.2046-2070.
Li, Z., Niu, F., Lee, K. H., Xin, J., Hao, W. M., Nordgren, B., Wang, Y., and Wang, P., 2007. Validation and understanding of Moderate Resolution Imaging Spectroradiometer aerosol products (C5) using ground-based measurements from the handheld Sun photometer network in China. Journal of
Geophysical Research, 11, D22S07,
doi:10.1029/2007JD008479.
Moody, A. and Johnson, D.M., 2001. Land-surface phenologies from AVHRR using the discrete Fourier transform. Remote Sensing of Environment, 75, pp.305-323.
Park, S., 2009. Synchronicity between satellite-measured leaf phenology and rainfall regime in Hawaiian tropical forests. Photogrammetric Engineering and Remote Sensing, 75, pp.1231-1237. MODIS satellite data and ecosystem modeling. Earth Interactions, 11.
Remer, L.A., Kaufman, Y.J., Tanre, D., Mattoo, S., Chu, D.A., Martins, J.V., Li, R.R., Ichoku, C., Levy, R., Kleidman, R.G., Eck, T.F., Vermote, E., and Holben, B.N., 2005. The MODIS aerosol algorithm, products and validation. Journal of Atmospheric Sciences, 62, pp. 947-973.
Remer, L.A., Tanre, D., Kaufman, Y.J., Ichoku, C., Mattoo, S., Levy, R., Chu, D.A., Holben, B.N., Dubovik, O., Smirnov, A., Martins, J.V., Li, R.R., and Ahmad, Z., 2002. Validation of MODIS aerosol retrieval over ocean. Geophysical Research Letters, 29, pp.321-324.
Running, S.W., Nemani, R.R., Heinsch, F.A., Zhao, M., Reeves, M., and Hashimoto, H., 2004. A continuous satellite-derived measure of global terrestrial primary production. BioScience, 54, pp.547-560.
Sophie, B., Pierre, D., and Eric, V.B., 2010. GLOBCOVER 2009, Products Description and Validation Report, ESA.
Wong, M.S., Nichol, J.E., and Lee, K.H., 2009. Modeling of aerosol vertical profiles using GIS and remote sensing. Sensors, 9, pp. 4380-4389.
2005. Satellite-based modeling of gross primary production in a seasonally moist tropical evergreen forest. Remote Sensing of Environment, 94, pp.105-122.
Yang, W., Shabanov, N.V., Huang, D., Wang, W., Dickinson, R.E., Nemani, R.R., Knyazikhin, Y., and Myneni, R.B., 2006. Analysis of leaf area index products from combination of MODIS Terra and Aqua data. Remote Sensing of Environment, 104, pp.297-312.