COMPARISON OF TANDEM-X INSAR AND TERRASAR-X
STEREO-RADARGRAMMETRIC 3D METRICS IN MAPPING OF FOREST RESOURCES
K. Karila a, *, M. Karjalainen a, X. Yu a, M. Vastaranta b, M. Holopainen b, J. Hyyppä a a
FGI, Remote Sensing and Photogrammetry, 02430 Masala, Finland - (kirsi.karila, mika.karjalainen, xiaowei.yu, juha.hyyppa)@nls.fi
b
University of Helsinki, Finland – (mikko.vastaranta, markus.holopainen)@helsinki.fi
KEY WORDS: Interferometry, Stereo, Radargrammetry, Forest, TanDEM-X, TerraSAR-X, Airborne Laser Scanning
ABSTRACT:
Accurate forest resources maps are needed in diverse applications ranging from the local forest management to the global climate change research. In particular, it is important to have tools to map changes in forest resources, which helps us to understand the significance of the forest biomass changes in the global carbon cycle. In the task of mapping changes in forest resources for wide areas, Earth Observing satellites could play the key role. In 2013, an EU/FP7-Space funded project “Advanced_SAR” was started with the main objective to develop novel forest resources mapping methods based on the fusion of satellite based 3D measurements and in-situ field measurements of forests. During the summer 2014, an extensive field surveying campaign was carried out in the Evo test site, Southern Finland. Forest inventory attributes of mean tree height, basal area, mean stem diameter, stem volume, and biomass, were determined for 91 test plots having the size of 32 by 32 meters (1024 m2). Simultaneously, a comprehensive set of satellite and airborne data was collected. Satellite data also included a set of TanDEM-X (TDX) and TerraSAR-X (TSX) X-band synthetic aperture radar (SAR) images, suitable for interferometric and stereo-radargrammetric processing to extract 3D elevation data representing the forest canopy. In the present study, we compared the accuracy of TDX InSAR and TSX stereo-radargrammetric derived 3D metrics in forest inventory attribute prediction. First, 3D data were extracted from TDX and TSX images. Then, 3D data were processed as elevations above the ground surface (forest canopy height values) using an accurate Digital Terrain Model (DTM) based on airborne laser scanning survey. Finally, 3D metrics were calculated from the canopy height values for each test plot and the 3D metrics were compared with the field reference data. The Random Forest method was used in the forest inventory attributes prediction. Based on the results InSAR showed slightly better performance in forest attribute (i.e. mean tree height, basal area, mean stem diameter, stem volume, and biomass) prediction than stereo-radargrammetry. The results were 20.1% and 28.6% in relative root mean square error (RMSE) for biomass prediction, for TDX and TSX respectively.
* Corresponding author.
1. INTRODUCTION
1.1 Remote Sensing in mapping forest resources
The amount of forest Above Ground Biomass (AGB) is under of intense international discussion related to the global climate change and carbon cycle. In order to contribute this discussion, as the remote sensing scientific community, we need to find techniques to measure AGB effectively and accurately for wide areas. On the one hand, the use of Airborne Laser Scanning (ALS) data in measuring forest resources has been a success story and has undergone though a commercial breakthrough globally (Hyyppä et al., 2008). On the other hand, there is still need for wide-area forest resources maps and in this scope satellite data is expected to play a very important role (Houghton et al., 2009). In any case, the way forward appears to be the capability to measure tree heights accurately, as the tree height is the most important single parameters to predict AGB. Similar to ALS, but nearly globally, very promising results have been obtained using a spaceborne lidar onboard the ICESat satellite by the NASA (Lefsky et al., 2005, Simard et al., 2011). However, to our understanding, there is no clear verdict about the future spaceborne lidars at the moment. Alternative techniques to lidars exist, and there are examples on the use of stereo-photogrammetry (both airborne and spaceborne) and imaging radars in mapping of forests. The advantage of imaging
radar is its ability to acquire images though clouds (as microwaves penetrate clouds), which might enable more frequent mapping compared to remote sensing techniques using the optical region of the Electro-Magnetic spectrum. Until now, radar based forest maps have been somewhat deficient as the amplitude of the radar signal tends to saturate at same level of AGB, and higher biomasses than the saturation level cannot be measured (Fransson and Israelsson, 1999, Holopainen et al., 2010, Kaasalainen et al., 2015). Recently, more attention has been paid on determination of forest biomass by radar imaging via canopy height information (i.e., 3D techniques) similarly to laser scanning. Scientific studies in the past couple of years have shown that elevation information extracted from satellite SAR data (Synthetic Aperture Radar) have potential in estimation of forest canopy height even close to accuracy of ALS data, under the assumption that the elevation model of the underlying terrain is known (e.g. Solberg et al., 2013, Solberg et al., 2014, Karjalainen et al., 2012).
1.2 SAR based 3D techniques for forest mapping
InSAR makes use of two complex SAR images, which are acquired from slightly different perspectives and pixel-by-pixel phase differences are converted into elevation differences of the terrain. Typical geometrical baselines in InSAR are in order of few hundreds of meters. For the purposes of elevation data extraction, InSAR data should be acquired simultaneously, which is especially important in the case of forested areas. Non-simultaneous InSAR acquisitions cause temporal decorrelation of data, and consequently low-quality elevation data. Elevation values in the forested areas depend on the characteristics of forest canopy, but also on the wavelength of the used SAR system. For example, when the X or C band radars are considered, the scattering takes place near the top of the forest canopy (Le Toan et al., 1992). Kellndorfer et al. (2004) used C band InSAR data from the Shuttle Radar Topography Mission (SRTM) to estimate the forest canopy height. SRTM mission was based on simultaneous InSAR data acquisition and aimed for creating nearly global digital elevation models. Similar results using the SRTM X-band data were presented by Solberg et al. (2010), who also estimated the above-ground biomass based on SRTM elevation values. Therefore, if the elevation of the ground surface is known, X or C-band InSAR heights can be directly related to the forest canopy height and accordingly to the stem volume. After the SRTM mission, the next simultaneous InSAR system has been the German TanDEM-X mission (TDX), which launched in 2010. TDX consists of two identical satellites flying in close formation enabling bistatic acquisition of X-band SAR data suitable for elevation data extraction. Recent studies (Solberg et al., 2013, Solberg et al., 2014, Karila et al., 2015, Soja et al., 2015) have already demonstrated the successful use of TDX in estimation of forest biomass in the Boreal forest zone.
Stereo-radargrammetry is an alternative approach to extract elevation data from radar data. This technique is based on stereoscopic measurement of radar images analogous to photogrammetric spatial intersection of aerial frame images. Using a pair of radar images with suitable intersection angle, 3D coordinates can be directly calculated for corresponding points on the image pair. Compared to InSAR pairs, geometric baselines are much longer, typically in order of hundreds of kilometres for spaceborne SAR images. The foundations for the stereo-viewing capabilities of radar images were recognized already in the 1960s; however, automatic processing of stereo data has become possible in the past couple of decades. To our understanding, the first SAR satellite system to provide images with variable off-nadir angles suitable for stereo-radargrammetric processing was the Canadian Radarsat-1 satellite. New opening of satellite stereo-radargrammetry was started with the launch of the German TerraSAR-X (TSX) SAR satellite in 2007. At its best, TSX has the spatial resolution of about one meter. In addition, the geolocation accuracy of image data is consistently in order of one meter. These advances have enabled automatic processing of TSX stereo images into elevation models. Even though the quality and the accuracy of TSX 3D data tends to be slightly lower that in TDX InSAR elevation models, the extracted elevation contain information about forest canopy height as well. First studies for forest attribute prediction were presented by Karjalainen et al. (2012) and Persson and Fransson (2014), and they have revealed that there is potential in stereo-radargrammetric 3D data in forest biomass estimation.
1.3 Objectives
The main objective of this study is to compare the accuracy of InSAR and stereo-radargrammetry 3D metrics in forest inventory attribute prediction using X-band SAR satellite data from TSX and TDX satellites. The use of SAR derived 3D metrics in forest attributes estimation is relatively new approach and became truly possible with the launch of the TSX and TDX satellites. Even though similar studies were carried out with SRTM InSAR data, at the same time, there were no SAR data available for stereo-radargrammetry. First results of the use of TSX and TDX based 3D data in forest mapping have been presented in test sites in Finland, Sweden, and Norway. However, to our understanding there is only one accuracy comparison of InSAR and stereo-radargrammetric techniques by Rahlf et al. (2014). Based on their results TDX InSAR turned out to be slightly more accurate than TSX stereo-radargrammetry, relative RSMEs in prediction error being 42% 44% respectively for TDX and TSX. Therefore, the additional aim of the present study is to compare the results by Rahlf et al. (2014) to our test site in Finland.
2. MATERIALS
2.1 Test site
The aim was to have all data from the same area, and furthermore to collect all data from satellite images to field surveys within one season in summer 2014 in order to avoid any problems with forest cover changes in the area. Our test site is located in Evo, Southern Finland (61.19ºN, 25.11ºE), and approximately 100 km North of Helsinki. The area belongs to the southern Boreal Forest Zone and comprises approximately 2000 ha of managed forest (test site covers an area of 4 km x 6 km). Evo is also a popular recreation area, which distinguishes it from other entirely homogenous managed forests, and represents a range of stand conditions from natural to intensively managed southern boreal forests. Stands are mainly even-aged and single layer, with an average stand size of slightly less than 1 ha. The elevation of the area varies from 125 m to 185 m above sea level. Scots pine (Pinus sylvestris, L.) and Norway spruce (Picea Abies (L.) H. Karst.) are the dominant tree species in the study area, contributing 44.7% and 33.5% of the total volume, respectively. The percentage of deciduous trees is 21.8% of the total volume. The site quality varies from groves to barren heaths.
2.2 Reference data
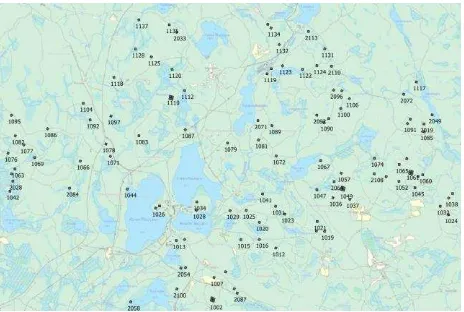
Field measurement campaign was carried out in the Evo area during the summer 2014. The sampling of the field plots (size of 32m by 32m, which equals to 1024m2) was based on airborne laser scanning (ALS) data derived forest height and canopy density metrics. First, systematic grid (32m) was placed over the area and ALS metrics describing forest height and density were calculated for each grid cell. The derived ALS metrics were mean height of vegetation calculated from the canopy height model (CHM) and vegetation density at a height of 2 meters. Altogether, 120 sample plots were then selected with varying canopy heights and densities. The terrestrial laser scanner (TLS) was used to scan sample plots (1024 m2) and to obtain tree maps. TLS data from each sample plot from five scanner locations obtained dense point cloud covering the entire plot. One scanning location was in the centre of the plot and four were on ordinal directions. We georeferenced TLS data to local and global coordinate systems using reference targets, GNSS, and total station measurements. Then we handled TLS point clouds to create tree maps for sample plots. Our purpose was to provide preliminary tree maps for further measurements. Field crews checked that all trees in a sample plot were also on the tree map. When a tree was missing, its location was mapped and added to the tree map. All incorrect trees were deleted from the tree map. After mapping the trees, we determined their attributes, such as species, diameter-at-breast-height (dbh) and height. Calipers and electronic hypsometer (Haglöf Vertex) were used for dbh and height measurements. Stick with height of 1.3 m was used for consistent determination of the right height in the dbh measurements. Dbh was defined as the mean value of two perpendicular measurements. Field crews were able to measure 91 sample plots (Figure 1) during the four months field campaign covering wide range of different forest conditions. We used all of these 91 plots in this study. The statistics of the forest inventory attributes measured from the field plots are shown in Table 1.
BA,
Table 1. Statistics of the forest plots used in the study. BA=Basal Area, Dg=mean diameter at breast height, Hg=mean
tree height, V=stem volume.
2.3 Satellite SAR data
We used TSX and TDX data, which were acquired from the DLR through two scientific AO projects. TSX and TDX consist of two identical satellites operating at the X-band microwave region (wavelength of 3.1 cm). The term of TSX typically refers to the use of either of the satellites in the monostatic image acquisition. On the other hand, TDX refers to the use of both satellites in the bistatic imaging mode (one being a transmitting system, and both being in the receiving mode). In 2014, satellites were orbiting in a close formation; therefore, TDX data was collected simultaneously system, which is particularly suitable for creating Digital Elevation Models (DEM).
The basic information about the TDX image pair is given in Table 2. Unfortunately, there was only one TDX data
acquisition available in summer 2014. TDX acquisition was made in the Stripmap imaging mode, which corresponds to the resolution of 2.4 m in ground range and 3.3 m in azimuth direction. The interferometric baseline of this pair was 190 m, which equals to the height-of-ambiguity of 45 m. The image was acquired using HH polarization.
Date Incidence angle Time (UTC) Weather
5.6.2014 48° 16:03 26°C clear
Table 2. TDX image pair used in the study. Image data were acquired from the ascending orbit.
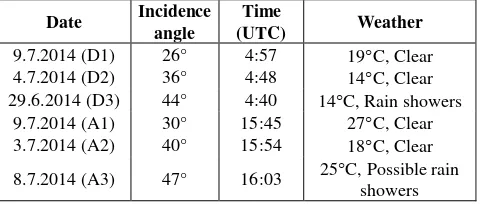
The TSX images used in the study are listed in Table 3. All TSX images were ordered as Multi-look Ground Range Detected (MGD) products, in HH polarization and in the Spotlight imaging mode. The approximate spatial resolution of TSX Spotlight data is around one meter. Our aim was obtain TSX images within as short time period as possible, in addition to variable look angles and from both direction. Altogether, we received six TSX images within ten days, creating six stereo pairs, three from ascending orbits and three from the descending orbits. The weather in Finland in early June 2014 was relative stable and clear; however, some minor rain showers might have occurred in some of the images.
Date Incidence
Table 3. List of TSX data. Images D1-D3 are from descending orbit and A1-A3 from ascending orbit.
3. METHODS
3.1 InSAR processing
3.2 Stereo-radargrammetric processing
There are a few commercial software packages available for automatic image matching suitable for stereo-radargrammetric processing. In the present study, we used the Socet Set photogrammetric workstation (v 5.6). The process of extracting 3D points from the stereo pairs was the following. First, TSX images were imported into the Socet Set workstation. In the importing phase, Socet Set reads the orbit data accompanied with the data products and uses the orbit data in geolocation of the images to the map coordinated system. Finnish map coordinate system (ETRS-TM35FIN) and the ellipsoidal height system of GRS80 were used. The Finnish ETRS-TM35FIN system is virtually the same as the global UTM35N-WGS84 coordinate system. We also checked the geolocation accuracy of the TSX images visually using existing topographic data, Airborne Laser Scanning based Digital Terrain Model (grid size of 2 meters) and orthoimage from digital aerial images. Based on the visual inspection, the geolocation accuracy of input SAR data was in order of meter or below. Therefore, refinement of the geolocation parameters was not needed. The automatic matching of image pairs and the calculation of 3D points was carried out using the NGATE (Next Generation Automatic Terrain Extraction) module of the Socet Set workstation. Basically, the process is fully automatic and the user can only change a couple of parameters related to the matching algorithm. The main parameters are to control the number and accuracy of the resulting 3D points (successfully matched points between images). The acceptance threshold of the cross-correlation value in the matching phase can be changed. When the threshold value gets lower, more 3D points will exist in the results. However, at the same time the number of incorrect matches increases. In general, there is no clear rule for setting the threshold value, in this study the best results in terms of accuracy and point density were obtained using correlation values between 50 and 70 (range is 0-100). The result of the NGATE process is a set of 3D points, i.e., successfully matched and measured points between images. 3D points (point cloud) are exported into a text file for further processing. Additional steps for the point cloud: 1) Converting vertical reference from ellipsoidal height to height above geoid (mean sea level). In the case of Evo area, this offset is approximately 18.5 meters according to the Finnish geoid model. 2) Merging point cloud derived from different stereo pairs into a single file. Gross errors due to mismatching were removed by delete the points with height greater than 2 times the deviation above the mean.
3.3 Estimation of forest variables
Point clouds from both TDX and TSX data were normalized by removing ground elevation from the point height at corresponding location and produced a normalized point cloud. Ground elevation was created from airborne laser scanning data from the same year. Various plot metrics were calculated from the normalized point cloud for plots of 32m x 32 m in size. They are maximum height, mean height, standard deviation of the height and coefficient of variation as well as 10% to 90% percentiles of height distribution with 10% increment. Altogether, 13 metrics were calculated.
Plot forest attributes, e.g. mean height, mean DBH, basal area, volume and biomass, were predicted based on point cloud derived metrics and field measurements using area-based approach and random forests (RF) technique (Hyyppä et al. 2008; Yu et al. 2011). RF is a non-parametric regression algorithm, which is consisted of a collection of decision trees
(Breiman 2001). RF has been successfully used for predicting forest attributes (Hudak et al. 2008, Yu et al. 2011).
In order to evaluate the performance of two 3D SAR data source for predicting plot attributes the accuracy of the predicted plot attributes was evaluated by comparing the predicted to reference values. Bias and root mean squared error (RMSE) between the predicted and observed values were calculated and used as a measure for error estimates and the correlation coefficient (R) as a measure for the goodness of fit of the model.
4. RESULTS
4.1 Comparison of TDX InSAR and TSX stereo-radargrammetric 3D metrics and elevation data
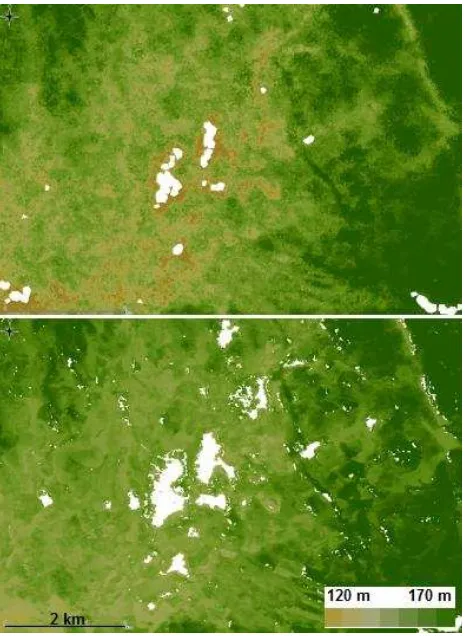
The TSX and TDX DSMs before the terrain height was removed are presented in Figure 2. There are gaps in the data due to lakes and slopes.
Figure 2. TSX DSM (top) and TDX DSM (bottom). The terrain height is included in the values. No data areas are white.
TDX InSAR: average
(min-max) m
TSX stereo: average
(min-max) m
TSX - TDX average (m)
max_H 19.1 (6.3-38.7) 22.7 (12.4-35.8) 3.6
mean_H 14.4 (4.3-31.9) 13.4 (7.1-24.0) -1.0
std_H 2.5 (0.8-6.9) 4.7 (2.4-7.7) 2.2 Table 4. A comparison of plot tree height statistics from TDX
and TSX data.
Figure 3. Plot mean height from TSX data vs. plot mean heights from TDX data.Line in the figure is one-to-one line.
4.2 TDX InSAR results
Table 5 shows a summary of the results, i.e., accuracy statistics for prediction of plot mean height, mean DBH, basal area, volume and above ground biomass from TDX 3D metrics.
Bias Bias
(%) RMSE
RMSE (%) R
Mean height (m) 0.03 0.14 2.02 9.56 0.89 Mean DBH (cm) -0.05 -0.20 4.87 18.88 0.76 Basal area (m2/ha) -0.01 -0.04 5.51 20.57 0.71 Volume (m3/ha) 0.08 0.03 57.53 21.30 0.85 Biomass (Mg/ha) -0.80 -0.60 26.96 20.05 0.83 Table 5. Summary of results using TDX InSAR 3D metrics.
The prediction accuracy results are clearly better when compared to our previous study in summer 2013 in the same area using TDX InSAR data (Karila et al., 2015). The relative RMSE for mean tree height reduced from 20% to 10%., basal area from 29% to 21%, and volume from 32% to 21%. In summer 2013, we used circular plots with the radius of 9 m (254 m2) compared to 32 by 32 m plots in this study. The increase in prediction accuracy is caused by larger plots used (Frazer et al. 2011). In addition, in the previous study 5 TDX InSAR pairs were compared and the variation in the prediction accuracy was found relatively small, at maximum 5%. Therefore, a single TDX pair can be used to get rather reliable results.
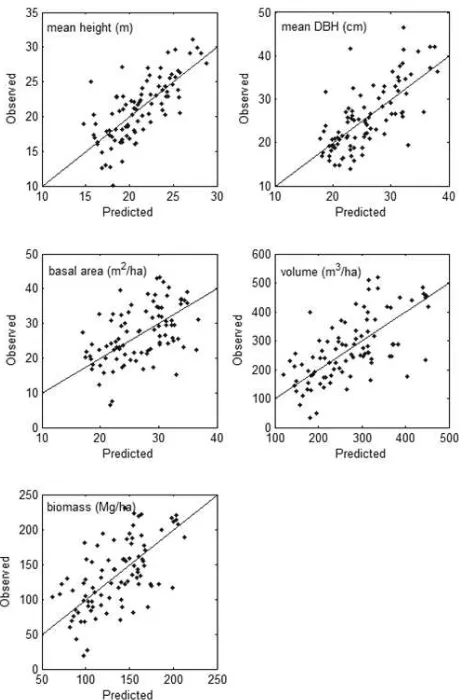
The predicted forest inventory attributes are plotted against the observed values in Figure 4. Using TDX 3D metrics, the relative RMSE for mean tree height prediction is considerably lower (10%) than for the rest of the attributes (around 20%). This means that the TDX based height is well correlated with the mean plot height.
Figure 4. Scatter plot of predicted value versus observed value for TDX data. Line in the figure is one-to-one line.
4.3 TSX stereo-radargrammetric results
Table 6 shows a summary of the accuracy statistics for estimation of plot mean height, mean DBH, basal area, volume and above ground biomass from TSX 3D metrics.
Bias Bias
(%) RMSE
RMSE (%) R
Mean height (m) -0.01 -0.07 2.97 14.09 0.74 Mean DBH (cm) 0.02 0.09 5.18 20.11 0.72 Basal area (m2/ha) -0.04 -0.14 6.87 25.64 0.50 Volume (m3/ha) 0.55 0.20 84.55 31.30 0.65 Biomass (Mg/ha) 0.26 0.19 38.40 28.55 0.61 Table 6. Summary of results using TSX stereo 3D metrics.
The TSX results are similar to accuracies obtained in a previous study (Karjalainen et al. 2012). For another test site using the same method relative RMSEs were for stem volume 34%, for basal area 29%, for mean height 14%, and for mean DBH 20%.
measurement of single pixels and thus more prone to errors and higher deviation of height values.
The predicted forest attributes are plotted against the observed values in Figure 5.
Figure 5. Scatter plot of predicted value versus observed value for TSX data. Line in the figure is one-to-one line.
5. CONCLUSIONS
TDX and TSX data and field data were acquired simultaneously during summer 2014. Using TDX InSAR data the prediction accuracy of all forest attributes was better than when the TSX stereo-radargrammetric height data is used.
In a previous study by Rahlf et al. (2014) timber volume was estimated using TSX and TDX StripMap imagery. Based on their results TDX InSAR turned out to be slightly more accurate than TSX stereo-radargrammetry. Relative RMSEs in prediction error were at plot level (250 m2 circular plots) 41.6% for InSAR and for 44.4% stereo. At stand level (1-3 ha) relative RMSE for InSAR was 18.1% and 23.3% for stereo. In our case the plot size was 1024 m2 (0.1 ha) and relative RMSE for stem volume was 21.3% for InSAR and 31.3% for stereo. As the plot size has a significant effect on the prediction accuracy, we can conclude that our results are in line of earlier results and findings of the previous study.
Both automatic SAR processing techniques of X-band data enable forest inventories of large areas when a digital terrain
model is available. At the moment spaceborne single-pass interferometric data is available only from the TanDEM-X mission. When single-pass interferometric data is not available, X-band stereo-data can be used to map forest resources.
Future studies will include a comparison of 3D SAR data to other 3D techniques and 2D techniques in the Evo test site. Also, a comparison of individual stereo pairs will be carried out.
ACKNOWLEDGEMENTS
The TanDEM-X and TerraSAR-X data were provided by the DLR through the DLR scientific projects, XTI_VEGE0360 and LAN2292. Research by Kirsi Karila has been supported by the Dragon3 young scientist project “Forest canopy height models from radargrammetric and interferometric SAR processing”, ESA contract NO. 4000109483/13/I-BG. The research leading to these results has received funding from the European Community’s Seventh Framework Programme ([FP7/2007– 2013]) under grant agreement No. 606971. The Academy of Finland is acknowledged for its support in the form of the project “Centre of Excellence in Laser Scanning Research (CoE-LaSR)”.
REFERENCES
Breiman, L., 2001. Random Forests, Machine Learning, Vol. 45(1), pp. 5–32.
Fransson, J.E.S., Israelsson, H., 1999. Estimation of stem volume in boreal forests using ERS-1 C- and JERS-1 L-band SAR data, International Journal of Remote Sensing, Vol. 20(1), pp. 123–137.
Frazer G., Magnussen S., Wulder M., Niemann K., 2011. Simulated impact of sample plot size and co-registration error on the accuracy and uncertainty of LiDAR-derived estimates of forest stand biomass, Remote Sensing of Environment, Vol. 115(2), pp. 636–649.
Holopainen, M., Haapanen, E., Karjalainen, M., Vastaranta, M., Hyyppä, J., Yu, X., Tuominen S., and Hyyppä, H., 2010. Comparing Accuracy of Airborne Laser Scanning and TerraSAR-X Radar Images in the Estimation of Plot-Level Forest Variables, Remote Sensing, Vol. 2(2), pp. 432-445.
Houghton, R.A., Hall, F., Goetz, S.J., 2009. Importance of biomass in the global carbon cycle. Journal of Geophysical Research: Biogeosciences, Vol. 114(G00E03).
Hudak, A.T., Crookston, N.L., Evans, J.S., Hall, D.E., Falkowski, M.J., 2008. Nearest neighbour imputation of species-level, plot-scale forest structure attributes from LiDAR data, Remote Sensing of Environment, Vol. 112(5), pp. 2232– 2245.
Hyyppä, J., Hyyppä, H., Leckie, D., Gougeon. F., Yu, X., and Maltamo, M., 2008. Review of Methods of small-footprint airborne laser scanning for extracting forest inventory data in boreal forests, International Journal of Remote Sensing, Vol. 29(5), pp. 1339-1366.
Lidar and Synthetic Aperture Radar Data to Estimate Forest Biomass: Status and Prospects, Forests, Vol. 6(1), pp. 252-270.
Karila, K., Vastaranta, M., Karjalainen, M., Kaasalainen, S., 2015. Tandem-X interferometry in the prediction of forest inventory attributes in managed boreal forests, Remote Sensing of Environment, Vol. 159, pp. 259–268
Karjalainen, M., Kankare, V., Vastaranta, M., Holopainen, M., Hyyppä, J., 2012. Prediction of plot-level forest variables using TerraSAR-X stereo SAR data. Remote Sensing of Environment, Vo. 117, pp. 338–347.
Kellndorfer, J., Walker, W., Pierce, L., Dobson, C., Fites, J. A., Hunsaker, C., 2004. Vegetation height estimation from Shuttle Radar Topography Mission and National Elevation Datasets, Remote Sensing of Environment, Vol. 93(3), pp. 339–358.
Lefsky, M. A., Harding, D. J., Keller, M., Cohen, W. B., Carabajal, C. C., Del Bom Espirito‐Santo, F. B., Hunter, M. O., Oliveira, R.., 2005. Estimates of forest canopy height and aboveground biomass using ICESat, Geophysical Research Letters, Vol. 32(L22S02).
Le Toan, T., Beaudoin, A., Riom, J., and Guyon, D., 1992. Relating Forest Biomass to SAR Data. IEEE Transactions on Geoscience and Remote Sensing, Vol. 30(2), pp. 403-411.
Persson, H., Fransson, J.E., 2014. Forest Variable Estimation Using Radargrammetric Processing of TerraSAR-X Images in Boreal Forests, Remote Sensing, Vol. 6(3), pp. 2084-2107.
Rahlf, J., Breidenbach, J., Solberg, S., Næsset, E., Astrup, R., 2014. Comparison of four types of 3D data for timber volume estimation, Remote Sensing of Environment. Vol. 155, pp. 325–333
Simard, M., Pinto, N., Fisher, J. B., Baccini, A., 2011. Mapping forest canopy height globally with spaceborne lidar, Journal of Geophysical Research: Biogeosciences, Vol. 116(G04021).
Solberg, S., Astrup, R., Bollandsås, O.M., Næsset, E., & Weydahl, D.J., 2010. Deriving forest monitoring variables from X-band InSAR SRTM height, Canadian Journal of Remote Sensing, Vol. 36(1), pp. 68–79.
Solberg, S.; Astrup, R.; Breidenbach, J.; Nilsen, B.; Weydahl, D., 2013. Monitoring spruce volume and biomass with InSAR data from TanDEM-X. Remote Sensing of Environment, Vol. 139, pp. 60–67.
Solberg, S., Weydahl, D., Astrup, R., 2014. Temporal Stability of X-Band Single-Pass InSAR Heights in a Spruce Forest: Effects of Acquisition Properties and Season, IEEE Transactions on Geoscience and Remote Sensing, Vol. 53(3), pp. 1607-1614.
Soja, M., Persson, H., Ulander, L., 2015. Estimation of Forest Height and Canopy Density From a Single InSAR Correlation Coefficient, IEEE Geoscience and remote sensing letters, Vol. 12(3), pp. 646-650.
Vastaranta, M., Niemi, M., Karjalainen, M., Peuhkurinen, J., Kankare, V., Hyyppä, J., Holopainen, M., 2014. Prediction of Forest Stand Attributes Using TerraSAR-X Stereo Imagery, Remote Sensing, Vol. 6(4), pp. 3227-3246.
Yu, X., Hyyppä, J., Vastaranta, M., Holopainen, M., Viitala, R., 2011. Predicting individual tree attributes from airborne laser point clouds based on the random forest technique, ISPRS Journal of Photogrammetry and Remote Sensing, Vol. 66(1), pp. 28–37.