GROUND SUBSIDENCE MONITORING OVER JIAXING REGION, ZHEJIANG
PROVINCE FROM 2006 TO 2010 USING TIME SERIES INSAR TECHNIQUE
H. A. Wu a, *, Y. H. Zhanga ,G. F. Luo b, W. H. Mao b, Y. H. Kanga, Y. Jin b a
Chinese Academy of Surveying and Mapping, 100830 Haidian District, Beijing, China - (wuha, yhzhang) @casm.ac.cn b
Zhejiang Academy of Surveying and Mapping, 310012 Xihu District, Hangzhou, China - [email protected], [email protected], [email protected]
KEY WORDS: Ground subsidence, InSAR, time series, Jiaxing
ABSTRACT:
Because of over-exploration of groundwater for a long time, Jiaxing region, northeast of Zhejiang province has suffering serious ground subsidence during the past several decades. In this paper, we investigate the time series InSAR technique for the generation of subsidence maps over Jiaxing region. 25 ENVISAT ASAR images acquired from Jan 2006 to Aug 2010 are used. The results show that serious subsidence has taken place in Xiuzhou district, Jiashan county, Pinghu county and Haiyan county. 4 subsidence centers, namely Huanggu town in Pinghu, Wangjiangting town in Xiuzhou, Tianning townin Jiashan, and Wuyuan town in Haiyan. 3 obvious subsidence belts are distributed in Jiaxing. Meanwhile in Tongxiang county, Haining county and Nanhu district, there is relatively seldom subsidence. The results are compared with 35 levelling measurements. The standard deviation of the error between the two data is 4.25 mm/year, which demonstrate that time series InSAR technique has good accuracy for subsidence monitoring in Zhejiang province, southeast of China, covered with lots of vegetation and waters.
* Corresponding author
1. INTRODUCTION
Ground subsidence of Jiaxing began in the urban area in 1964 and it experienced a stage of formation and slow, remarkable and dramatic development. By the end of 1990s, the ground subsidence had rapidly spread throughout the Jiaxing region. The land area of Jiaxing city is 3915 square kilometers, while as of 2009, the subsidence area has more than 3300 square kilometers with accumulative subsidence above 100 mm. subsidence center has also been transferred from Jiaxing old urban area to Wuyuan town, Haiyan county. Meanwhile, several secondary subsidence hoppers had formed in Wangjiangting, Danghu, Yuanhua, Changan, Tudian, Wuzhen and Chongfu.
It is necessary to monitor the deformation of this city accurately and duly. Traditional ways of monitoring ground deformation are leveling and GPS measurement. They have the advantage of high accuracy. However, they are very costly and cannot achieve enough spatial sampling density. With the development of radar remote sensing technique, differential interferometric SAR (DInSAR) is playing an important role in monitoring ground deformation.
However, for long term deformation, conventional 2-pass or 3-pass DInSAR can be easily affected by temporal or geometric de-correlation which degrades the interferometric phase and makes it difficult to extract useful information (Ferretti 1999). To solve this problem, some advances in this field have been introduced based on point target analysis, including permanent scatterers (PS) method (Ferretti 2000 and 2001, Vilardo 2009, Zhang 2011), small baseline subsets (SBAS) method (Berardino 2002, Casu 2008) and coherent points (CP) method (Mora 2003, Wu 2011, Zhang 2012). In this paper, we investigate the small baseline time series InSAR technique for the generation of
deformation maps of this city. 25 ENVISAT ASAR images acquired from Jan 2006 to Aug 2010 are used.
2. STUDY AREA AND DATASETS 2.1 Study area
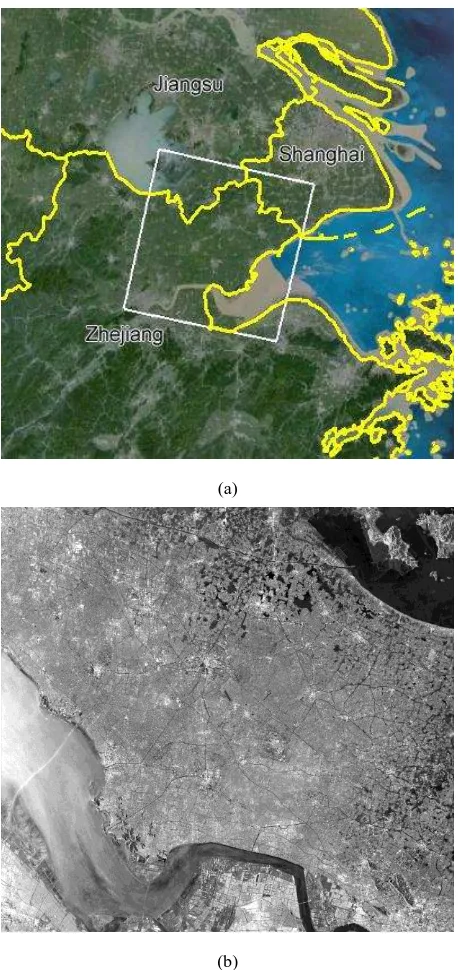
The downtown and surrounding areas of Jiaxing city was selected as the study area, with a length of 108 km and width of 104 km. The central geographic coordinates of the area is 30.66°N and 120.67°E. Figure 1(a) shows the coverage of study area, which is provided by Google Earth. Figure1 (b) gives the average SAR amplitude image.
2.2 Datasets
SAR images used in this paper include 25 ENVISAT ASAR single look complex (SLC) images, acquired from January 22 2006 to August 29 2010. These data were obtained in descending direction, with an incidence angle of 22.8°. The azimuth resolution is about 4.06m and the range resolution is about 7.80m. Table 1 shows the temporal and perpendicular baselines of these SAR data.
In addition, to remove the topographic phase from interferograms, digital elevation model (DEM) generated by Shuttle Radar Topography Mission (SRTM) with 3 arc-second resolution (about 90m) is used. To validate the deformation results retrieved by time series InSAR, 35 leveling measurements in Haiyan, Pinghu, Xiuzhou and Nanhu from 2006 to 2010 are collected.
The International Archives of the Photogrammetry, Remote Sensing and Spatial Information Sciences, Volume XL-7/W4, 2015 2015 International Workshop on Image and Data Fusion, 21 – 23 July 2015, Kona, Hawaii, USA
This contribution has been peer-reviewed.
(a)
(b)
Figure 1. Optical image of study area (provided by Google Earth) (a) and the average amplitude image of 25 ENVISAT
ASAR images (b)
3. METHODS
There are two parts contained in the small baseline time series InSAR technique, including linear deformation retrieval and non-linear deformation retrieval. Let us start our analysis by considering N SAR images acquired at the ordered times. Based on the principle of small spatial and temporal baselines, we can generate M interferograms. Before linear deformation retrieval, high coherence point targets are selected according to pixel’s coherence stability by setting a suitable coherence threshold for the mean coherence image. Based on these point targets, differential phase are connected with Delaunay triangulation. Thus the phase slope between two neighboring points
(
xm,
ym), ( ,
x yn n)
on an edge can be expressed as
Table 1. List of the perpendicular and temporal baselines of 25 ENVISAT ASAR images decorrelation noise. It is assumed that, within the atmospheric correlation range 1-3km, the atmospheric phases are equal, thus the atmospheric components can be neglected. For the linear deformation velocity and height error are constants, thus the above phase slope can be modelled as
# Date Perpendicular
The International Archives of the Photogrammetry, Remote Sensing and Spatial Information Sciences, Volume XL-7/W4, 2015 2015 International Workshop on Image and Data Fusion, 21 – 23 July 2015, Kona, Hawaii, USA
This contribution has been peer-reviewed.
respectively. They can be retrieved by maximizing the following Ensemble Phase Coherence (EPC) (Ferretti, 2000)mod velocity and height error increments are close to the real value. Then, the linear velocity and height error on each point target is obtained by integrating
vmod el and
mod el with EPC over 0.7 from a starting reference point.To retrieve non-linear deformation, it is necessary to calculate the model phase contributed by linear deformation and height errors. By subtracting the model phase from differential phase, we get residual phases, which mainly include atmospheric phase, non-linear deformation component and phase noises. Phase noises can be reduced by spatial low pass filtering. Atmospheric phase and non-linear deformation can be separated according to their different frequency characteristics in temporal and spatial domains.
4. RESULTS AND DISCUSSION
60 interferograms with perpendicular baselines less than 300m and temporal baselines within 1 year are generated. 281827 high coherent point targets are selected with the average coherence above 0.48 and amplitude difference dispersion index below 0.4. Using small baseline InSAR technique described as section 3, average subsidence velocity and accumulated deformation over point targets are retrieved.
Figure 2 shows the average subsidence velocity in Jiaxing city from Jan 2006 to Aug 2010, from which we can see that serious subsidence has taken place in Xiuzhou district, Jiashan county, Pinghu county and Haiyan county. 4 subsidence centers, namely Huanggu town in Pinghu with an average velocity of -108 mm/year, Wangjiangting town (-73 mm/year) in Xiuzhou, Tianning town 63 mm/year) in Jiashan, and Wuyuan town (-57mm/year) in Haiyan. 3 obvious subsidence belts are distributed in Jiaxing, including the Wangjiangting-Tianning belt in the north of Jiaxing, the Huanggu-Guangchen belt in the east, and Wuyuan-Baibu-Tudian belt in the middle of Jiaxing. Meanwhile in Tongxiang county, Haining county and Nanhu district, there is relatively seldom subsidence. The reason is that in these areas tough measures against exploitation of groundwater have been taken since 2008.
Remarkably, compared with Jiaxing city, the ground subsidence in neighboring Shengze town, Suzhou city, Jiangsu province is very serious. The subsidence velocity is up to -127 mm/year, which is significantly faster than that of the surrounding area, forming a larger subsidence hopper. It also suggests that the measurements controlling groundwater exploitation in this stage has achieved good effects.
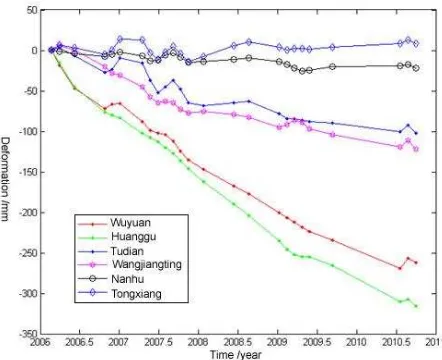
Figure 3 shows the accumulative subsidence curves of 6 coherent points in Wuyuan, Huanggu, Tudian, Wangjiangting, Nanhu and Tongxiang. It can be seen that the subsidence velocity in Huanggu is the fastest with the most accumulative subsidence. Wuyuan takes the second place with an accumulative subsidence of -262mm during the four years. Wangjiangting and Tudian have less subsidence, 121mm and -102 mm, respectively. Compared with the new subsidence centers, there is seldom subsidence in the old centers such as the urban area in Jiaxing (Nanhu) and Tongxiang. Ground bounce even takes place in the urban area of Tongxiang with a rebound of 8mm.
Figure 2. Average subsidence velocity in Jiaxing (2006-2010). The red points are 6 coherent points whose accumulative subsidence is shown in Figure 3. The numbers 1-8 represents subsidence centers in the study area, which are 1-Shengze town,
belonging to Suzhou city, Jiangsu province, 2-Wangjiangting town, 3-Youchegang town, 4-Tianning town, 5-Huanggu town,
6-Tudian town, 7-Baibu town, 8-Wuyuan town.
Figure 3. Accumulative subsidence of 6 coherent points from 2006 to 2010.
The International Archives of the Photogrammetry, Remote Sensing and Spatial Information Sciences, Volume XL-7/W4, 2015 2015 International Workshop on Image and Data Fusion, 21 – 23 July 2015, Kona, Hawaii, USA
This contribution has been peer-reviewed.
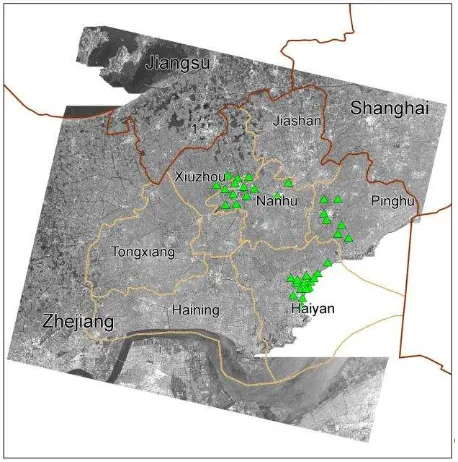
To validate the time series InSAR results, 35 levelling measurements in Nanhu district, Xiuzhou district, Pinghu county and Haiyan county distributed as Figure 4 are used. These data are measured from 2006 to 2010. The errors between InSAR results and levelling measurements are shown in Figure5, from which we can see the absolute error of all 35 points are within 10 mm/year. 30 points (85.71%) have an error ranging from -6 to 6 mm/year. The error's standard deviation is 4.25 mm/year, which demonstrates the agreement between them is very good.
Figure 4. Distribution of levelling points
Figure 5. The errors between levelling measurements and InSAR results
5. CONCLUSION
We applied small baseline time series InSAR technique to investigate ground deformation in Jiaxing city Jan 2006 to Aug 2010 by using 25 ENVISAT ASAR images. Results show that the subsidence is mainly taken place in Huanggu, Wangjiangting, Tianning, and Wuyuan. The maximum subsidence velocity can reach to -108mm/year. The results are
compared with 35 levelling measurements. The standard deviation of the errors between the two data is 4.25 mm/year, which demonstrate that time series InSAR technique has good accuracy.
ACKNOWLEDGEMENTS
This research was supported by National Natural Science Foundation of China (No. 41304010, No. 41271430). The leveling measurement data was provided by Zhejiang Academy of Surveying and Mapping. ESA is gratefully acknowledged for contributing ENVISAT ASAR data to support this research. We also thank USGS for supporting the SRTM DEM used in this paper.
REFERENCES
Ferretti, A., Rocca, F., Prati, C, 1999. Permanent scatterers in SAR interferometry. IGARSS 1999, 3, pp. 1528-1530.
Ferretti, A., Prati, C., Rocca, F, 2009. Nonlinear subsidence rate estimation using permeanent scatterers in differential SAR interferometry. IEEE Trans Geosci Remote Sens, 28(5), pp. 2202-2212.
Ferretti, A., Prati, C., Rocca, F, 2001. Permanent scatterers in SAR interferometry. IEEE Trans Geosci Remote Sens, 39(1), pp. 8-20.
Vilardo, G., Ventura. G., Terranova. C., et al, 2009. Ground deformation due to tectonic, hydrothermal, gravity, hydrogeological, and anthropic processes in the Campania Region (Southern Italy) from Permanent Scatterers Synthetic Aperture Radar Interferometry. Remote Sensing of Environment, 113, pp. 197-212.
Zhang, Y., Zhang, J., Wu, H., et al, 2011. Monitoring of urban subsidence with SAR interferometric point target analysis: A case study in Suzhou, China. International Journal of Applied Earth Observation and Geoinformation, 13, pp. 812-818. Berardino, P., Fornaro, G., Lanari, R., et al, 2002. A new algorithm for surface deformation monitoring based on small baseline differential SAR interferograms. IEEE Trans Geosci Remote Sens, 40(11), pp. 2375-2383.
Casu. F., Manzo, M., Pepe, A., et al, 2008. SBAS-DInSAR Analysis of Very Extended Areas: First Results on a 60 000-km2 Test Site. IEEE Trans. Geosci. Remote Sensing Letters, 5 (3), pp. 438-442.
Mora, O., Mallorqui, J., Broquetas, A, 2003. Linear and nonlinear terrain deformation maps from a reduced set of interferometric SAR images, IEEE Trans Geosci Remote Sens, 41(10), pp. 2243-2253.
Wu, H., Zhang, Y., Chen, X., et al, 2011. Ground deformation monitoring using small baseline DInSAR technique; A case study in Taiyuan City from 2003 to 2009. Chinese J. Geophys (in Chinese), 54 (3), pp. 673-680.
Zhang, Y., Wu, H., Sun, G., 2012. Deformation model of time series interferometric SAR techniques. Acta Geodaetica et Cartographic Sinica (in Chinese), 41(6), pp. 864-869.
The International Archives of the Photogrammetry, Remote Sensing and Spatial Information Sciences, Volume XL-7/W4, 2015 2015 International Workshop on Image and Data Fusion, 21 – 23 July 2015, Kona, Hawaii, USA
This contribution has been peer-reviewed.