Study of the Effects of Target Geometry on Synthetic Aperture Radar Images using
Simulation Studies
K. Tummala a,*, A. K. Jha a, S. Kumar b a
Geoinformatics Dept., Indian Institute of Remote Sensing, Dehradun, India – [email protected], [email protected] bPhotogrammetry and Remote Sensing Dept., Indian Institute of Remote Sensing, Dehradun, India – [email protected]
Commission VIII
KEY WORDS: SAR, Simulation, DEM, Radar, Satellite, Surface, Targets, RADARSAT
ABSTRACT:
Synthetic aperture radar technology has revolutionized earth observation with very high resolutions of below 5m, making it possible to distinguish individual urban features like buildings and even cars on the surface of the earth. But, the difficulty in interpretation of these images has hindered their use. The geometry of target objects and their orientation with respect to the SAR sensor contribute enormously to unexpected signatures on SAR images. Geometry of objects can cause single, double or multiple reflections which, in turn, affect the brightness value on the SAR images. Occlusions, shadow and layover effects are present in the SAR images as a result of orientation of target objects with respect to the incident microwaves. Simulation of SAR images is the best and easiest way to study and understand the anomalies. This paper discusses synthetic aperture radar image simulation, with the study of effect of target geometry as the main aim. Simulation algorithm has been developed in the time domain to provide greater modularity and to increase the ease of implementation. This algorithm takes into account the sensor and target characteristics, their locations with respect to the earth, 3-dimensional model of the target, sensor velocity, and SAR parameters. two methods have been discussed to obtain position and velocity vectors of SAR sensor – the first, from the metadata of real SAR image used to verify the simulation algorithm, and the second, from satellite orbital parameters. Using these inputs, the SAR image coordinates and backscatter coefficients for each point on the target are calculated. The backscatter coefficients at target points are calculated based on the local incidence angles using Muhleman’s backscatter model. The present algorithm has been successfully implemented on radarsat-2 image of San Francisco bay area. Digital elevation models (DEMs) of the area under consideration are used as the 3d models of the target area. DEMs of different resolutions have been used to simulate SAR images in order to study how the target models affect the accuracy of simulation algorithm. The simulated images have been compared with radarsat-2 images to observe the efficiency of the simulation algorithm in accurately representing the locations and extents of different objects in the target area. The simulated algorithm implemented in this paper has given satisfactory results as the simulated images accurately show the different features present in the DEM of the target area.
1. INTRODUCTION
Geometry of a target object is one of the factors which contribute to the way the target’s signature appears on a Synthetic Aperture Radar (SAR) image. It is also one of the main reasons for difficulties in understanding and interpreting SAR images, as it leads to deviations from expected signatures on SAR images. This can be overcome through experience, or if a database of the signatures of different objects is created. In this paper, the technique of SAR image simulation has been discussed in order to study how different objects appear in SAR images owing to their geometries.
Simulation of SAR images can be done using various techniques, both in time domain and frequency domain. Each technique caters to a different need. Urban feature recognition and extraction is a major area where microwave remote sensing is widely used. The distortions caused doe to high-rise buildings in urban areas has been removed by comparing the real SAR images having distortions with simulated SAR images (Balz, 2004). Physical Optics and diffraction theory have been used to simulate very high resolution images of individual objects like aircrafts, with the aim of using these images for automatic target recognition (Chang, Chiang, and Chen, 2011). Another highly effective technique that has been successful in simulating very high resolution images of even individual building in an urban area uses the ray tracing technique (Auer, Hinz, and Bamler 2010).
In this paper, a time domain technique and a very simple backscatter model for simulation have been explained. The major, if not only, area focus for simulation is to study how geometrically accurate an image the simulation algorithm can generate of the area considered. The steps involved in simulation are explained in the next section.
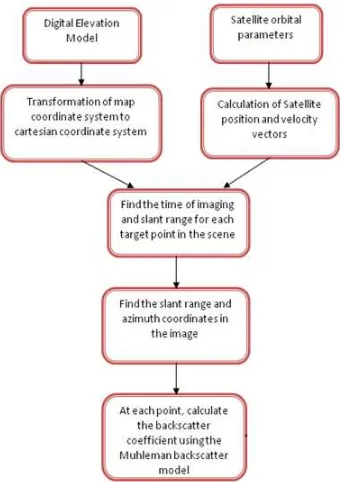
2. STEPS IN SIMULATION
Though there are a number of factors that contribute to the formation of a SAR image, the most important factors considered in this algorithm are: 3D model of the target, position of SAR sensor, position of the target with respect to the sensor, velocities of sensor and target, wavelength of the
The Digital Elevation model acts as the 3D model of the target, so the target is an area on the surface of the earth. DEM is a raster product that has elevation information at each pixel. This information is converted into a matrix containing three columns - latitude, longitude and elevation. These coordinates are converted into Earth-Centered-Earth-Fixed coordinate system, which is a 3D Cartesian coordinate system.
2.2 Sensor position and velocity
The SAR sensor’s position and velocity vectors with respect to time are required for simulation. Two-Line Element datasets, if available for the sensor under consideration, can be used to obtain the orbital parameters of the satellite carrying the sensor.
Figure 1: Methodology for simulation
These can further be used to calculate the position and velocity vectors.
If the metadata of the satellite carrying SAR sensor is available, the positions and velocities of the sensor can be obtained
where S(t) is the satellite position vector and P(t) is the position of DEM cell. Time of imaging, 't' for each DEM cell is found by solving the Doppler equation. The Doppler frequency shift due to the motion of the SAR sensor is given by:
(2)
where Vs(t) is the sensor velocity vector, Vp(t) is the target velocity vector and λ is the radar wavelength. The target velocity Vp(t) is due to the earth's rotation, and is given by The International Archives of the Photogrammetry, Remote Sensing and Spatial Information Sciences, Volume XL-8, 2014
(3)
where is the angular velocity of Earth's rotation (Liu, Zhao, and Jezek, 2004).
The Doppler centroid frequency is given by the formula
(4) following non-linear equation is solved using the Newton-Raphson method.
(5)
Once the time of imaging 't' is calculated for each DEM cell, its row number in the slant range image is given by
(6)
where toffsetis the time of first line and δt is the time between adjacent lines, both of which are obtained from the product metadata.
The column number of the DEM cell in the slant range image is given by
(8)
where Roffsetis the range of first sample and δR is the spacing between adjacent pixels. intensity in a SAR image is a combination of both system and terrain effects (Curlander and McDonough 1991). System effects include characteristics like polarization which are constant. The terrain effect is represented as the backscatter coefficient. For this, the Muhleman’s backscatter model is used. According to this model, the backscatter is given by
(10)
where M is Muhleman’s constant that depends on the average terrain slope. A modified form of Muhleman’s model, with empirically determined constants is used in this study (Storvold et al. 2004). The modified Muhleman’s model is
(11)
The backscatter at each pixel is calculated using equation. Now, the row number, column number and intensity value of each pixel has been determined. The image generated using these values is the simulated SAR image.
3. RESULTS
The simulation algorithm explained in the previous section has been implemented on the RADARSAT-2 images of San Francisco Bay area and ALOS PALSAR images of Uttarakhand area in India.
Figure 2: ASTER DEM of San Francisco Bay area
Figure 4: ASTER DEM of Uttarakhand area
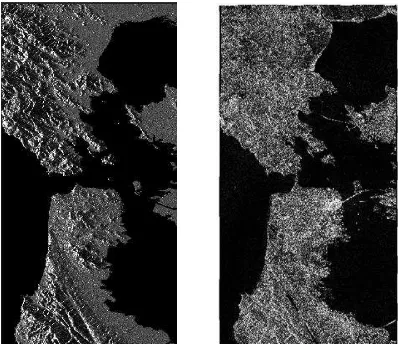
Figure 5: Image simulated using ASTER DEM
Though the intensity values throughout the images do not match for real and simulated images, the simulated image accurately shows the terrain structure. In general, this shows that the simulation algorithm presented here gives an accurate representation of the target geometry.
4. CONCLUSIONS
The correlation between the simulated and real SAR images is only about 60%. This is because the surface properties of the different features on the ground are not taken into account in the simulation algorithm. This leads to non-uniform differences in the backscatter values of different features. For instance, the Muhleman constant in the Muhleman's backscatter model is determined empirically for rocky surfaces. So, if the ground is predominantly rocky with no other major features, the algorithm gives better results. If, on the other hand, the area has different features like vegetation, urban structures, etc., the error in simulated output is greater.
The SAR images have been simulated using DEMs of different resolutions. They show that the resolution of the 3D model used (DEM in this case) affects the quality of the final simulated SAR image. Though a model of higher resolution gives a more accurate SAR image than that of a lower resolution, it also uses greater memory and computational power. The choice between accuracy and computational power must be made depending on the application.
In the future, an attempt can be made to increase the scope of this algorithm by using a better backscatter model. The simulation algorithm used in this study has given fairly good results for Digital Elevation Models, but uses the Muhleman's backscatter model to calculate the backscattered intensity. This model cannot be used at high resolutions, as it can't account for changes in the surface properties of different objects. So, to simulate images of high resolutions, a model which accounts for the dependency of backscattered intensity on target surface characteristics must be used. Now that the algorithm works for Digital Elevation Models, it can be extended to 3D models of individual objects to study how geometry and composition of a target affect SAR images.
REFERENCES
Auer, S., S. Hinz, and R. Bamler. 2010. “Ray-Tracing Simulation Techniques for Understanding High-Resolution SAR Images.” IEEE Transactions on Geoscience and Remote Sensing 48 (3): 1445–56. doi:10.1109/TGRS.2009.2029339. Figure 3(a): Image simulated from ASTER DEM;
Figure 3(b): Real SAR image of RADARSAT-2
Balz, Timo. 2004. “SAR Simulation Based Change Detection with High-resolution SAR Images in Urban Environments.” IAPRS Vol. 35, Part B.
Chiu, Shen, and Chuck Livingstone. 2005. “A Comparison of Displaced Phase Centre Antenna and Along-track Interferometry Techniques for RADARSAT-2 Ground Moving Target Indication.” Canadian Journal of Remote Sensing 31 (1): 37–51.
Curlander, John C., and Robert N. McDonough. Synthetic aperture radar. Vol. 199. No. 1. New York: Wiley, 1991.
Liu, Hongxing, Zhiyuan Zhao, and Kenneth C. Jezek. 2004. “Correction of Positional Errors and Geometric Distortions in Topographic Maps and DEMs Using Rigorous SAR Simulation Technique.” Photogrammetric Engineering and Remote Sensing 70 (9): 1031–42.
Storvold, Rune, K. A. Hogda, E. Malnes, and I. Lauknes. 2004. “SAR Firn Line Detection and Correlation to Glacial Mass Balance Svartisen Glacier, Northern Norway.” In Salzburg, Austria.